

What Do You Get When You Cross A Reversing Candle With A Positive Divergence?
Usually a market bottom.
Reversing candlesticks are candlesticks that portend a reversal in the security or index that you're observing. The idea behind a reversing candlestick is that after a lengthy period of rising or declining prices, market makers begin taking the other side of the trade, flooding the market with either buy or sell orders to reverse the action and profit handsomely from this action and reversal. After the S&P 500 declined for 6 consecutive sessions, a bullish engulfing candle printed on very heavy volume:
Enter S&P 500 ($SPX):
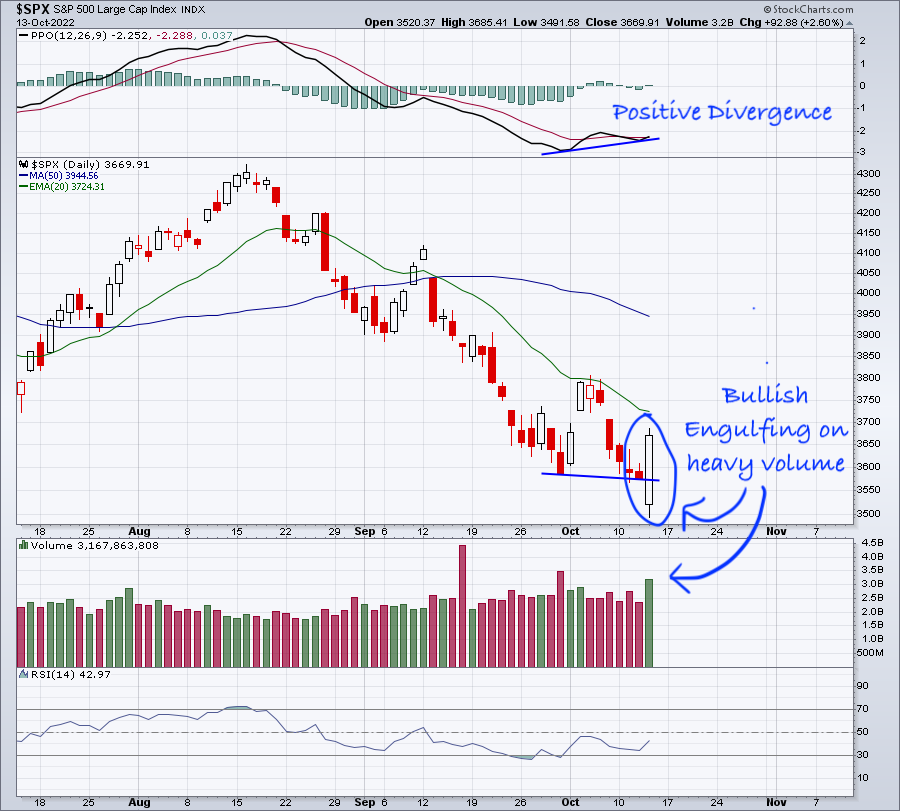
Note that when we connect CLOSING lows from late September to Wednesday's close, we see a much higher PPO. This is a signal that downward momentum is easing and then the reversing candle suggests that a new uptrend is much more likely. During trends, I use the 20-day EMA as likely resistance. But after a divergence forms, I look to 50-day SMAs as the more likely target. Currently, the S&P 500 shows a 50-day SMA of 3944 and remember - 3900 has been key support and resistance over the past several months. I believe we could be in for a move to that level to once again test what now is key price resistance. One last point. While not pictured above, we currently have a reversing candle on the weekly S&P 500 chart (subject to today's action to close out the week) and a positive divergence on that longer-term chart as well. The 50-week SMA is all the way up at 4237. A potential rally from here could find some very strong legs.
One word of caution, however. If we lose the low established on Thursday morning, after that hot CPI report, all bets are off, so be sure to keep stops in play.
 |
Happy Trading!Tom BowleyChief Market StrategistEarningsBeats.comBetter Timing. Better Trades. |