

Shooting Star Candles Off An Uptrend Spell Trouble
After a price high has been set off an uptrend, I look for a continuation pattern to emerge.
Alphabet (GOOGL) is a perfect example. GOOGL rallied for close to a year, setting a significant high in January 2024. Since then, we've seen a gap down to establish a potential inverse left shoulder, a subsequent recovery to set the left side of a neckline, a further drop to print an inverse head and a March rally all the way back up to test initial price resistance set by the left side of a neckline. That high culminated with a shooting star candle and false breakout in mid-March that established the potential right side of a neckline. Check it out:
Enter Alphabet Inc. (GOOGL):
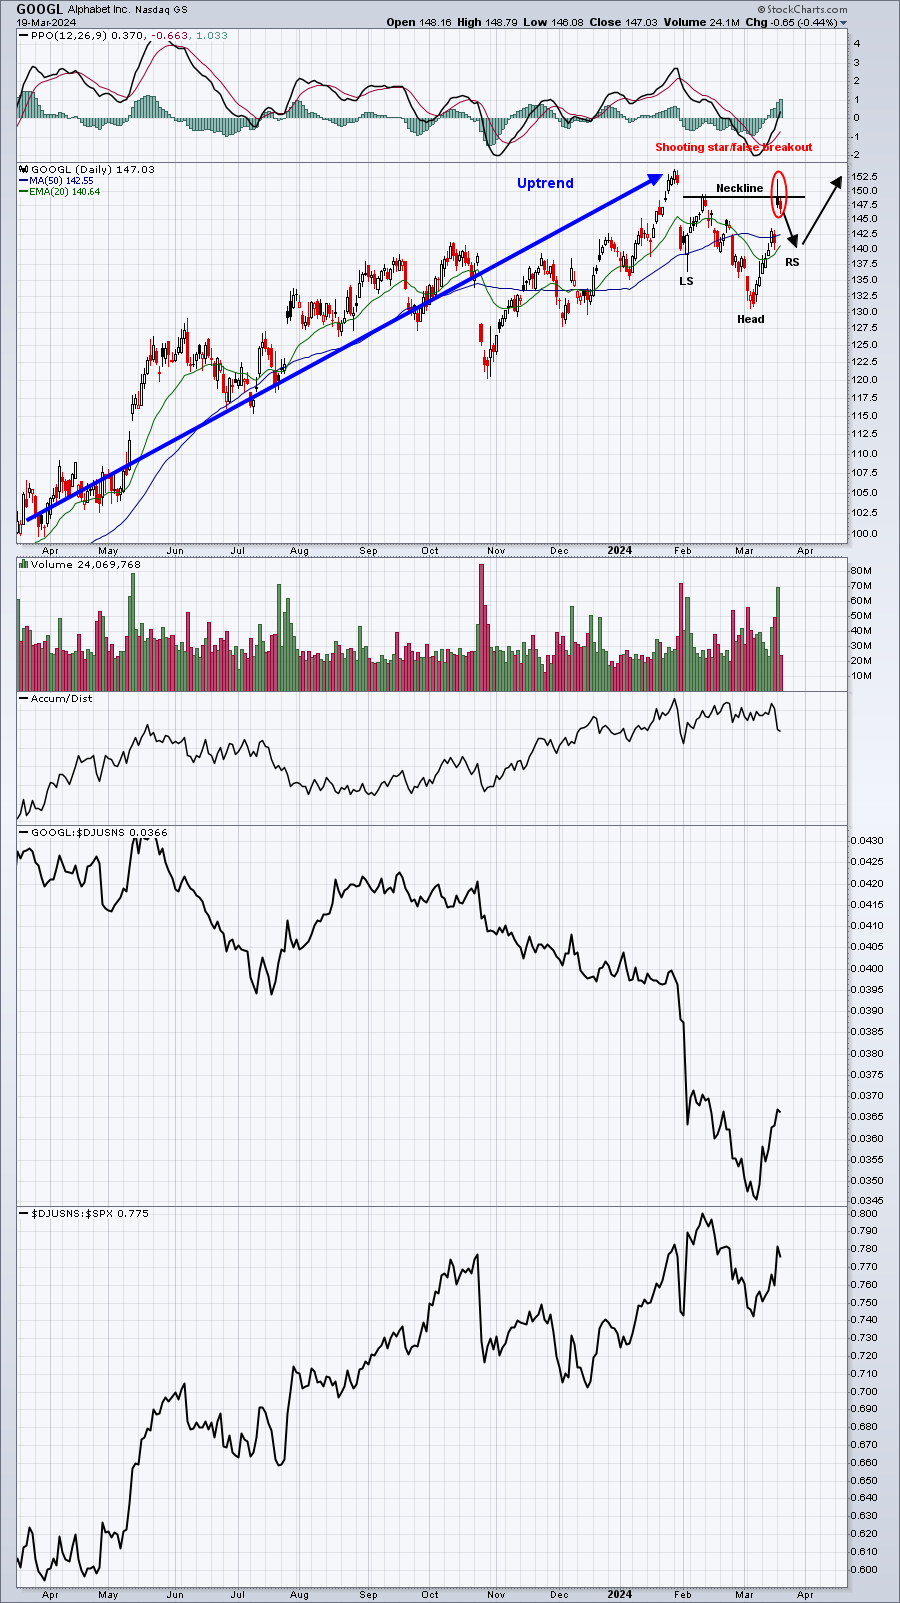
Any time we see an intraday high like we saw on that attempted breakout and a subsequent failure, I consider the possibility that market makers are not quite ready for prices to take off, instead moving lower and into a possible inverted right shoulder. GOOGL might see another trip down to 140 or so to print that right shoulder. Ultimately, a breakout above the neckline near 149 would be confirmation of a renewed uptrend. The measurement of an inverse head & shoulders is from the neckline down to the inverse head. In GOOGL's case, that would be from 149 to 131, or 18 bucks. From the breakout point of 149, we'd add 18 bucks to set our initial target at 167. Let's see how this pattern evolves.
 |
Happy Trading!Tom BowleyChief Market StrategistEarningsBeats.comBetter Timing. Better Trades. |