

Is This Chart Bullish or Bearish?
Could an answer be "BOTH?"
First, the chart I'm referring to belongs to Wabtec, Inc. (WAB). From a bullish perspective, WAB shows excellent volume trends. Also, the AD line is nearing another 2024 high. Relative strength was very strong back in April and May, but it did cool down for several weeks before turning higher again in August and September. Take a look at these bullish technical traits:
Enter Wabtec, Inc. (WAB):
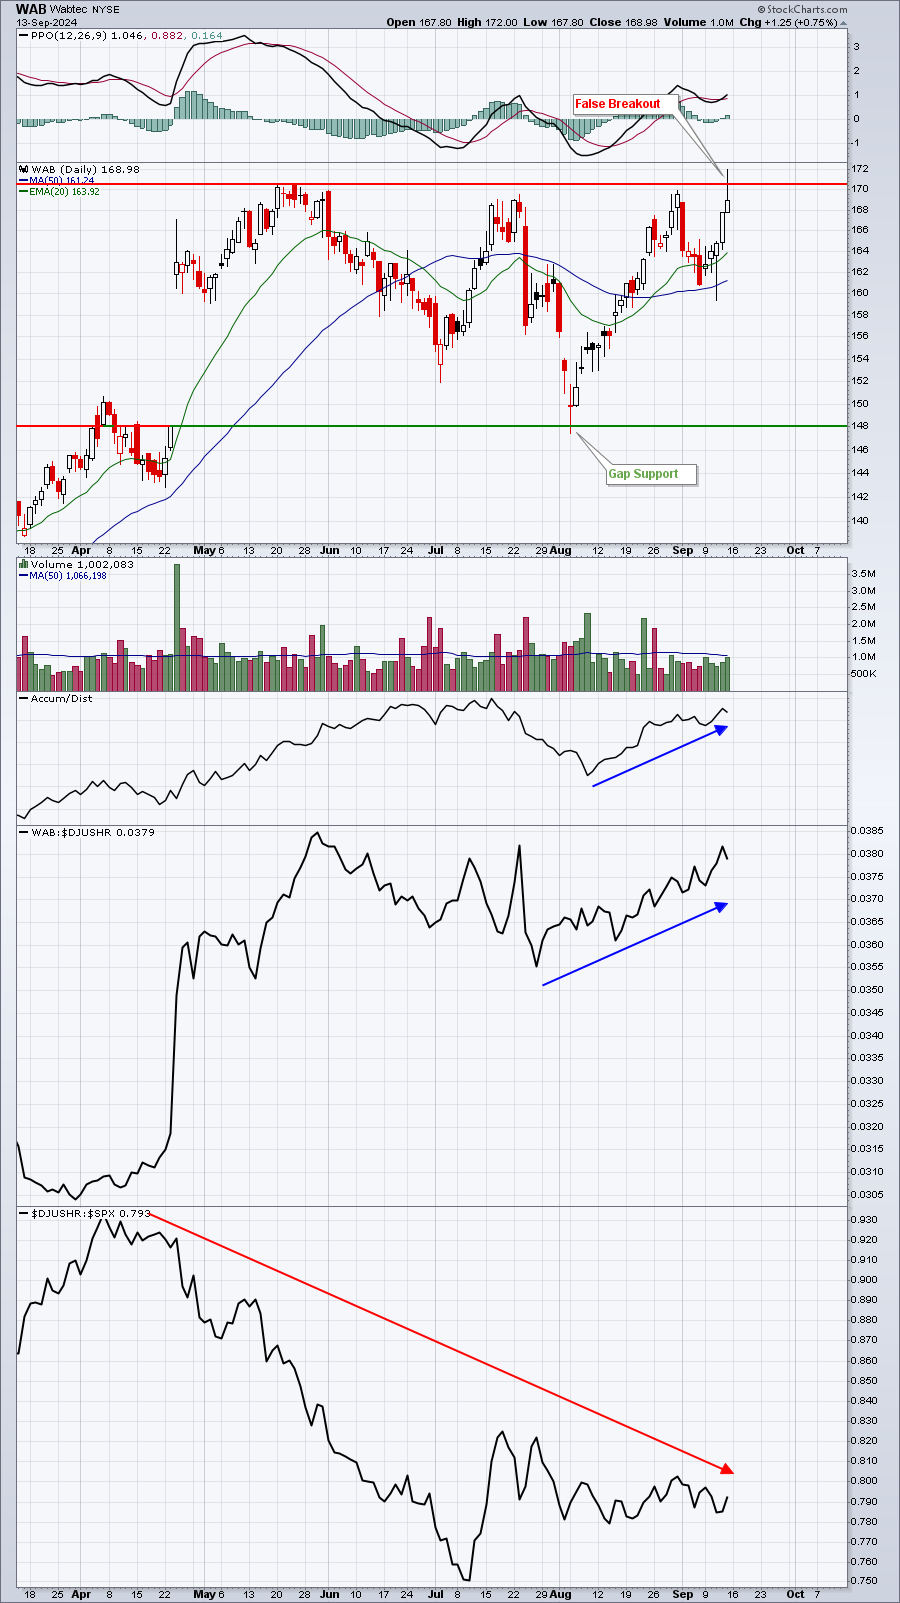
These are all signs of likely higher prices in WAB, but before you take a plunge on the long side, you should at least be aware of a significant short-term sell signal. When you see a clear price resistance level like the one just above 170, short-term tops can form on intraday breakouts above price resistance with a reversal and close beneath it. That's what we saw on Friday. So I'm bullish here based on the many positives that I outlined, but there's a very real chance of a quick selloff given the failed breakout attempt.
 |
Happy Trading!Tom BowleyChief Market StrategistEarningsBeats.comBetter Timing. Better Trades. |