

Look for Strength And Solid Results, Then Pounce on Pullbacks
I love this time of the calendar quarter. It's the busiest week of earnings season, but it's not just the companies that are reporting this week that I'm interested in.
At EarningsBeats.com, we keep a Strong Earnings ChartList (SECL) for a reason. It's a Watch List that organizes companies that report solid earnings throughout the quarter. To earn their way onto our SECL, companies must beat Wall Street consensus estimates as to both revenues and EPS. They must also be liquid (daily share volume > 200,000 shares) and looks solid technically.
I annotate the charts of every single stock on this ChartList and highlight key areas of support. Many times, that support level is gap support from earnings and/or the rising 20-day EMA.
Here's an example:
Enter Intuitive Surgical, Inc. (ISRG):
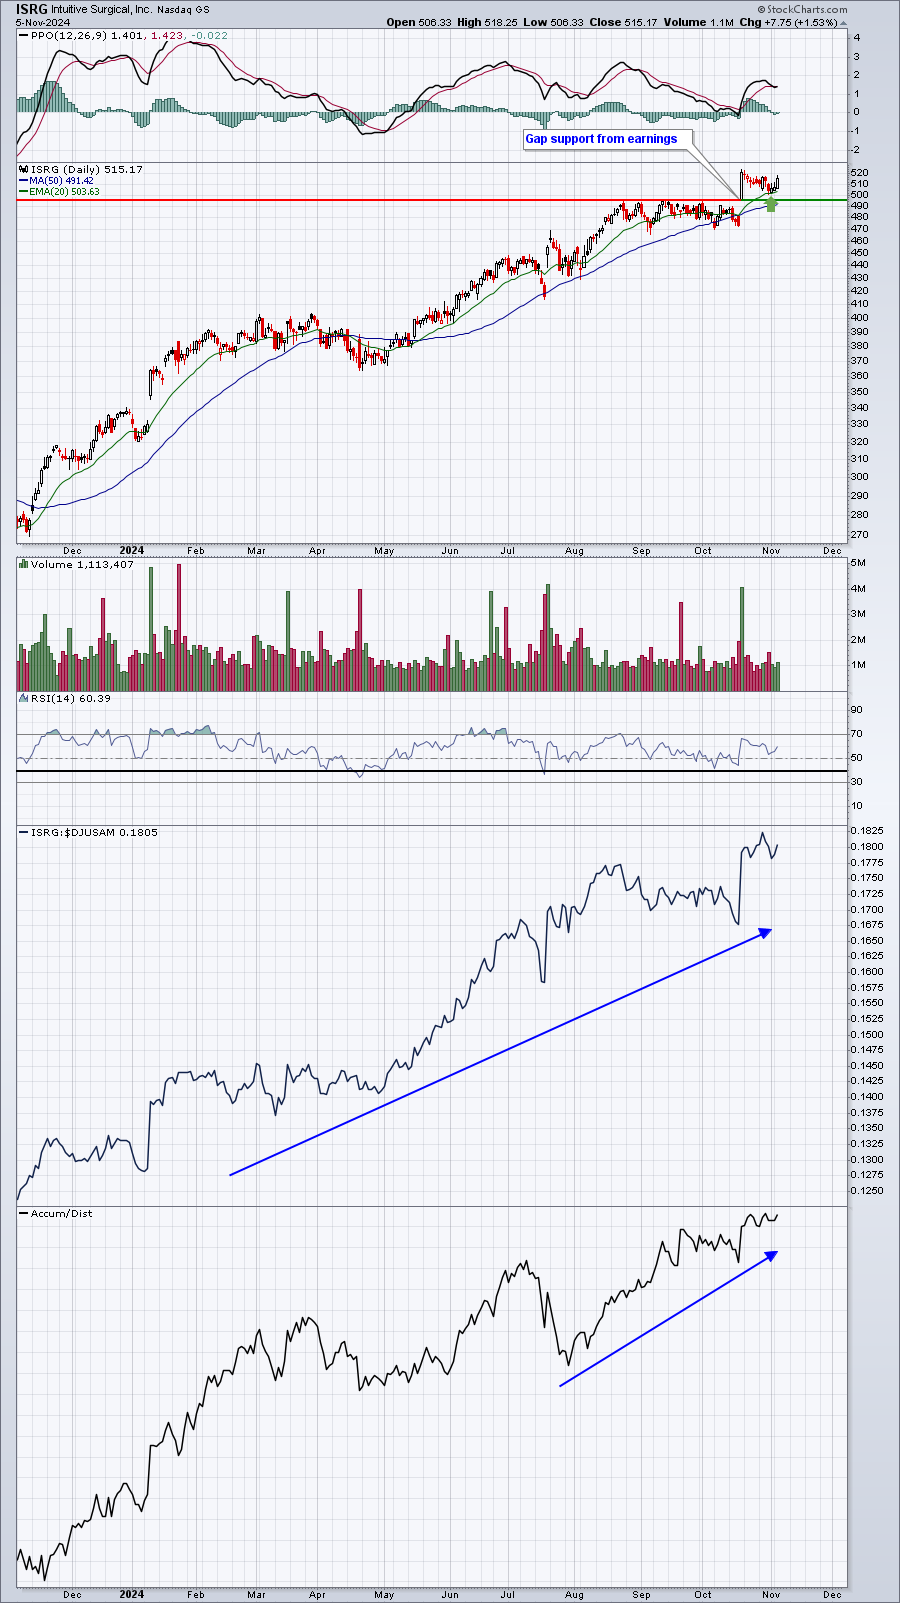
I love that earnings candlestick on ISRG from October 18th. The best entries into ISRG, in my opinion, are at gap support (496.00) and the rising 20-day EMA, currently at 503.63.
Last Thursday and Friday, ISRG tested that rising 20-day EMA when its intraday price lows were 500.67 and 502.01, respectively. ISRG is making its 2nd appearance on our EB Digest in recent months. I pointed out ISRG's long-term chart back on July 22, 2024, highlighting the quadruple top breakout in early 2024, followed by the subsequent price support test a few months later. That sent ISRG scorching higher much of this year.
After its latest blowout earnings report on October 17th, ISRG surged yet again, but its selling from nearly 525 down close to 500 provided opportunity for entry. Relative strength and strong AD (accumulation/distribution) lines are two key pieces of technical support to confirm a bullish price/volume breakout and subsequent pullback.
 |
Happy Trading!Tom BowleyChief Market StrategistEarningsBeats.comBetter Timing. Better Trades. |