

An AWESOME Long-Term Predictor of S&P 500 Direction
I have a large number of signals that I use to determine the most likely short-term and long-term stock market direction.
However, one of the strongest long-term signals comes from sentiment and I would not want to bet against it. Long-term sentiment doesn't change directions week-to-week or even month-to-month. It tends to reverse over a very long-term period, but when it does, its signals tends to be excellent.
Perhaps the biggest thing to keep in mind is that sentiment is a contrarian indicator. In other words, when sentiment is extremely bullish, we should expect future bearish action. When sentiment is extremely bearish, we should expect bullishness ahead.
The equity-only put-call ratio ($CPCE) shows how bearish (high readings) or bullish (low readings) that retail traders have become. I like to use the 253-day simple moving average (SMA) and see where it compares to history AND in which direction it's moving. Check it out currently:
Enter S&P 500 ($SPX):
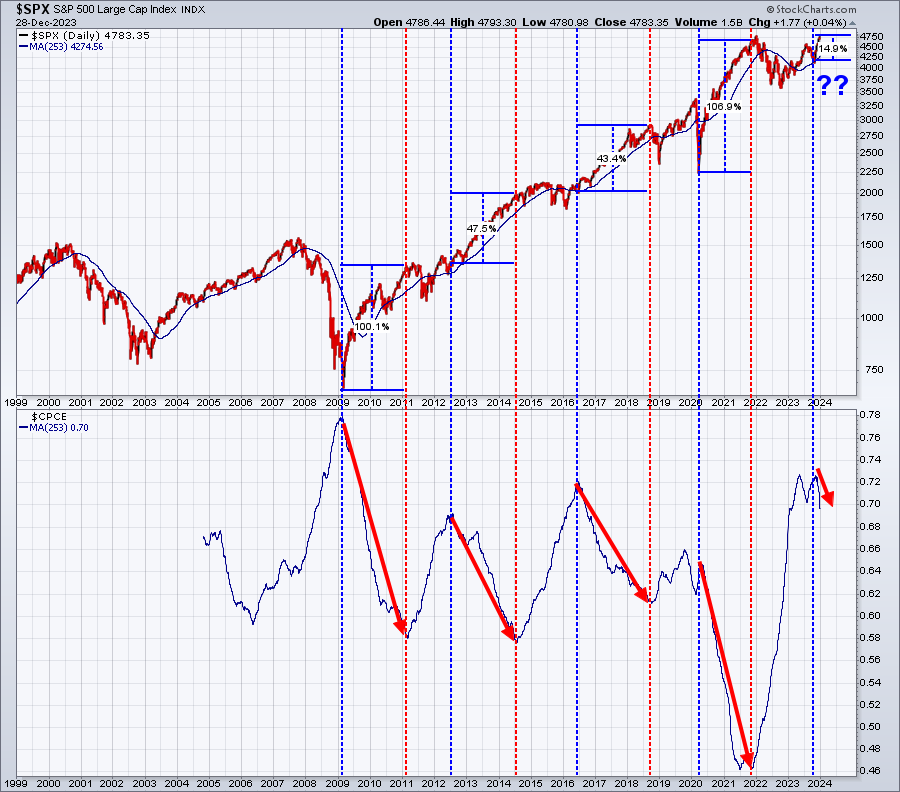
When this 253-day SMA of the CPCE is on the high end (meaning market participants have been very bearish for at least a year) and starts to roll over, it is generally a VERY BULLISH indicator for the benchmark S&P 500. Prior such occurrences have preceded HUGE stock market rallies as seen above.
Since this 253-day SMA of the CPCE began rolling over, the S&P 500 has rebounded more than 14%. But by the time this downtrend in this 253-day SMA ends, where might the S&P 500 be? 5000? 6000? 7000? Great question! I'll be providing my forecast for 2024 at MarketVision 2024 on Saturday, January 6, 2024 (register here), and there's no doubt that this long-term sentiment reading will be a big puzzle piece in determining my forecast.
 |
Happy Trading!Tom BowleyChief Market StrategistEarningsBeats.comBetter Timing. Better Trades. |