
I'm a big fan of historical trends, but they are secondary to actual price action.
In the case of investment services ($DJUSSB), however, it's very difficult to overlook its seasonal history in Q4. If we break down the average gains by quarter over the past two decades, the DJUSSB has produced returns of +0.4%, +0.4%, +1.6%, and +6.3% in quarters 1-4, respectively. That's a tremendous skewing of performance over a lengthy 20-year period. Here's the seasonality chart for DJUSSB, which shows that October produces the best average monthly return among all calendar months:
Enter Investment Services (DJUSSB):
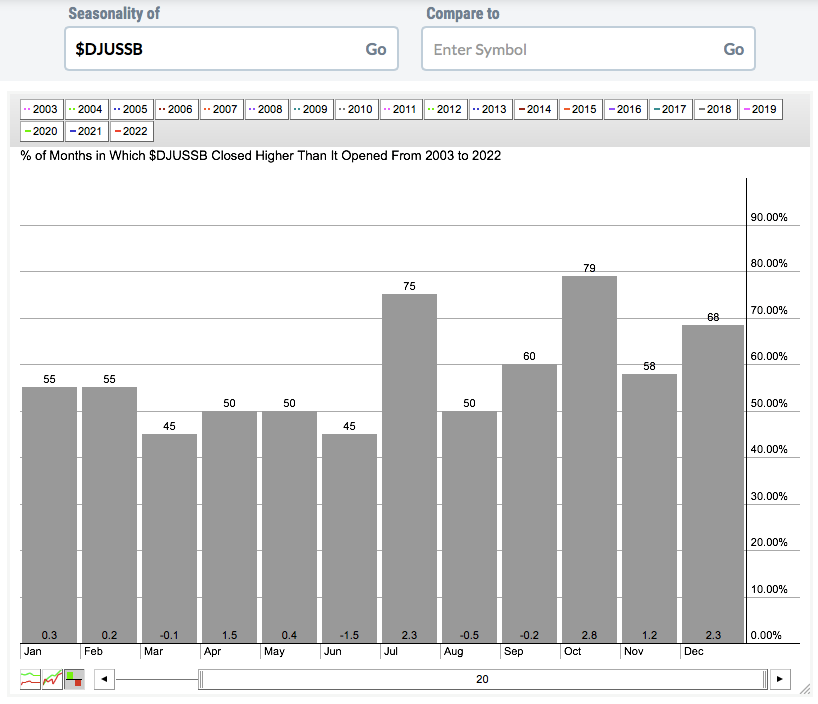
In addition to having much higher average monthly returns in Q4, and especially October, check out the percentages for how often each month finishes higher. The DJUSSB has ended October higher 79% of Octobers, 58% of Novembers, and 68% of Decembers. Currently, the DJUSSB is trending lower and is beneath its 20-day EMA, which is also beneath its 50-day SMA. This is a bearish chart setup, but given the history here, I'd place much more emphasis on any short-term breakout above the declining 20-day EMA.
 |
Happy Trading!Tom BowleyChief Market StrategistEarningsBeats.comBetter Timing. Better Trades. |