
I'll admit I don't use 75-year charts very often, but that's how far you have to go back to find a bullish uptrend line test for Boeing, Inc. (BA).
I've written a couple times about BA recently, believing the worst is behind the stock and that it could see a very strong 2023. When you look at this really long-term chart for BA below, I think you'll see why its recent lows should be very strong support:
Enter Boeing, Inc. (BA):
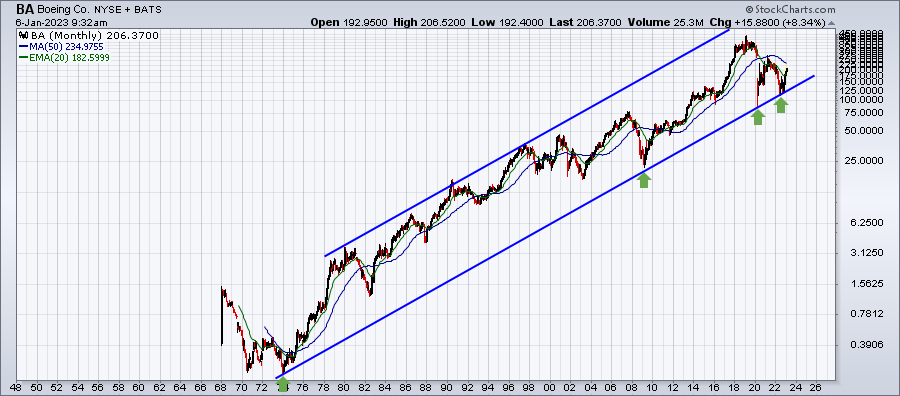
We need to connect the lows set back in 1974 and 2009 - the last two secular bear markets - to find key bottoms to establish the current uptrend line. In the chart above, that upsloping line connects the lows in 2020 and 2022 almost perfectly. None of this suggests that BA won't see "turbulence" ahead, but its "flight" path to higher levels appears rather assured, so long as this uptrend line is not violated.
In tomorrow's MarketVision 2023, the theme will be PERSPECTIVE and you get that by looking at long-term charts. I'll looking at several Big Picture charts like the one above to help forecast where prices could be headed for the next 12 months. I hope you can join me!
 |
Happy Trading!Tom BowleyChief Market StrategistEarningsBeats.comBetter Timing. Better Trades. |