
I've seen thousands and thousands of charts during my years in the stock market and I'm continually striving to learn something new.
One thing I noticed many years ago is that certain gaps can be relied upon more than others. When I analyze breakouts, I personally prefer to use opening and closing prices - as opposed to intraday prices. I believe intraday prices can many times signal false breakouts or false breakdowns. To illustrate what I like to see in a "true" breakout from a gap, let's look at Cadence Design Systems, Inc. (CDNS):
Enter Cadence Design Systems, Inc. (CDNS):
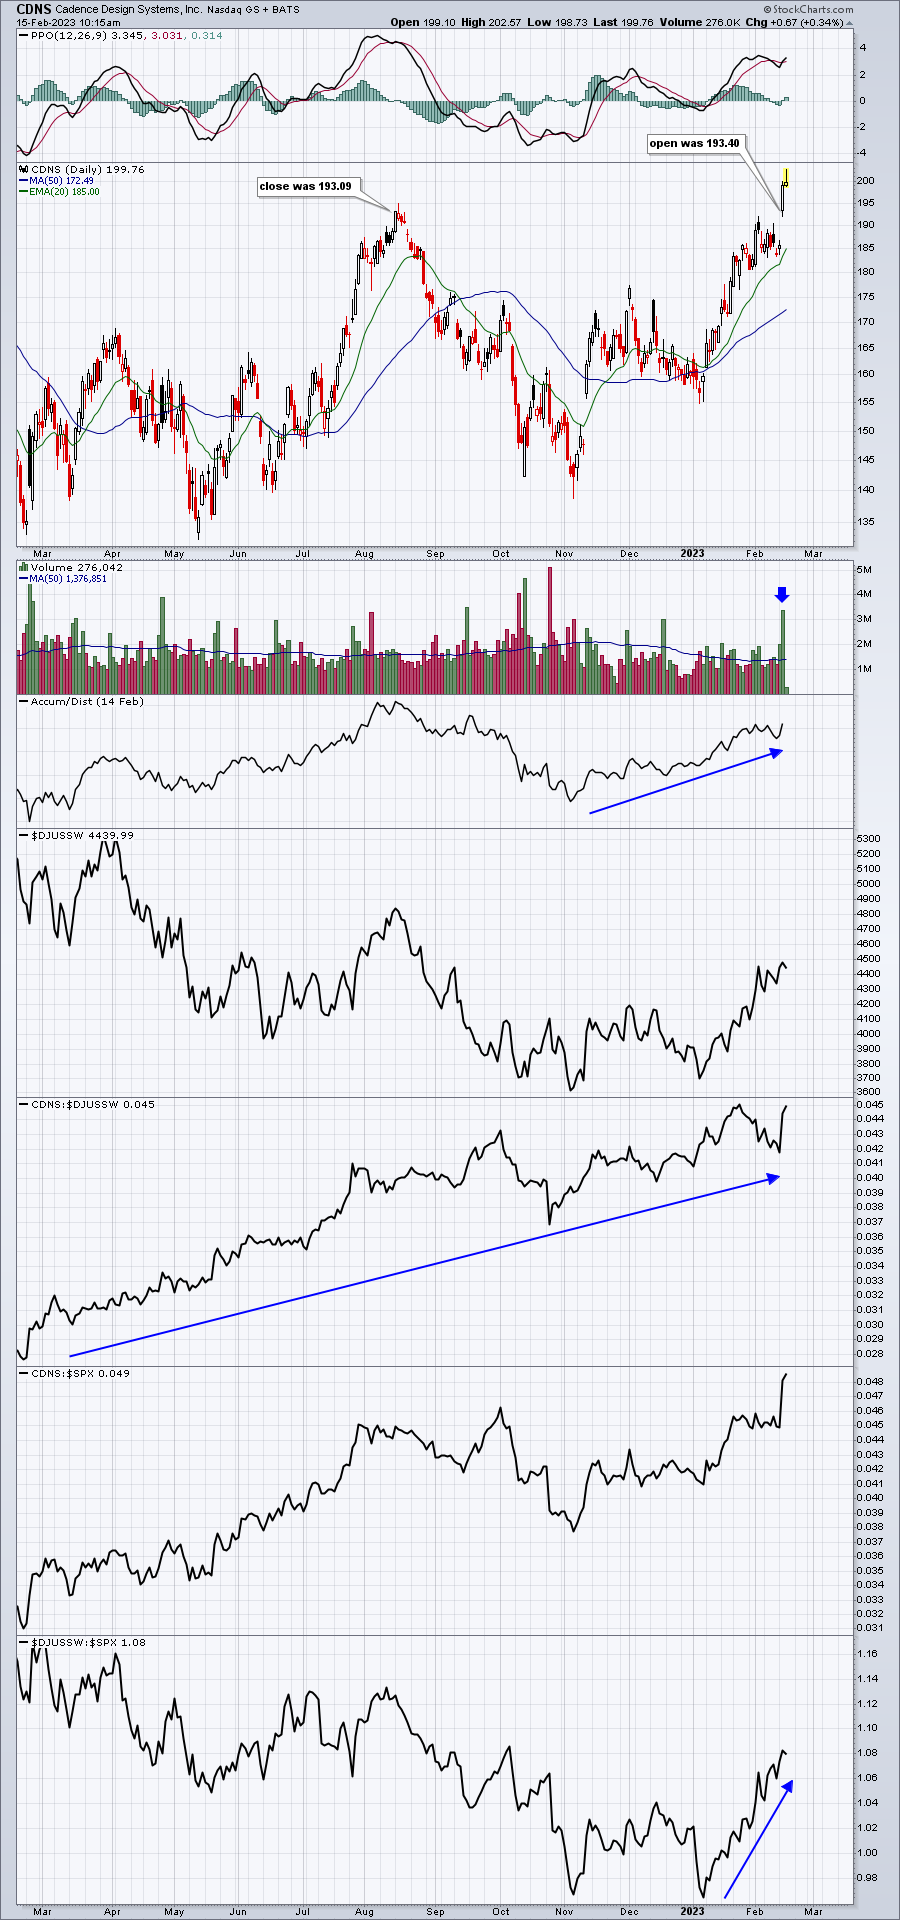
The previous high candle body (the body is the top and bottom of the rectangle) came back in mid August with a close of 193.09. Yesterday, CDNS gapped up after better-than-expected earnings and its opening price was 193.40, eclipsing that prior high close. I have never done a formal study, but my experience tells me that a gap up and breakout that clears prior candle body resistance at the opening bell has a much higher success rate than a gap up that falls short of key overhead candle body resistance.
 |
Happy Trading!Tom BowleyChief Market StrategistEarningsBeats.comBetter Timing. Better Trades. |