
I write a lot about relative strength - and for good reason.
If a stock or index is not showing relative strength, then you should probably avoid it. After all, my primary objective in investing/trading is to beat the benchmark S&P 500. If I can't do that, then I should just put my money in the SPY (ETF that tracks the S&P 500) and do something else with my time, right?
One ChartList that we provide to our annual members at EarningsBeats.com is our Industry Group Relative Strength ChartList, which features all 104 industry groups - relative to the S&P 500. I can flip through those charts very quickly and tell you in a split second whether an industry group is a leader or a laggard. This chart isn't exactly like those, but I think it'll get my point across:
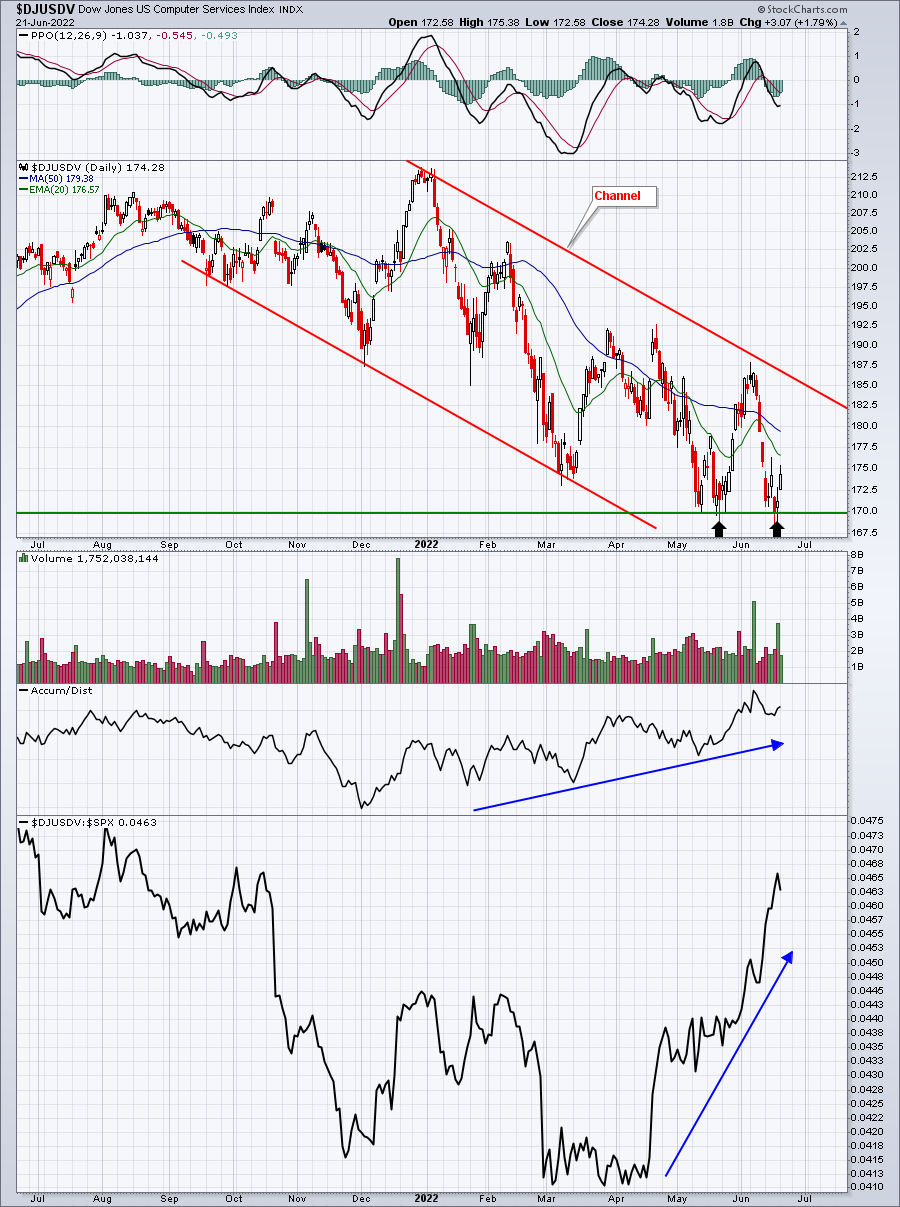
At first glance, the downtrend in computer service stocks ($DJUSDV) looks the same as the bear market downtrend we see in the S&P 500. But it's really not the same at all. The DJUSDV May price low was not pierced during the June selloff that saw the S&P 500 drop another 6% beneath its May low. That's a sign of relative strength. While it's tough to see that on the absolute price chart, if you look at the bottom panel, it's a relative price chart ($DJUSDV:$SPX).
I think it's VERY clear that the DJUSDV has been KILLING the S&P 500 since mid-April. If you haven't been paying attention to one of its component stocks, Zoom Video Communications (ZM), then you wouldn't realize that it's gained 27% over the past month and is one of the hottest stocks outside of energy. ZM and International Business Machines (IBM) are both included in our latest portfolios, because of their renewed relative strength.
 |
Happy Trading!Tom BowleyChief Market StrategistEarningsBeats.comBetter Timing. Better Trades. |