
There's a purpose and strategy to all of our ChartLists at EarningsBeats.com.
One superb ChartList for shorter-term traders is our Strong AD ChartList (SADCL). I try to update this ChartList once every month to six weeks. As the name would suggest, a strong accumulation/distribution (AD) line is a primary reason why a stock would be on this ChartList. You can read more about the AD line in ChartSchool over at StockCharts.com. Just be sure to look at the accumulation/distribution line, not the advance-decline line. These are two very different indicators. The very simple explanation of the AD line is that it rises when a stock finishes above the midpoint of its intraday trading range and it falls when it finishes below that midpoint. So it stands to reason that when a stock with a strong AD line is down in the morning, that can be a trading opportunity as it recovers later in the day. Check out one such stock - McKesson Corp (MCK):
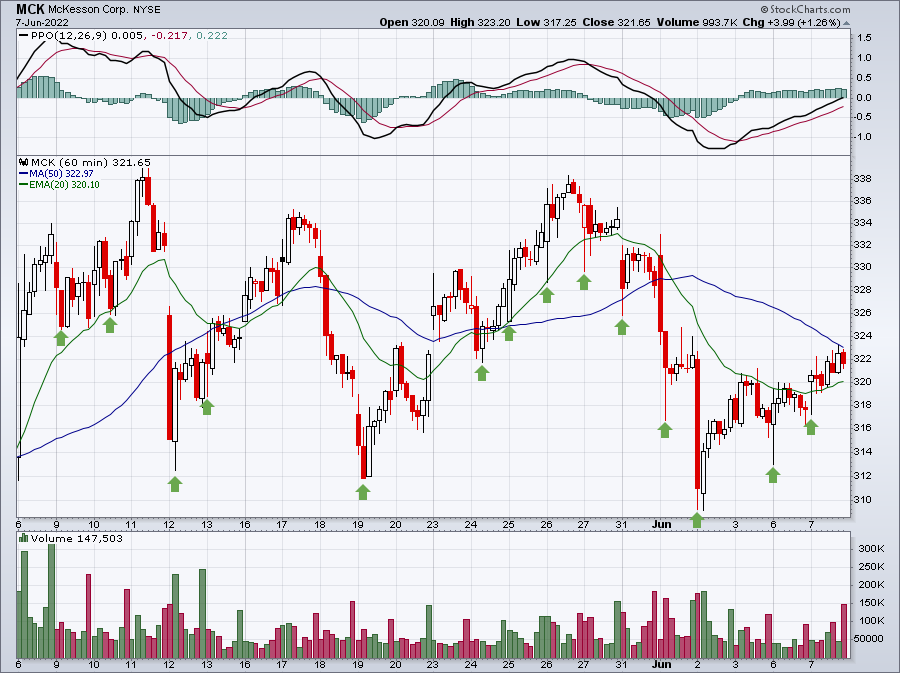
The above is a 1-month hourly chart and the green arrows highlight early morning weakness where MCK recovers 1% or more during the balance of the day. In several cases, the recovery is 2-3% or more. Currently, there are 348 companies included in our Strong AD ChartList, providing a slew of trading opportunities each and every trading day. One great way to look for trades is to pull up the ChartList in "Summary" view between 10-11am and scroll down to the worst intraday performers. Look back at their recent history to get a sense of how often they rally off of early morning lows. It's just one more way that EarningsBeats.com tries to live up to its tag line, "Better Timing, Better Trades."
 |
Happy Trading!Tom BowleyChief Market StrategistEarningsBeats.comBetter Timing. Better Trades. |