
Exelon Corp (EXC) received bad news this week when Illinois regulators rejected EXC's updated grid plan and rate hike.
While the news was bad, the action on the chart was worse. Volume exploded higher, but unfortunately it accompanied a price support breakdown, opening the door to deeper losses ahead. Below is a 10-year weekly chart for EXC and you can see first that the weekly PPO has taking a big hit and shows accelerating downside momentum:
Enter Exelon Corp. (EXC):
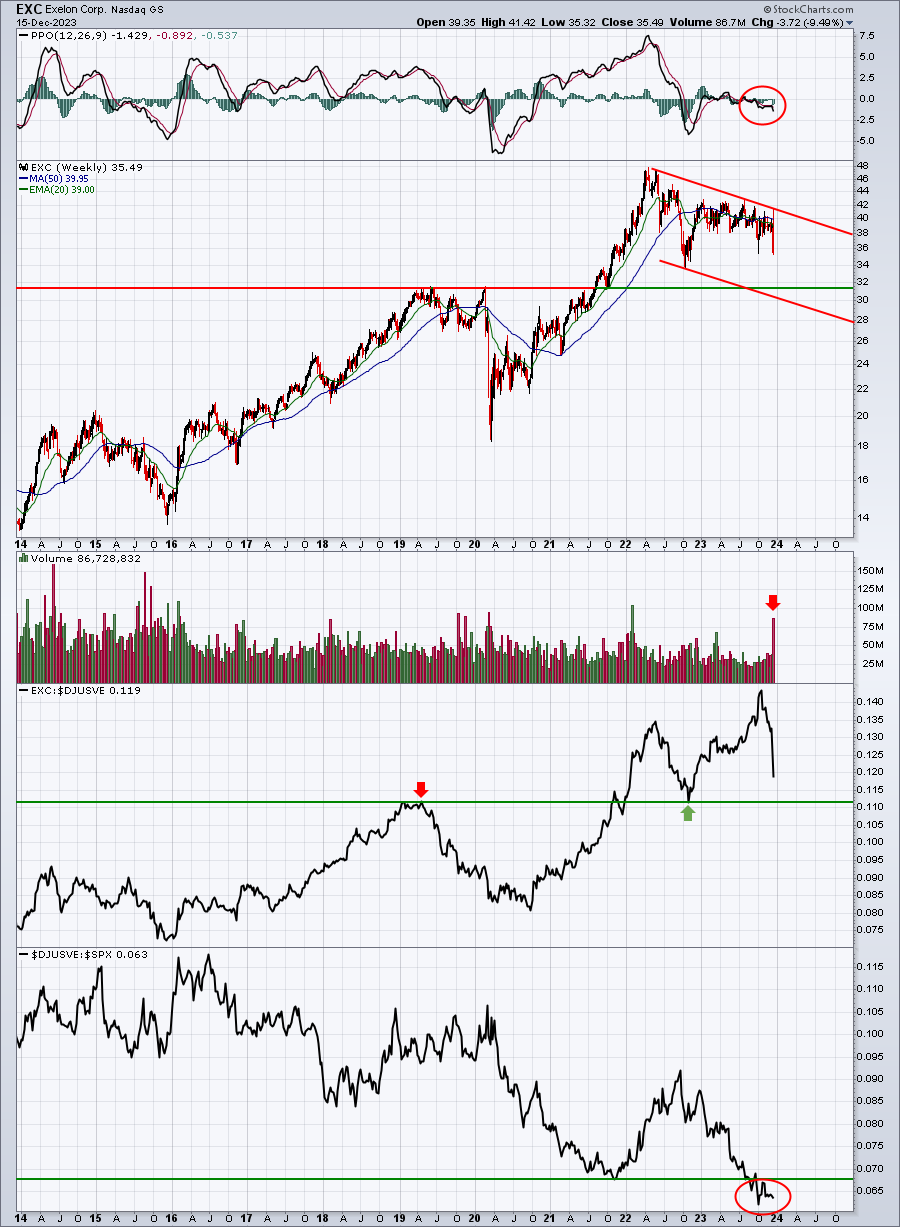
If you draw a line connecting the highs over the past 1 1/2 years, you'll see that last week's top failed squarely on this downtrend line. But the explosive move to the downside saw 87 million shares, the largest weekly volume in nearly two years. It doesn't help that EXC's peer group - conventional electricity ($DJUSVE) - continues to tumble relative to the benchmark S&P 500. I believe the next key on the EXC chart will be whether it can hold relative support vs. its peers. EXC showed excellent relative strength in that regard until Q4 2023 began. It's not been pretty since. I see initial price support on EXC coming in just below 34, then a major test of support near 31.50.
 |
Happy Trading!Tom BowleyChief Market StrategistEarningsBeats.comBetter Timing. Better Trades. |