
Technical analysis never provides us a guarantee.
Every single signal fails from time to time. That's why I believe it's important to line up as many bullish signals as possible before taking a position. The more bullish characteristics I see on a chart, the more confident I'll feel about the trade. With this in mind, let's consider the case for Celsius Holdings, Inc. (CELH):
Enter Celsius Holdings, Inc. (CELH):
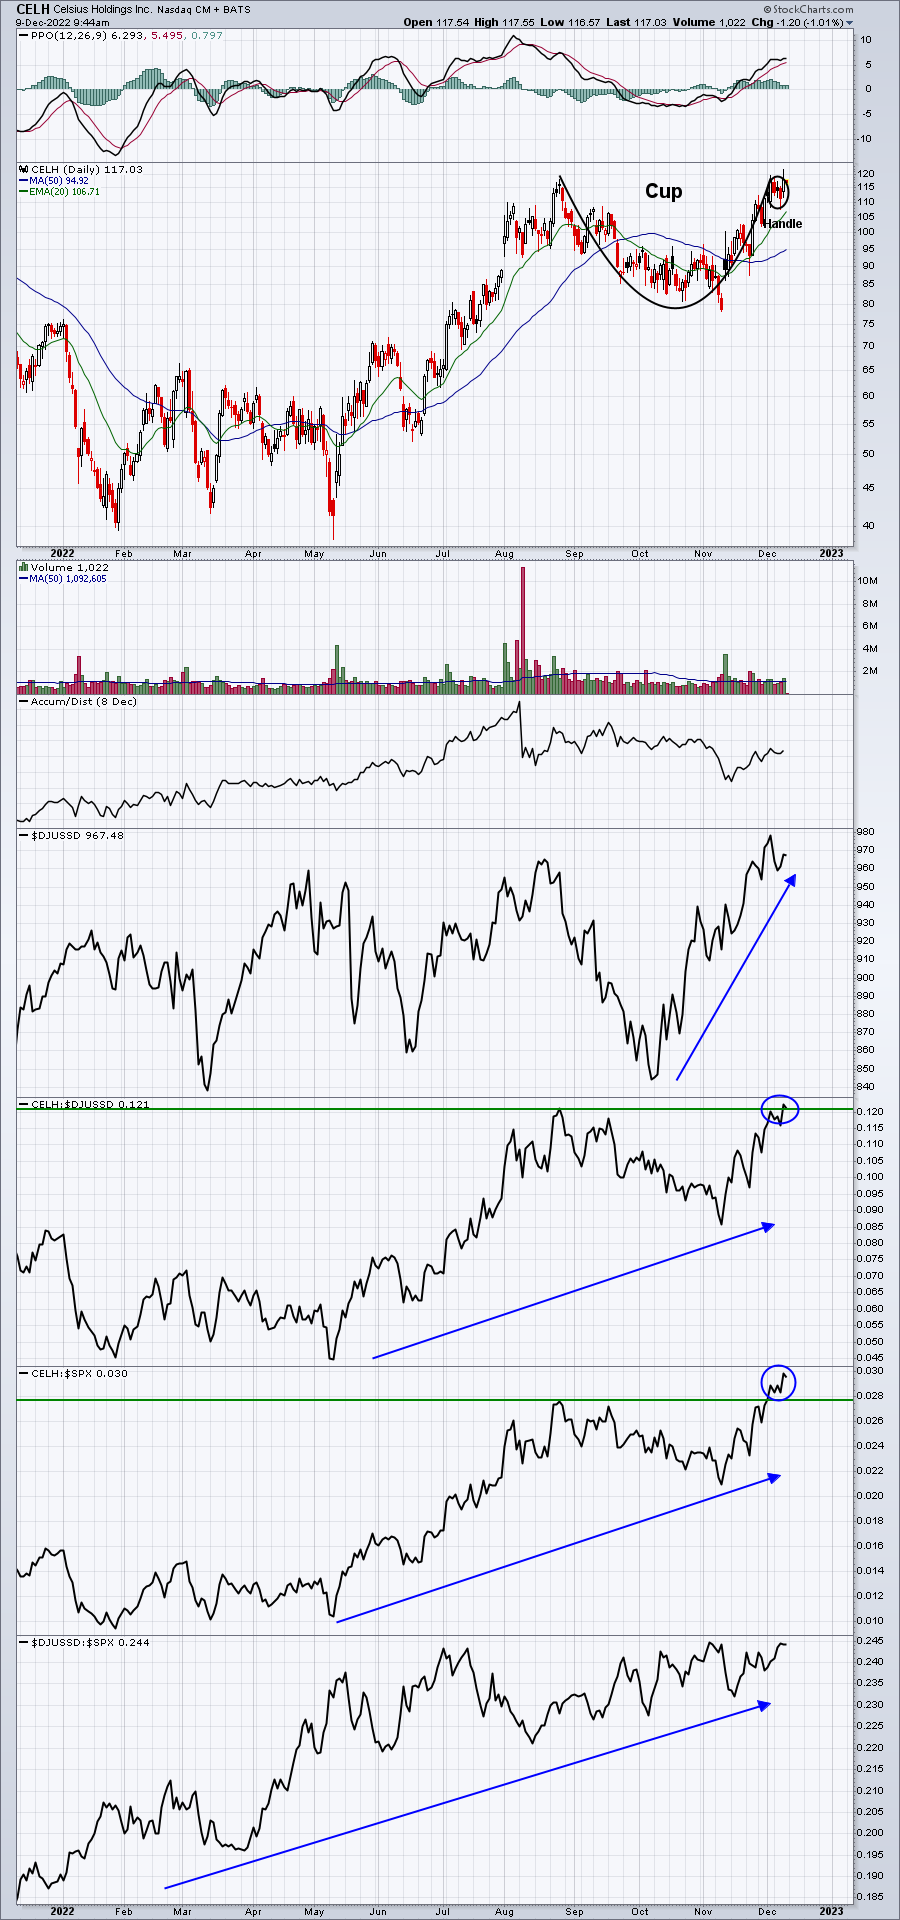
If you study technical patterns at all, it's fairly easy to spot the bullish cup that formed from the high in late August through the high earlier this month. That's a nicely rounded and fairly symmetrical cup that most traders can see and act upon. But if scroll down to the bottom panels on the chart above, you'll find a very strong soft drinks group ($DJUSSD) and superb relative strength of CELH as it breaks to a new relative high to both its peer group and the benchmark S&P 500. The DJUSSD has been strong on a relative basis throughout much of 2022. Patterns are nice, because we have measurements that we can use to calculate where a stock's target might be. In a cup with handle pattern, that measurement is from the top of the cup to the bottom, or in CELH's case, roughly 40 bucks. That suggests that, on a clear breakout, we should expect CELH to rise another 40 bucks to approximately 160.
 |
Happy Trading!Tom BowleyChief Market StrategistEarningsBeats.comBetter Timing. Better Trades. |