

When Sentiment Flashes A Warning Sign
Let me first begin this discussion by saying that sentiment does a MUCH BETTER job at marking market bottoms than it does market tops.
And remember, sentiment is just one piece of the market puzzle and we need to look beyond sentiment to other corroborating factors before growing more optimistic (market bottom) or pessimistic (market top).
One of my favorite topping/bottoming indicators is the 5-day moving average of the equity-only put-call ratio ($CPCE). Is it perfect? Of course not, nothing is. But it does provide us a warning when things get too bullish or too bearish. This moving average is like a rubber band. It often times gets stretched in one direction or the other, but it normally will snap back with a vengeance.
Sentiment indicators are contrarian indicators. In other words, when the market gets too bullish, look for a top. When the market gets too bearish, look for a bottom. High readings on the put call ratio are bullish for the market as more and more retail traders are buying PUTS as opposed to CALLS. Low readings are bearish for the market as more traders are moving to PUTS as prices decline. I begin to look for market reversals, generally short-term in nature, when I see extremely bearish 5-day readings (pc ratio greater than .80) or extremely bullish readings (pc ratio less than .50). Here's the visual:
Enter Equity Put/Call Ratio ($CPCE):
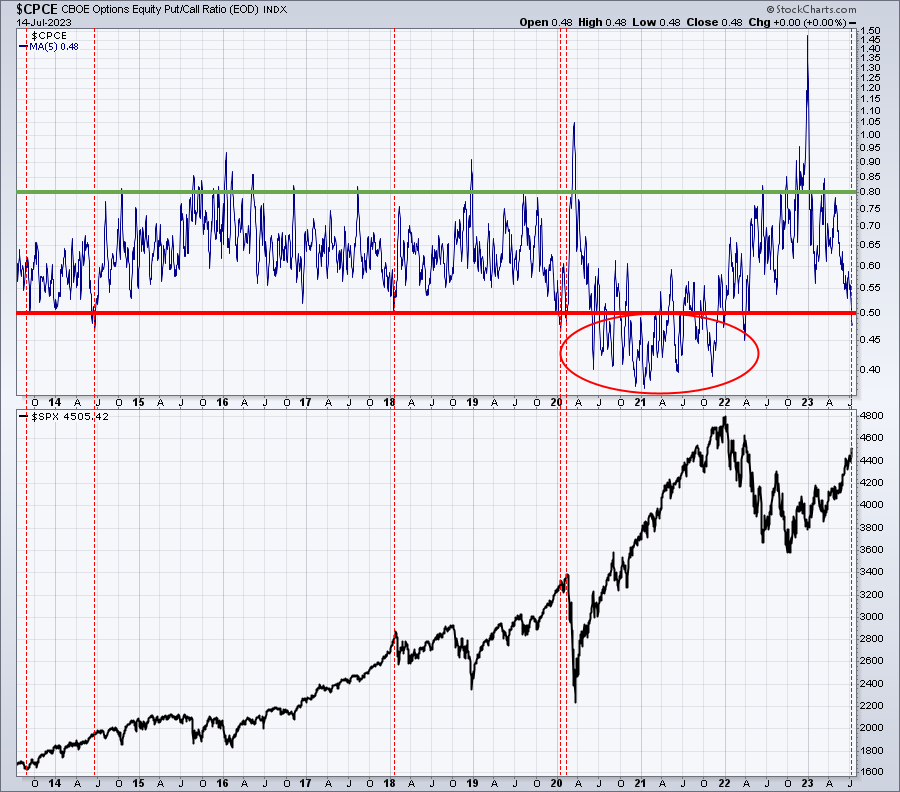
Our current reading has dropped to .48. Outside of the crazy bullish period in 2020/2021 (red circle), we've only seen a few 5-day put call readings below .50. Now is one of them. You can see that previous readings below .50 didn't always result in major selloffs, but they did a couple times. My point in showing this chart today is simply to alert everyone that more and more and more folks are hopping on the BULL train. When this has occurred in the past, there's certainly been an increased risk of subsequent selling. I believe that's where we are now - seeing an increased risk of a significant short-term top. Knowing this is options-expiration week and our major indices show negative divergences on their daily charts only adds to the possibility of a top near-term.
 |
Happy Trading!Tom BowleyChief Market StrategistEarningsBeats.comBetter Timing. Better Trades. |