

EB Daily Market Report - Thursday, May 5, 2022
Executive Market Summary
- Futures were lower overnight after a big post-Fed afternoon rally on Wednesday
- The Fed hiked the fed funds rate by 50 basis points, as expected, after its latest 2-day deliberation
- The big afternoon surge came after Fed Chair Jay Powell said the Fed would not get "more aggressive" in hiking rates (as if 50 basis points were not aggressive enough)
- Earnings disappointments continue to play a big role in downtrending U.S. equities
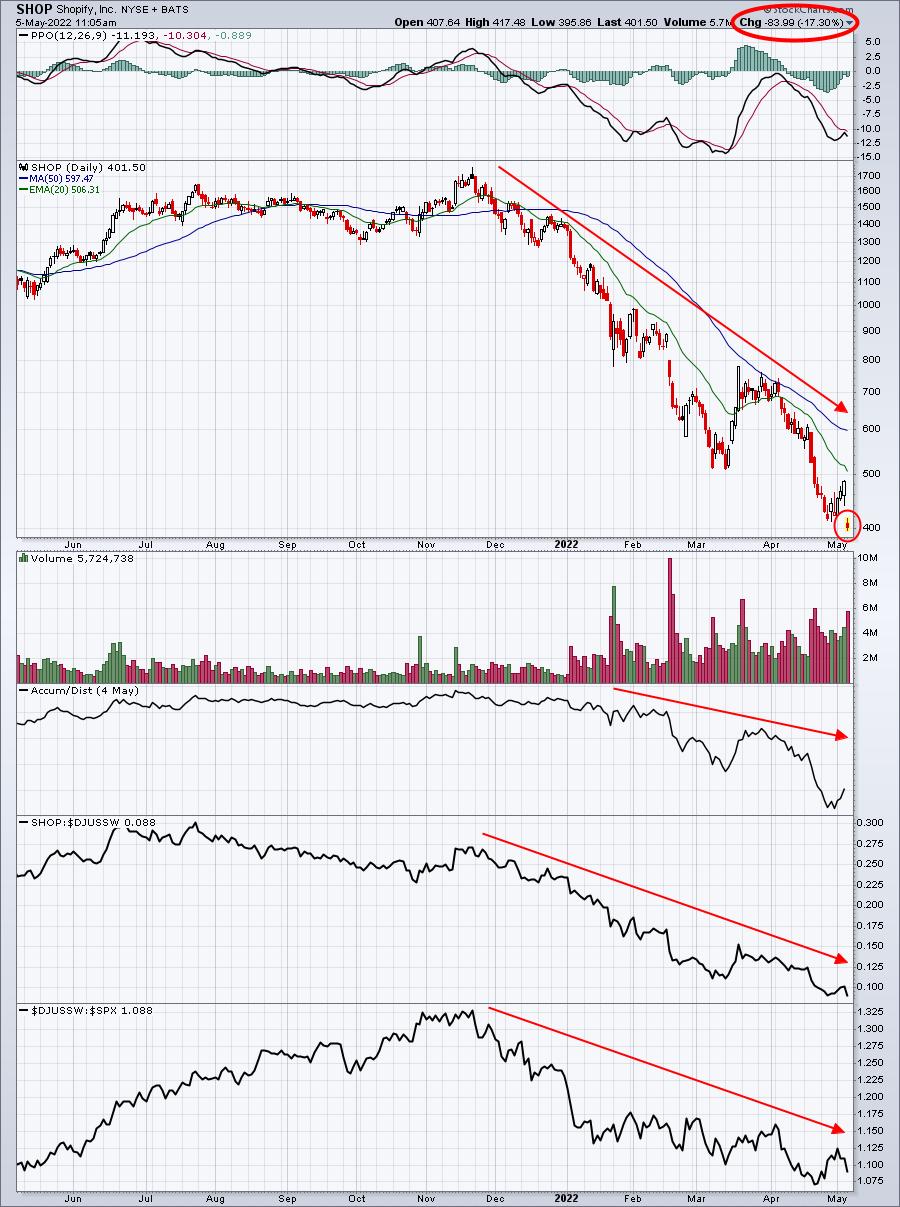
- Shopify (SHOP, -16.92%) missed both revenue and EPS estimates, highlighting the troubles in the software group ($DJUSSW, -4.89%) right now
- All 11 sectors are lower, with consumer discretionary (XLY, -4.93%), technology (XLK, -4.00%), and communication services (XLC, -3.48%) scraping the bottom of the barrel
- Gold ($GOLD, +0.56%) and silver ($SILVER, -0.55%) are slightly higher, leading commodities that are primarily flat
- The 10-year treasury yield ($TNX) is soaring 17 basis points to 3.09%, likely a primary culprit in today's U.S. equity weakness
- At last check, the NASDAQ is leading to the downside, down nearly 600 points, or 4.30%
- Again, let me restate that equities tend to be extremely volatile when we see Volatility Index ($VIX, +19.67%) readings in the 20s and especially the 30s
Market Outlook
The NASDAQ 100 ($NDX) roared ahead yesterday afternoon, but did you notice that it eclipsed key short-term price resistance intraday, but failed to do so at the close? Check this out:
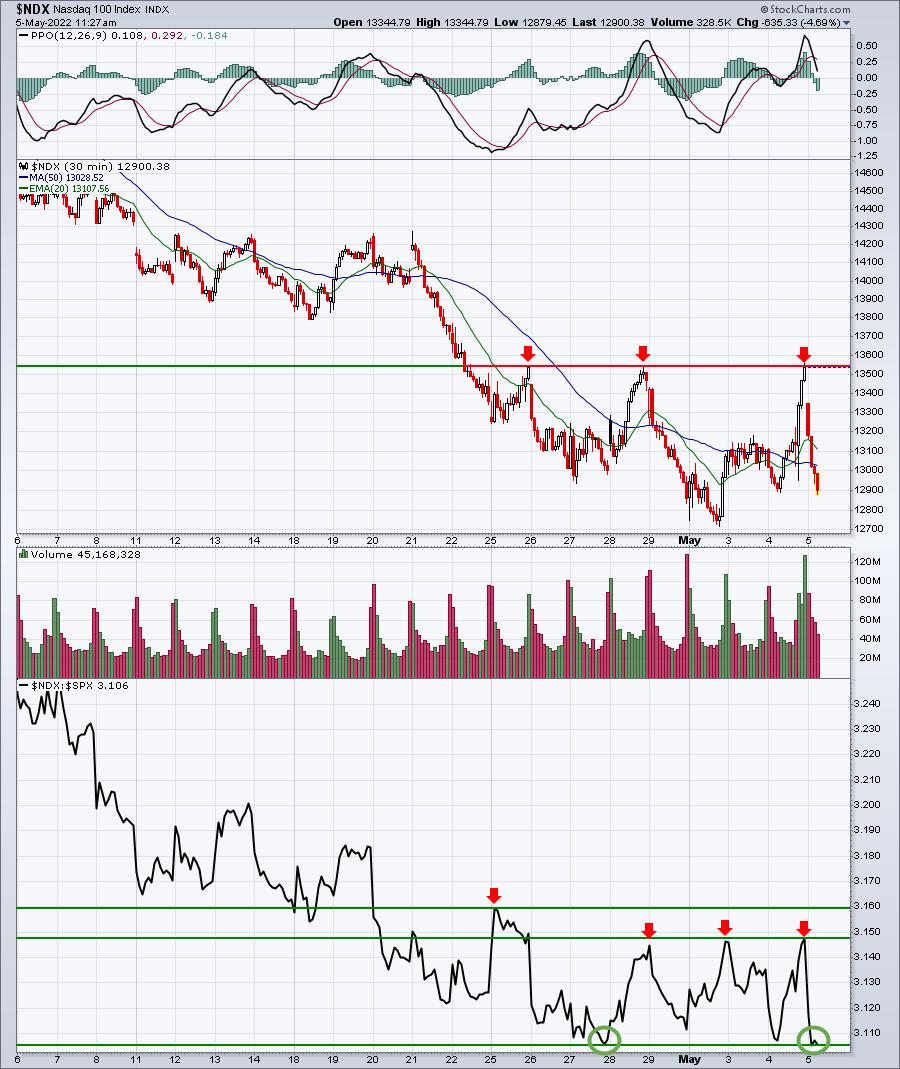
The failure at resistance is obviously one technical issue that's difficult to ignore, but the real problem in the intermediate-term is that the NDX:SPX ratio is right back at its low. There is NO rotation into the more aggressive NASDAQ that suggests a bottom is here or approaching. That's my big problem right now. I need signs of bullish rotation and I'm just not seeing it.
Sector/Industry Focus
In the final 60-90 minutes yesterday, we saw a BIG rally in the market after the Fed policy statement, but we cannot lose sight of the more intermediate-term technical and sentiment issues that we're facing. I am not at all surprised that we've given back yesterday's big afternoon gains. On the surface, it appears as though we went up and back down and nothing changed cumulatively. But I don't believe that's the correct way to view this. Changes occurred "under the surface" during that "nothing has changed" period. Below is a just a quick glance at the S&P 500, NASDAQ, one key relative ratio (XLY:XLP), and several key sectors so that you can see the rest of the story:
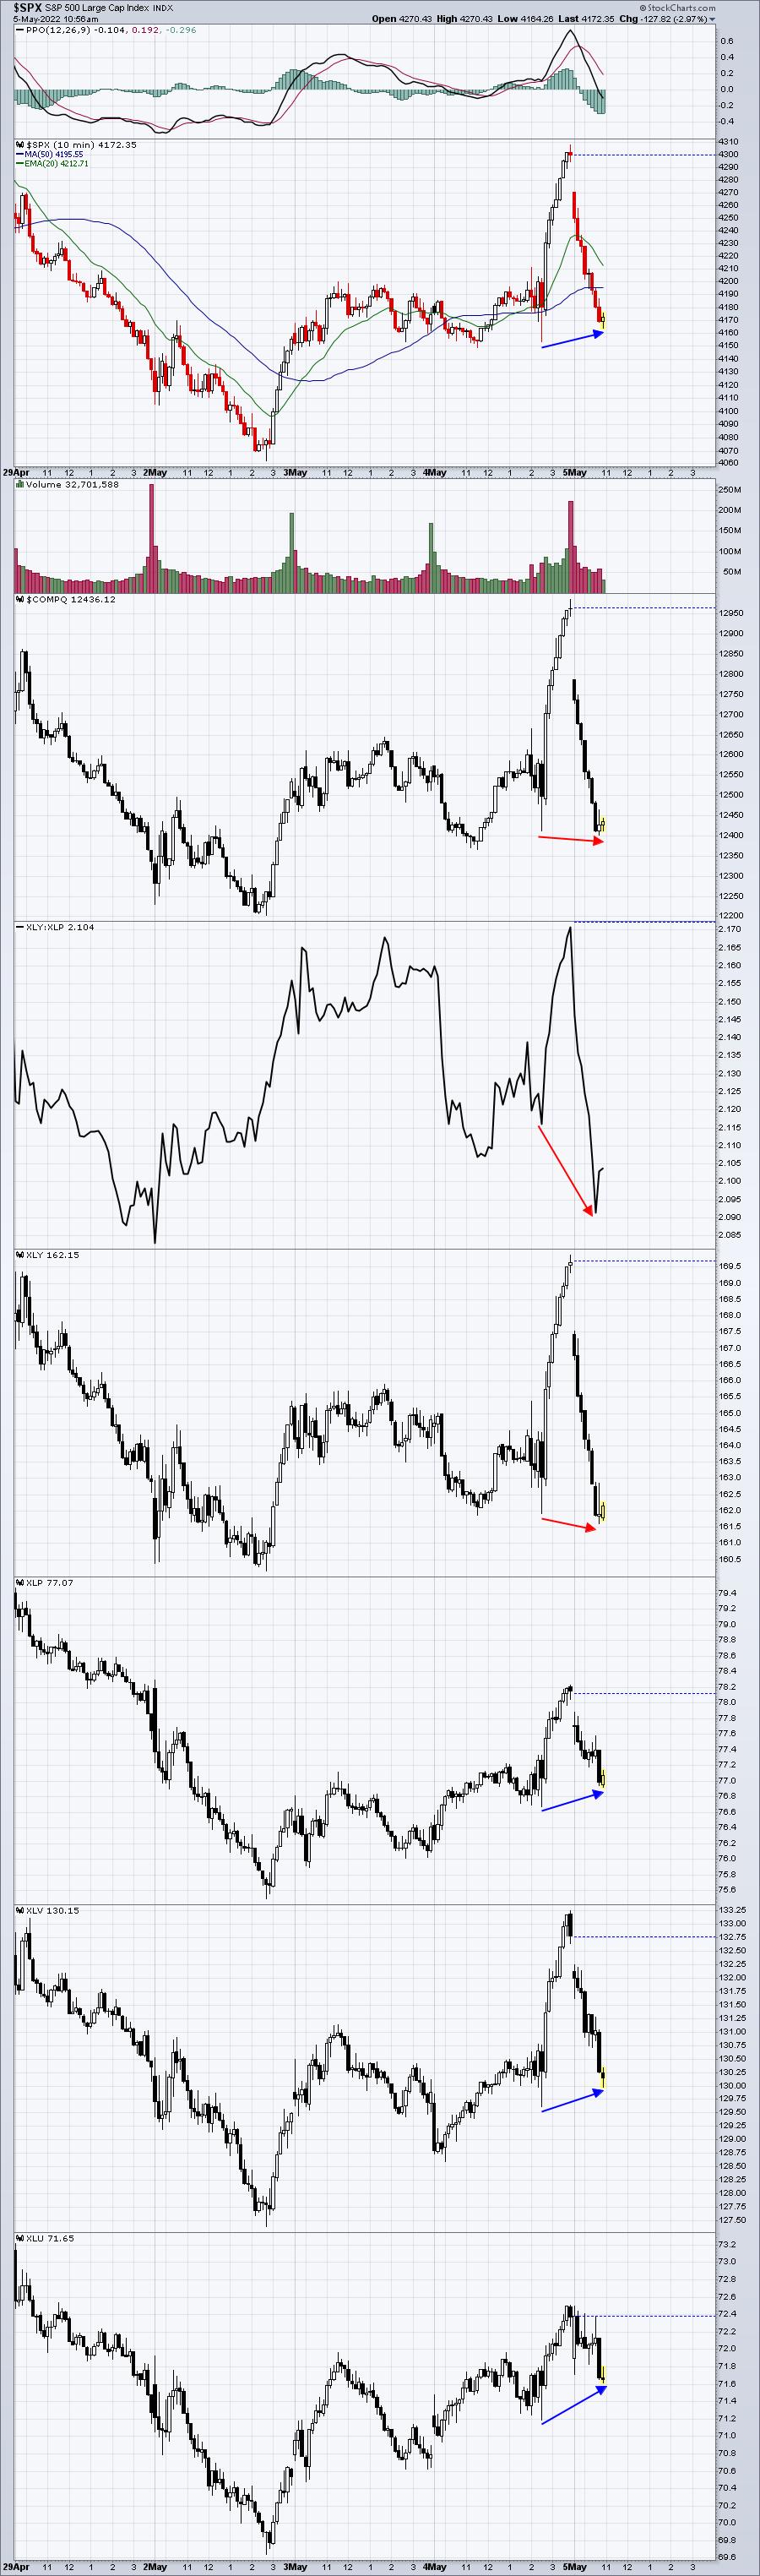
Notice what has outperformed over the last 20 hours and what has underperformed. It looks as if we've just gone up and down, which we have. However, there's been further rotation during this period from aggressive areas to defensive areas and we've seen extremely heavy volume. I can't provide any guarantees, but it sure does look to me like Wall Street sees further weakness ahead. How else can we explain this bearish rotation? In particular, check out that XLY:XLP relative chart. That speaks volumes to me.
ChartLists/Strategies
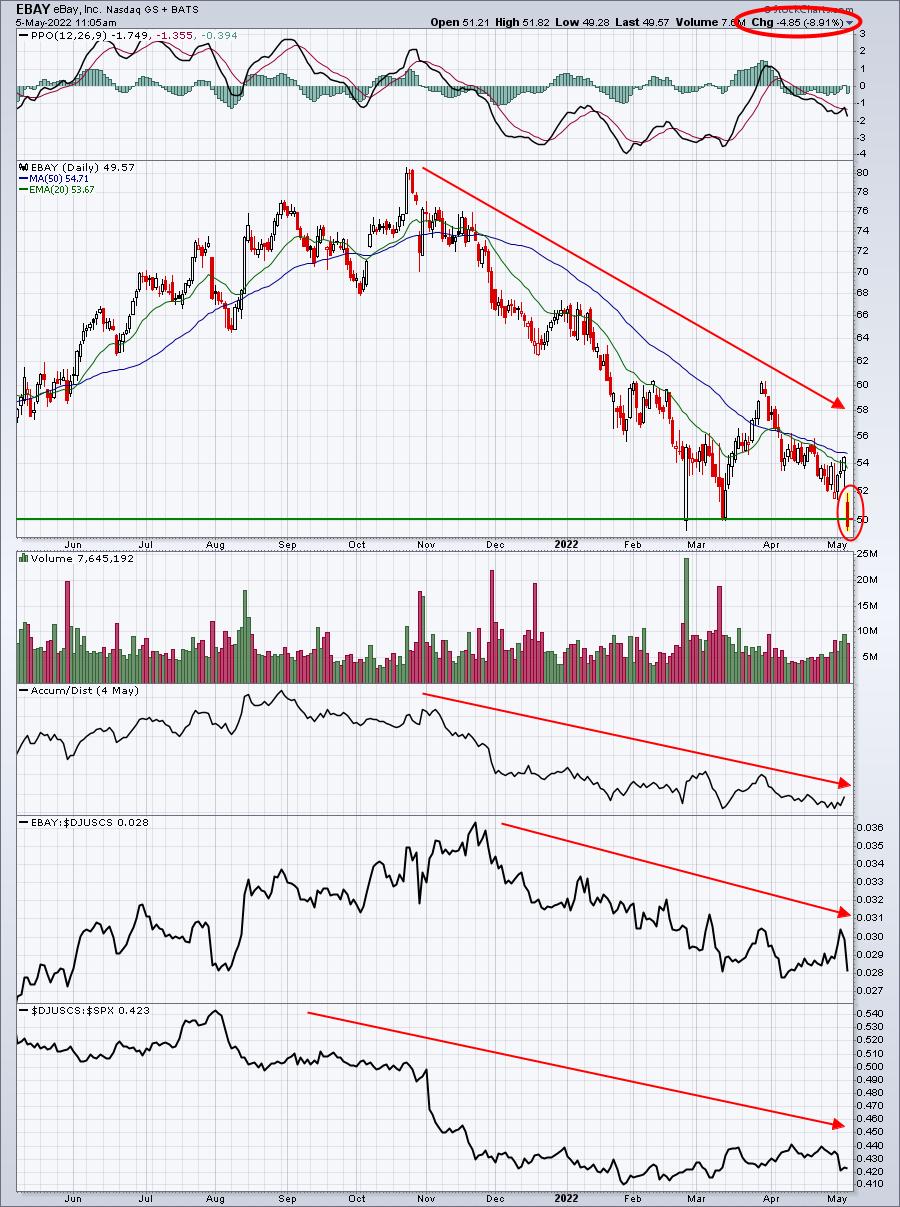
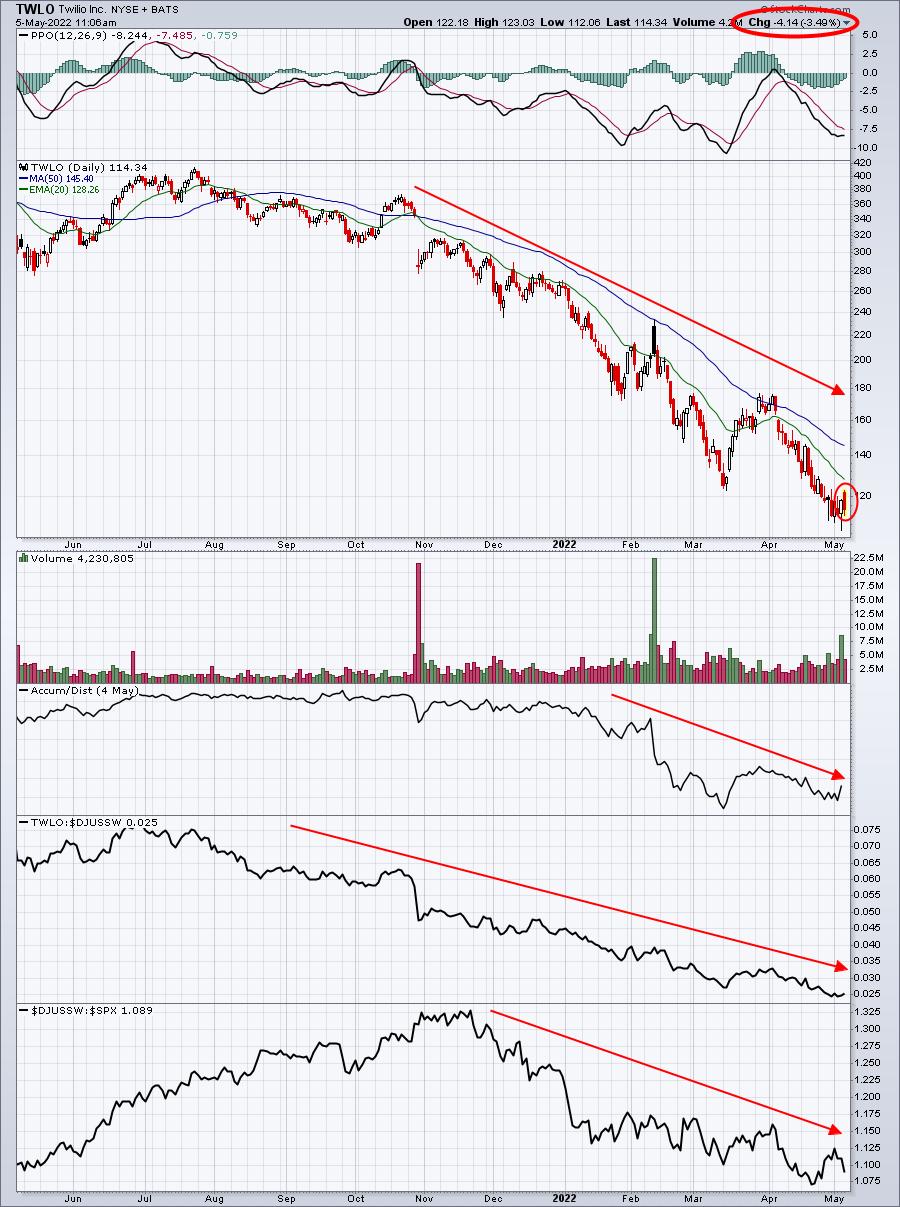
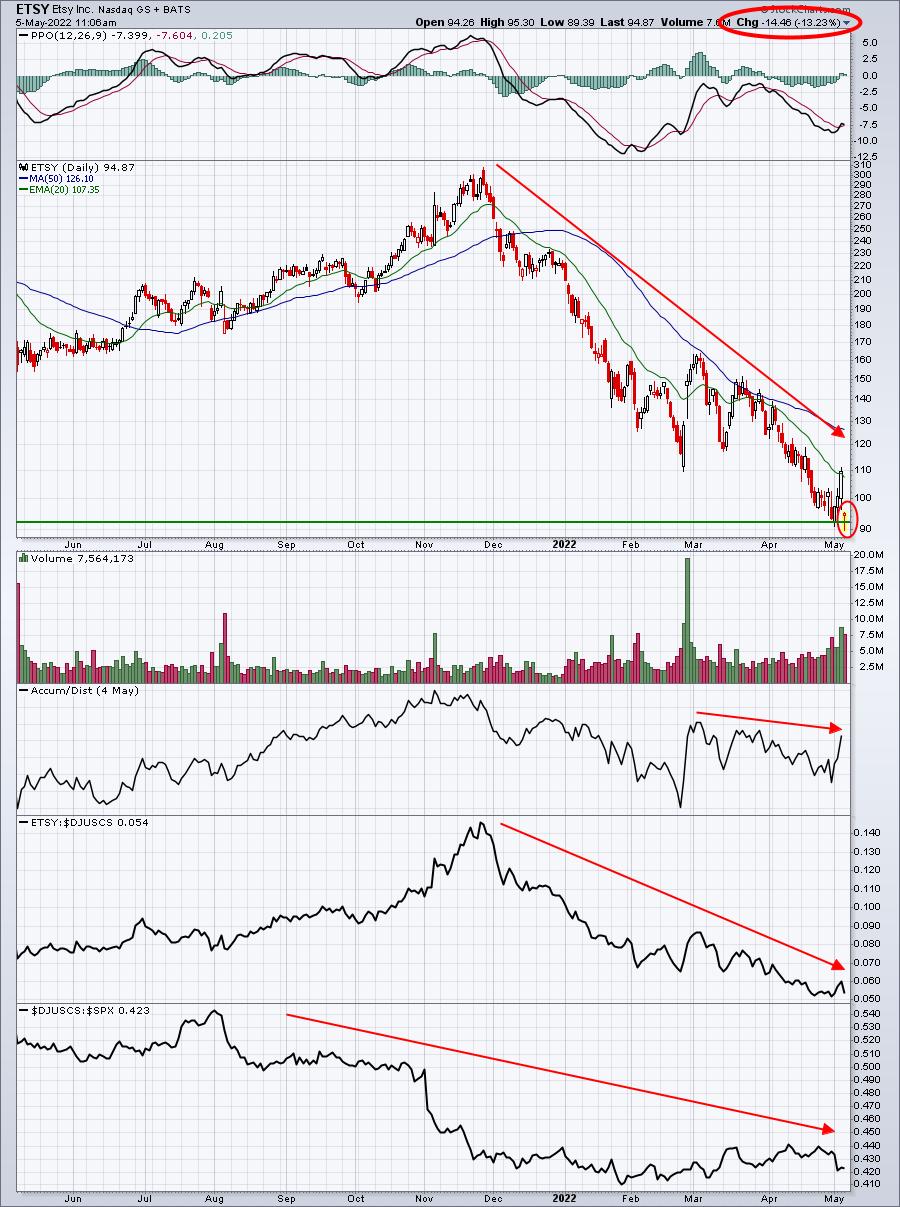
Of the 8 stocks I provided yesterday afternoon, a few reported either last night or this morning. Relative strength is weak across the board, but a few show at least hints of accumulation, while others not so much. Check out the major hits to SHOP, EBAY, TWLO, and ETSY, all of which showed weak AD lines:
SHOP:
EBAY:
TWLO:
ETSY:
Of these 4, SHOP looks the worst to me. Its AD line is horrific, as I pointed out yesterday. It missed both its revenue and EPS estimate, which is not totally surprising when you consider how poorly Wall Street has been treating the stock since November 2021. When stocks are at lofty expectations purely based on growth prospects and inflation, higher interest rates, and a weakening economy all come along simultaneously, valuations collapse. It doesn't mean SHOP is a bad company. It's a combination of missing expectations and a very poor environment for growth stocks. Still, I'm a momentum investor, so I have no interest in a stock like SHOP until it shows improving relative strength and momentum. Its gap beneath prior support has a bad technical look as well.
EBAY's AD line looks equally bad to me, but it does have price support that it's attempting to cling to. Still, show me relative strength or show me the exit.
TWLO gapped higher after better-than-expected EPS, but its AD line is very weak and its relative strength vs. the software industry ($DJUSSW) is really awful. No thank you.
The one that I give a bit more hope to is ETSY. With a decent finish today, we could see its AD line break to a multi-month high and perhaps even challenge its one-year high. Despite its big gap lower, it opened above key price support. After trading briefly in break down territory, it's recovered. Many times, I've seen bottoms form just like this. Still, ETSY's relative strength has been horrid, so pulling the trigger here is not a slam dunk. But I could see a rally back to the 20-day EMA. Just be sure to keep a closing stop beneath 92.
Earnings Reports
Here are the key earnings reports for the next two days, featuring stocks with market caps of more than $10 billion. I also include several companies with market caps below $10 billion. Finally, any portfolio stocks that will be reporting results are highlighted in BOLD. If you decide to hold a stock into earnings, please understand the significant short-term risk that you are taking. Please be sure to check for earnings dates for any companies you own or are considering owning.
Thursday, May 5:
COP, BUD, ZTS, BDX, EOG, VRTX, D, ICE, SQ, SHOP, APD, MELI, SRE, BCE, ILMN, MCK, MNST, RSG, DDOG, PH, ED, LCID, APO, APTV, MTD, NET, DASH, CBRE, MT, BLL, RPRX, LYV, AEE, K, VTR, PBA, PPL, RCL, WPM, FLT, HUBS, BILL, OWL, PODD, TRGP, TRMB, PWR, EPAM, CAH, ARGX, EVRG, NLOK, AMH, WRK, NWSA, CGNX, LAMR, PCTY, MMP, DVA, CCJ, ZG, W, FND, HII, CFLT, DBX, OGN, DLB, BERY, RGA, AVLR, MP, GH, OLED, PENN, UNM, WCC, ADT, SYNA, BLD, SAIL, TXRH, INGR, MTZ, PRI, SEAS, HBI, OPEN, AL, FOUR, WWE, CROX, BECN, TDC, NTLA, IRTC, APPN, NTRA, PGNY, BE, PZZA, ALRM, HAIN, BCC, NKLA, SPWR, VIR, PBH, AXNX, INSM, FTDR, SHAK, IHRT, YELP, ATSG, MDRX, NTCT, KTB, TDS, GOGO, VSTO, SPCE, SWI, AAWW, KTOS, NOG, SBH, HCC, CDNA, MYGN, TGH, SKT, TVTY, TWST, PLYA, GDOT, CRSR, AMCX, GPRO, CNXN, RDFN, AOSL, DVAX, BKD, TREE
Friday, May 6:
ENB, CI, TU, IEP, DISH, AES, DKNG, VST, NRG, ESNT, GT, SR, FLR, SPB, BLDP, GTN, SSP, PRLB, IMGN, RUTH
Economic Reports
Initial jobless claims: 200,000 (actual) vs. 178,000 (estimate)
Q1 productivity: -7.5% (actual) vs. -2.5% (estimate)
Happy trading!
Tom