


EB Daily Market Report - Wednesday, October 2, 2019
Executive Market Summary
- September ADP employment report showed 135,000 jobs added, below the expected 152,000 level
- Money is rotating into safety as treasuries perform well (with TNX falling 5 basis points to 1.59%)
- All 11 sectors down today with major indices shedding 1-2%; Dow Jones down 500 points just before noon
- Airlines ($DJUSAR, -4.78%) hit hard despite falling crude oil prices ($WTIC, -2.35%)
- ROKU, our sole alert, trades higher to 104
Market Outlook
On days like yesterday and today, I have to remind myself to look at the big picture and try to avoid the short-term "noise". On Trading Places LIVE this morning, a webinar hosted here at EarningsBeats.com on Monday and Wednesday mornings from 9:00-9:30am EST, I focused on the truly BIG PICTURE, a 100 year monthly chart of the S&P 500 and I laid out my arguments for a secular bull market, one that might continue for the next decade. You will still see plenty of periods of weakness, but the overall trend will be higher. Here's the chart I reviewed with everyone:
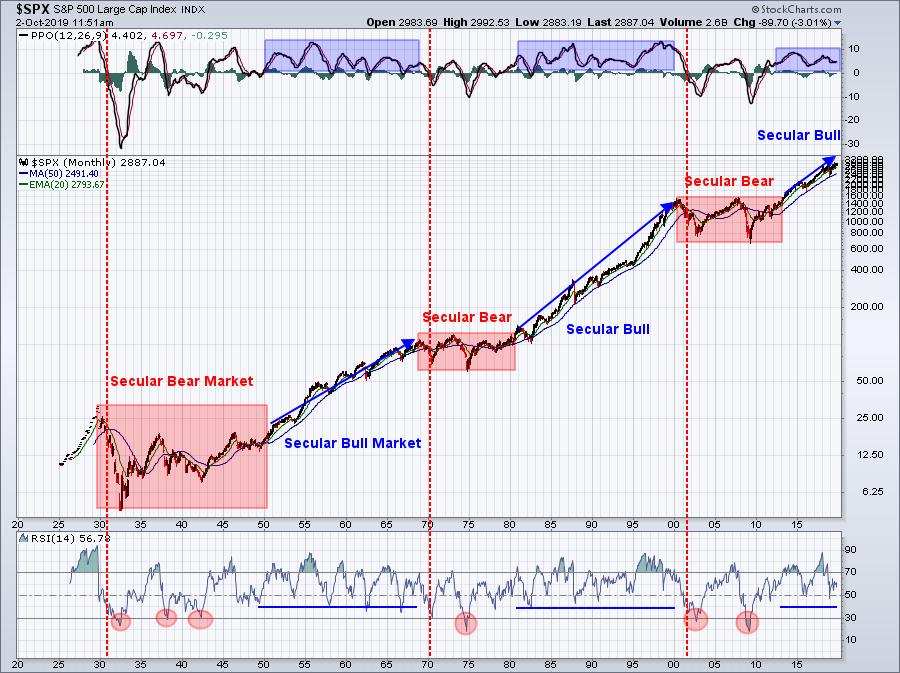
Our stock market overshoots in both directions. We get too euphoric, which leads to secular bear markets. Then we get too pessimistic, which leads to secular bull markets. I believe the S&P 500 has a lot further to climb, but we'll absolutely have to weather short-term corrections and even cyclical bear markets along the way. Just don't lose sight of this chart, especially when we break to new all-time highs.
Sector/Industry Focus
Industrials (XLI) took the brunt of yesterday's selling, although it was felt across all 11 sectors. Nonetheless, weakness in manufacturing would be expected to hit industrials hard. The good news is that the absolute and relative charts for the XLI remain bullish:
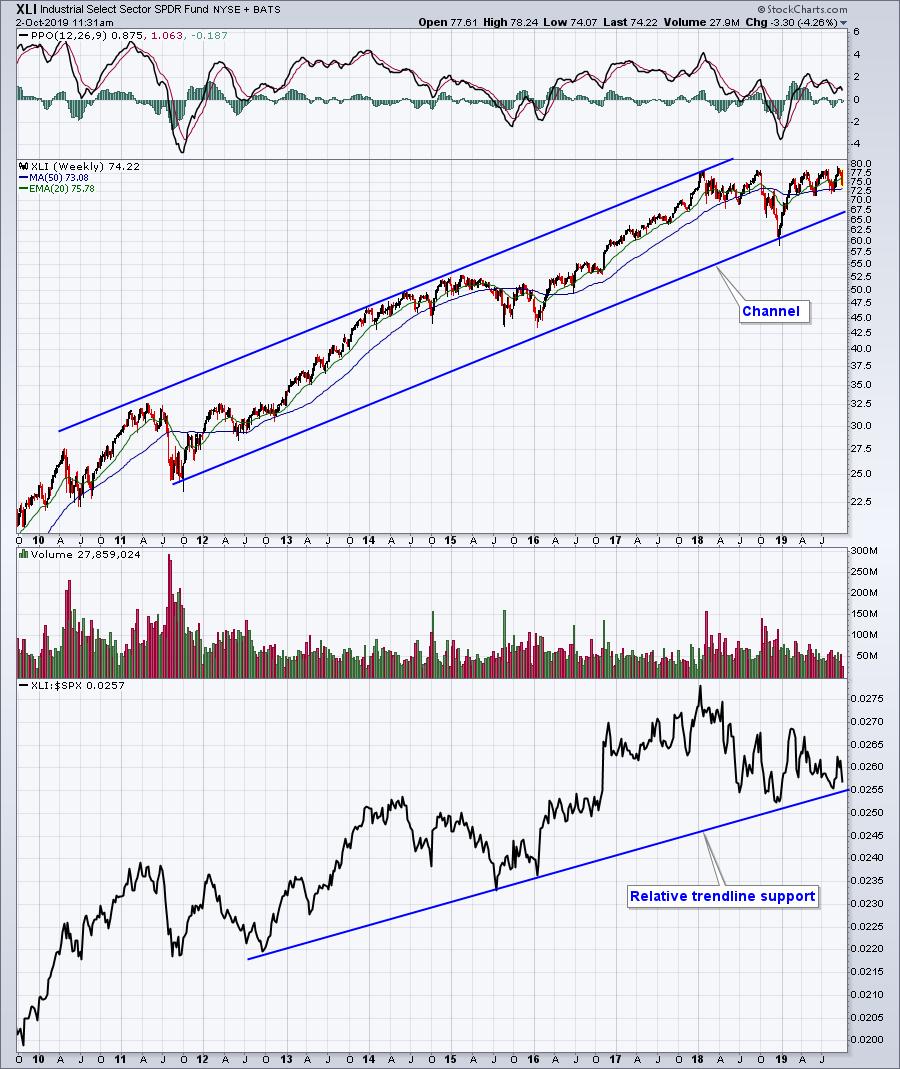
Yesterday, the manufacturing miss resulted in a ton of selling, right? But when we step back and look at the longer-term picture, what does it really mean? I don't think a whole lot, at least not now.
Strong Earnings ChartList (SECL)
There are four stocks on the SECL that have traded .75 of their average daily volume as of 11:20 EST today - ARCC, HXL, SVM, and TNDM. The latter is somewhat intriguing for a short-term trade given the heavy selling recently and the potential for a reversing candle at price support:
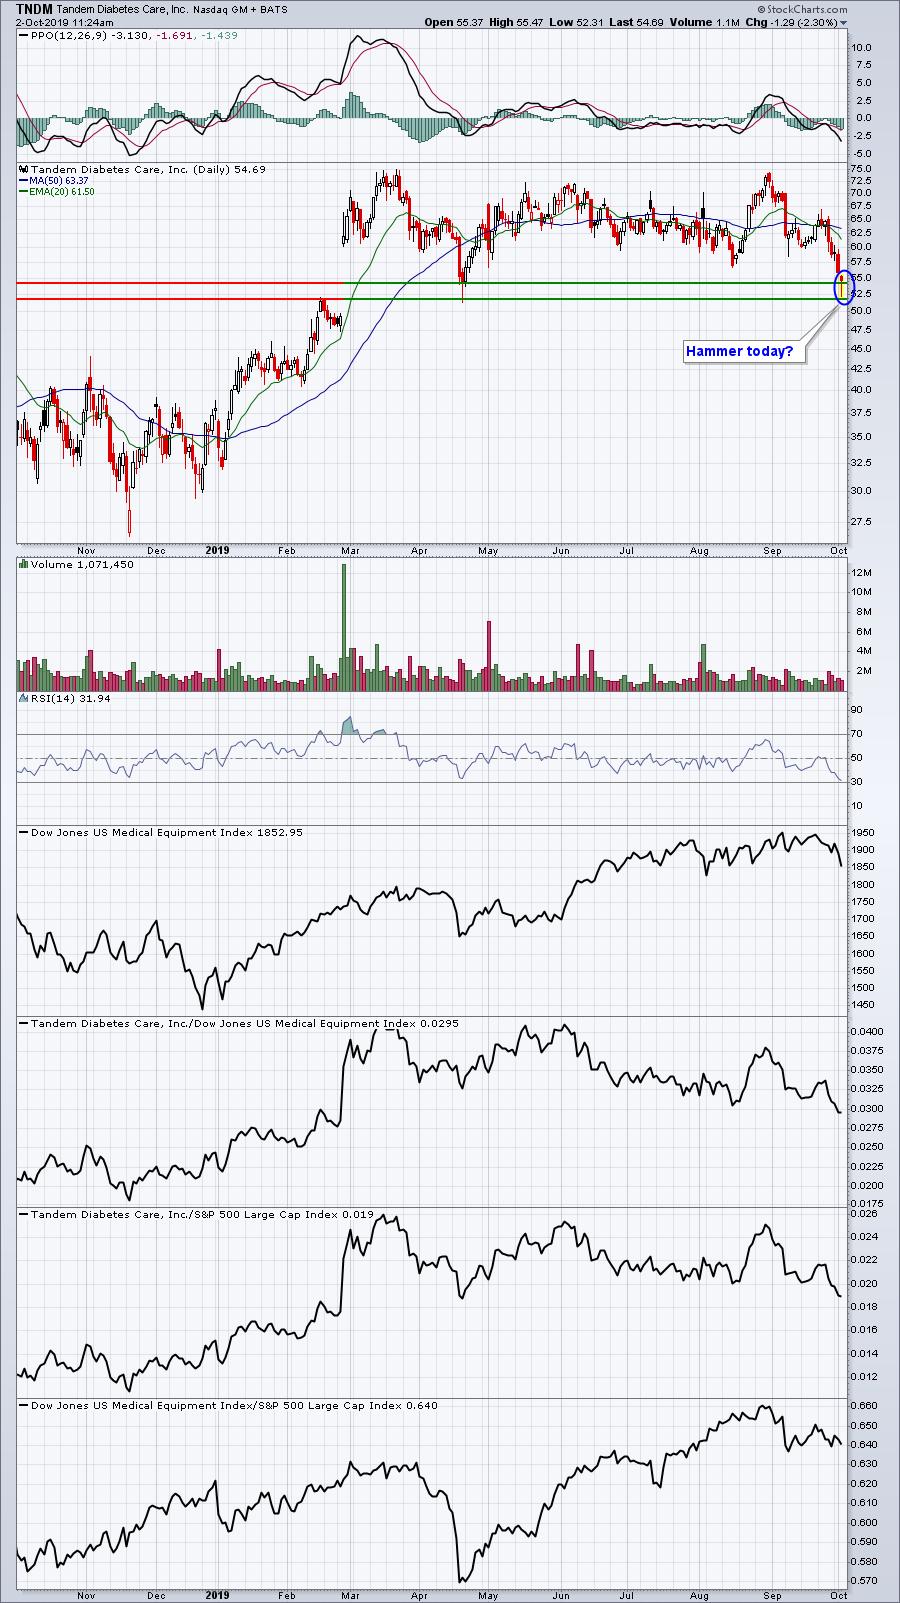
TNDM has been consolidating a huge upside move for the past several months. Buying it at or near key price and gap support makes sense for those willing to take higher risks. If this is a reversing candle today, the declining 20 day EMA - a potential target - is more than 10% away.
Current Alerts
We continue to ride with just one alert for now - Roku, Inc. (ROKU). The market is volatile, but a reversal today on the S&P 500 would likely trigger another alert or two. However, let's watch the market unfold first and go from there.
ROKU:
Here's a reprint of the hourly ROKU chart that I provided yesterday. The 97-100 area remains very important short-term support and thus far it's holding:
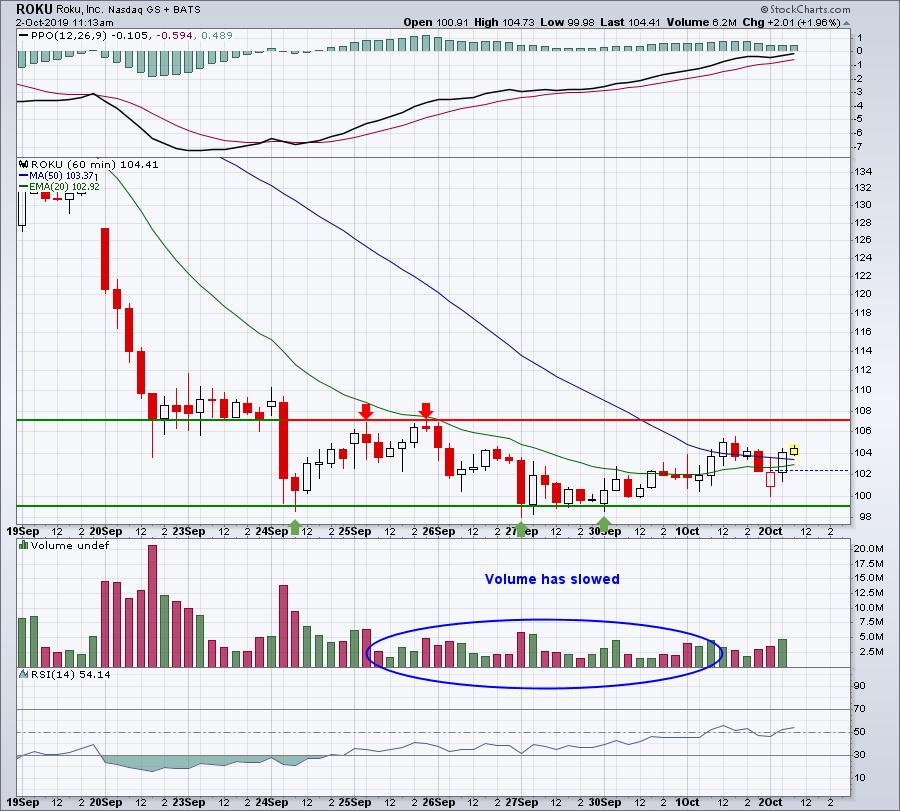
Owning a stock that's up 2% on a big down day in our major indices feels good, but I'm still watching this short-term trading range.
Today's Movers
A recent winner in terms of an excellent quarterly earnings report, Nike, Inc. (NKE) is falling like everyone else. NKE, however, is a relative leader in footwear ($DJUSFT) which has regained its relative "footing" vs. the benchmark S&P 500. The current selling could be providing a nice opportunity here:
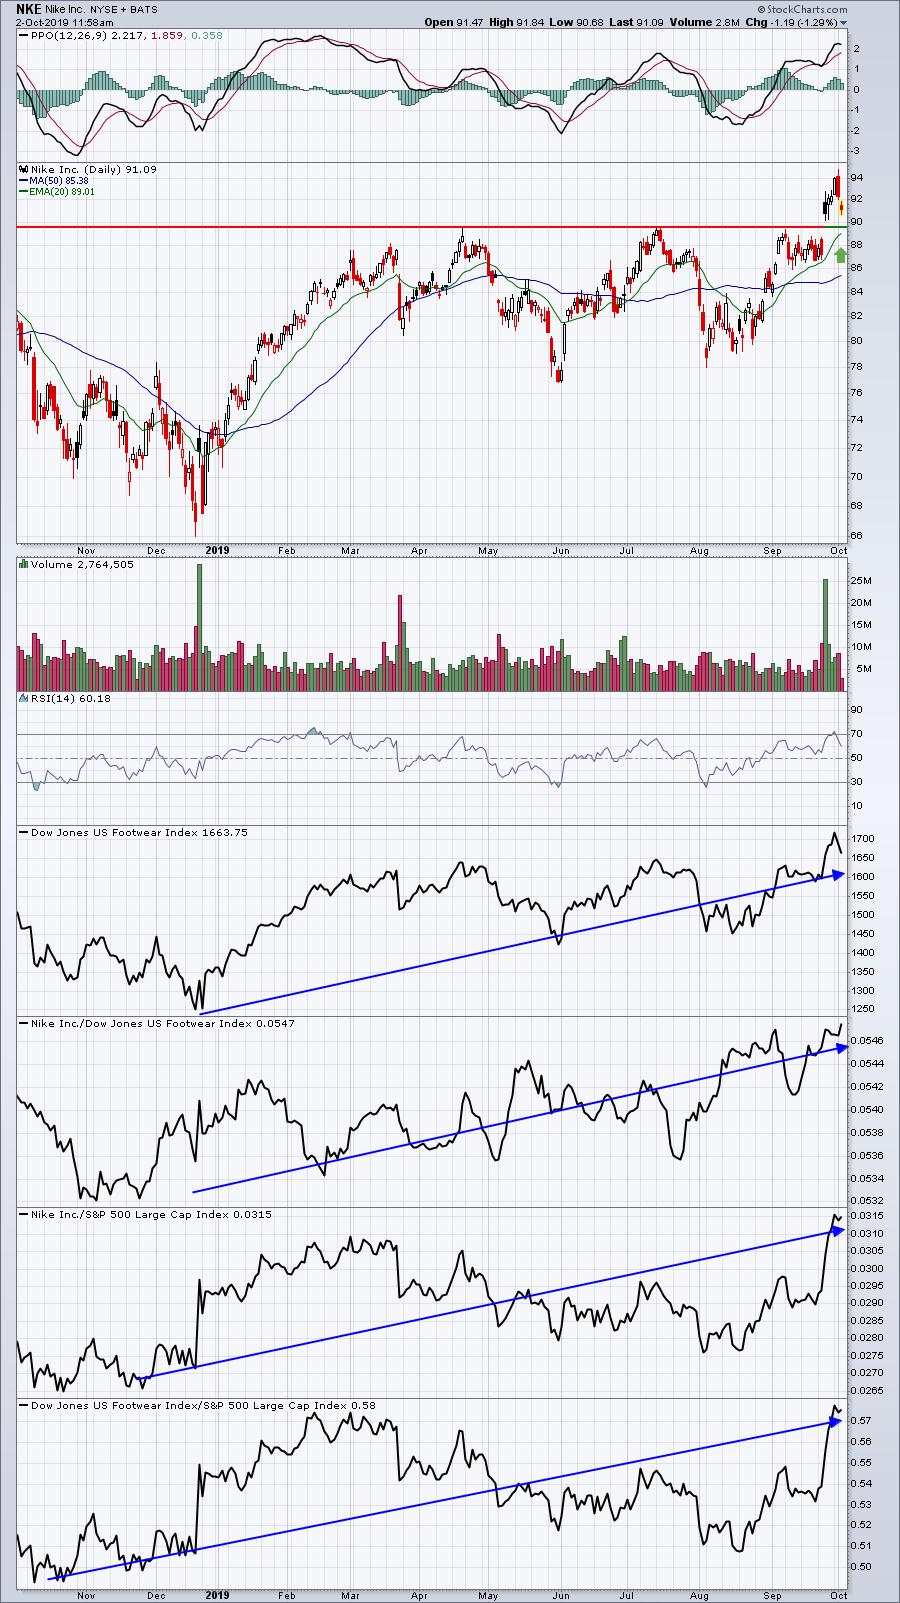
The closer it gets to 90, the better it looks from a reward to risk perspective. The rising 20 day EMA should hold, if the 89.50-90.00 price and gap support doesn't.
Earnings Reports
Here are key earnings reports for this week:
Wednesday, October 2:
PAYX, LEN, LW, RPM, AYI, BBBY
Thursday, October 3:
PEP, COST, STZ
Friday, October 4:
None
Economic Reports
September ADP employment report released at 8:15am EST: 135,000 (actual) vs. 152,000 (estimate)
Happy trading!
Tom