


← Back to 099 Daily Market Report Sample
EB Daily Market Report - Tuesday, October 1, 2019
Executive Market Summary
- September ISM manufacturing came in at 47.8, well below expectations
- Reignited fears of recession saw a major reversal in both bond and stock prices
- The 10 year treasury yield ($TNX) tested overhead yield resistance at 1.73%, up 6 basis points, before reversing lower 11 basis points to 1.62%
- Our major indices tumbled on the news as well, with the S&P 500 dropping 1% in the first 30 minutes after the report was released
- Industrials (XLI) are the weakest sector today, while technology (XLK) is the relative leader - an indication that this selling might not last
- Online brokers are tumbling after Charles Schwab (SCHW) announced it was eliminating trading commissions
- ROKU, our sole alert, is up nearly 2% and currently avoiding the market carnage.
Market Outlook
A very weak manufacturing report has spooked Wall Street as the selling kicked in immediately after the report hit the Street. The good news for the bulls is that the S&P 500 has simply fallen back into a key gap support zone, one that I've identified in prior DMRs:
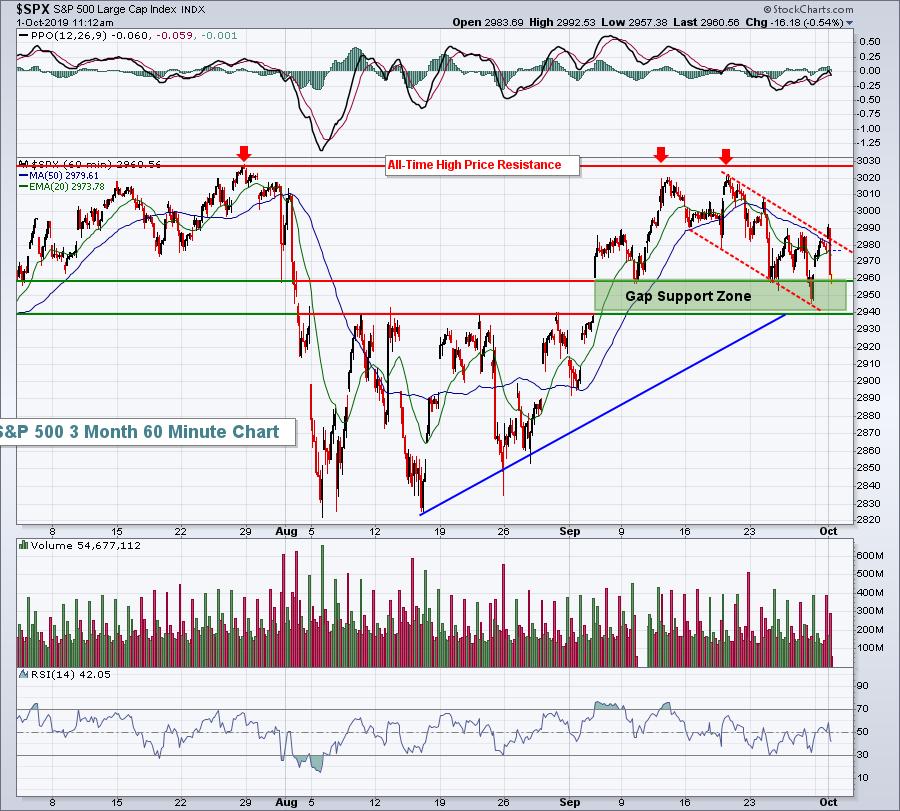
We certainly had a head fake this morning as the S&P 500 appears to be breaking out of its recent down channel. I'd like to see that break definitively before growing more aggressive in the near-term. I still believe a breakout is coming to all-time highs, but it looks like it'll be put on hold, at least temporarily.
Sector/Industry Focus
The strong U.S. Dollar Index ($USD) closed above 99 for the first time since May 2017 and that is beginning to take its toll on gold ($GOLD). The USD and GOLD have a long-term negative, or inverse, correlation and that steady rise in the greenback resulted in the printing of a head & shoulders topping formation. Yesterday, the neckline gave way and that, barring a quick reversal, points to lower GOLD prices:
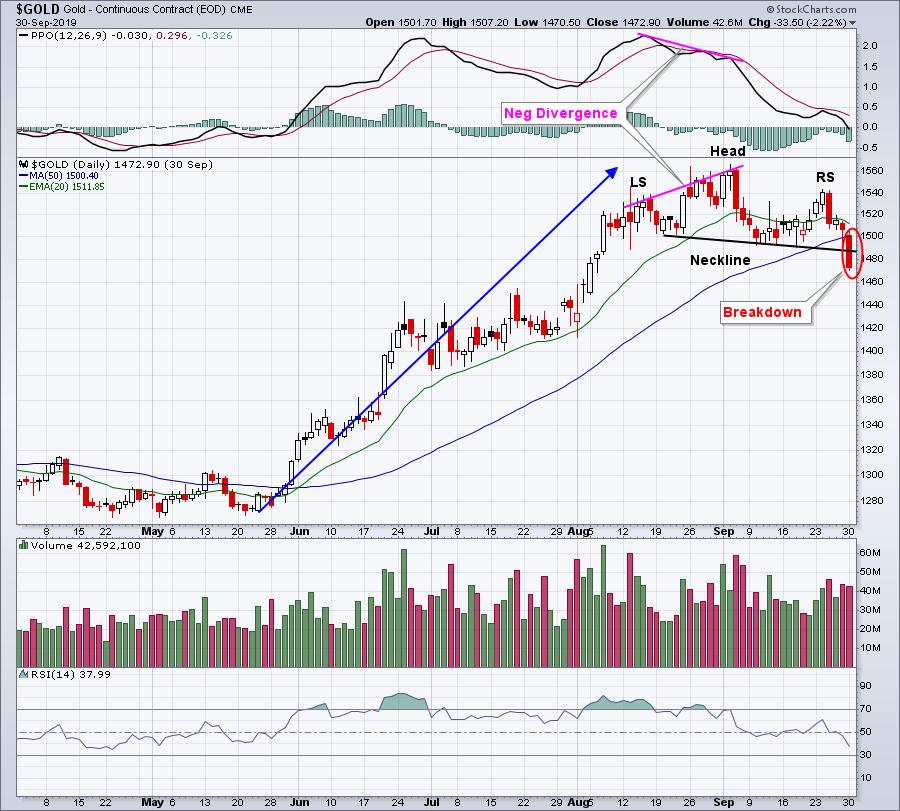
This is about as classic a head & shoulder pattern as you can have. It starts with an uptrend, because you can't have a topping pattern without an uptrend in place. The left shoulder and head highs form a negative divergence as the PPO begins to roll over. Then a downsloping neckline forms, which is more bearish as it shows prior price support giving way. The final advance - the right shoulder - falls short of the high achieved during the left shoulder so the entire pattern appears to be sloping downward and to the right. Then heavy volume accompanies the breakdown of neckline support. I would look for a measurement down to 1420-1425.
Strong Earnings ChartList (SECL)
I decided to do something different today. I ran a scan of the SECL to see which stocks were setting a new 52 week low today. Surprisingly, that scan had no results. So I ran a scan of the SECL to see which stocks had RSIs below 30. The following 10 stock symbols were returned:
CECO, CHGG, CSIQ, CTLT, EHTH, EXAS, RPD, TTD, VG, WIX
I didn't bother looking at the daily charts as I'm sure they're broken. Instead, I viewed a "big picture" weekly chart, looking to see if I could make a bullish case for any of the stocks on a longer-term time frame. Here they are:
CTLT:
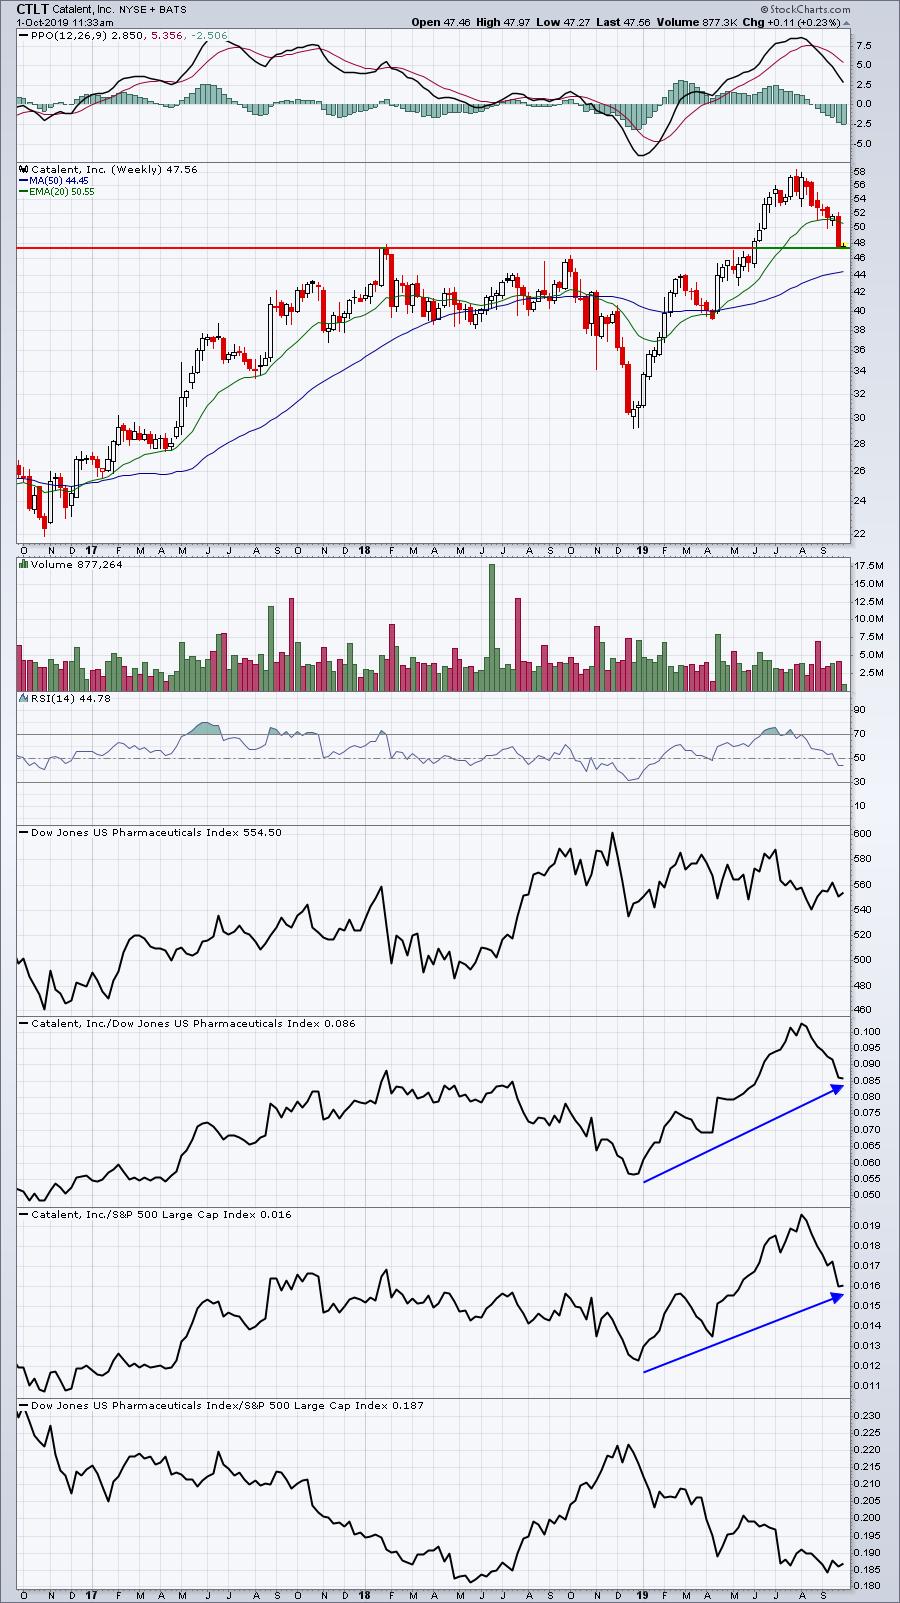
CTLT is just testing long-term price support from the breakout above its January 2018 high. Its weekly RSI is back in the 40s and relative strength, while dropping recently, remains in an overall uptrend.
EHTH:
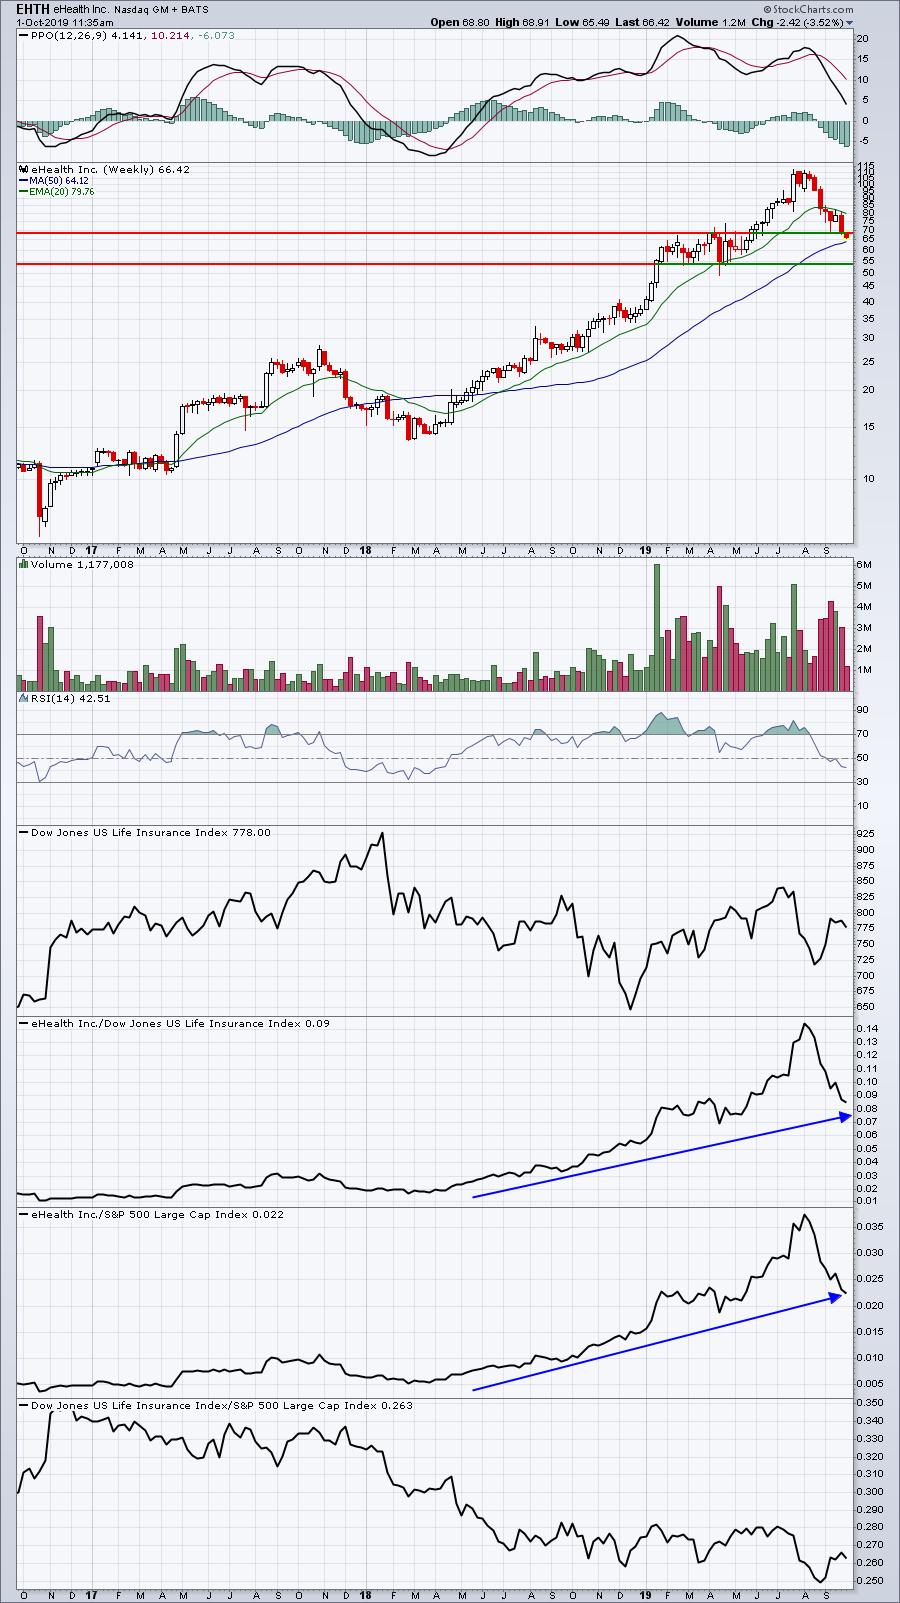
EHTH was such a massive outperformer from February 2018 through July 2019, it likely needed a rest. Still, we don't typically think of a "rest" as being a 40% selloff in eight weeks. Weekly RSI here of 42 plus price support between 55-70 suggests an aggressive buy could be taken right now. Be sure to strap on your seat belt first!
TTD:
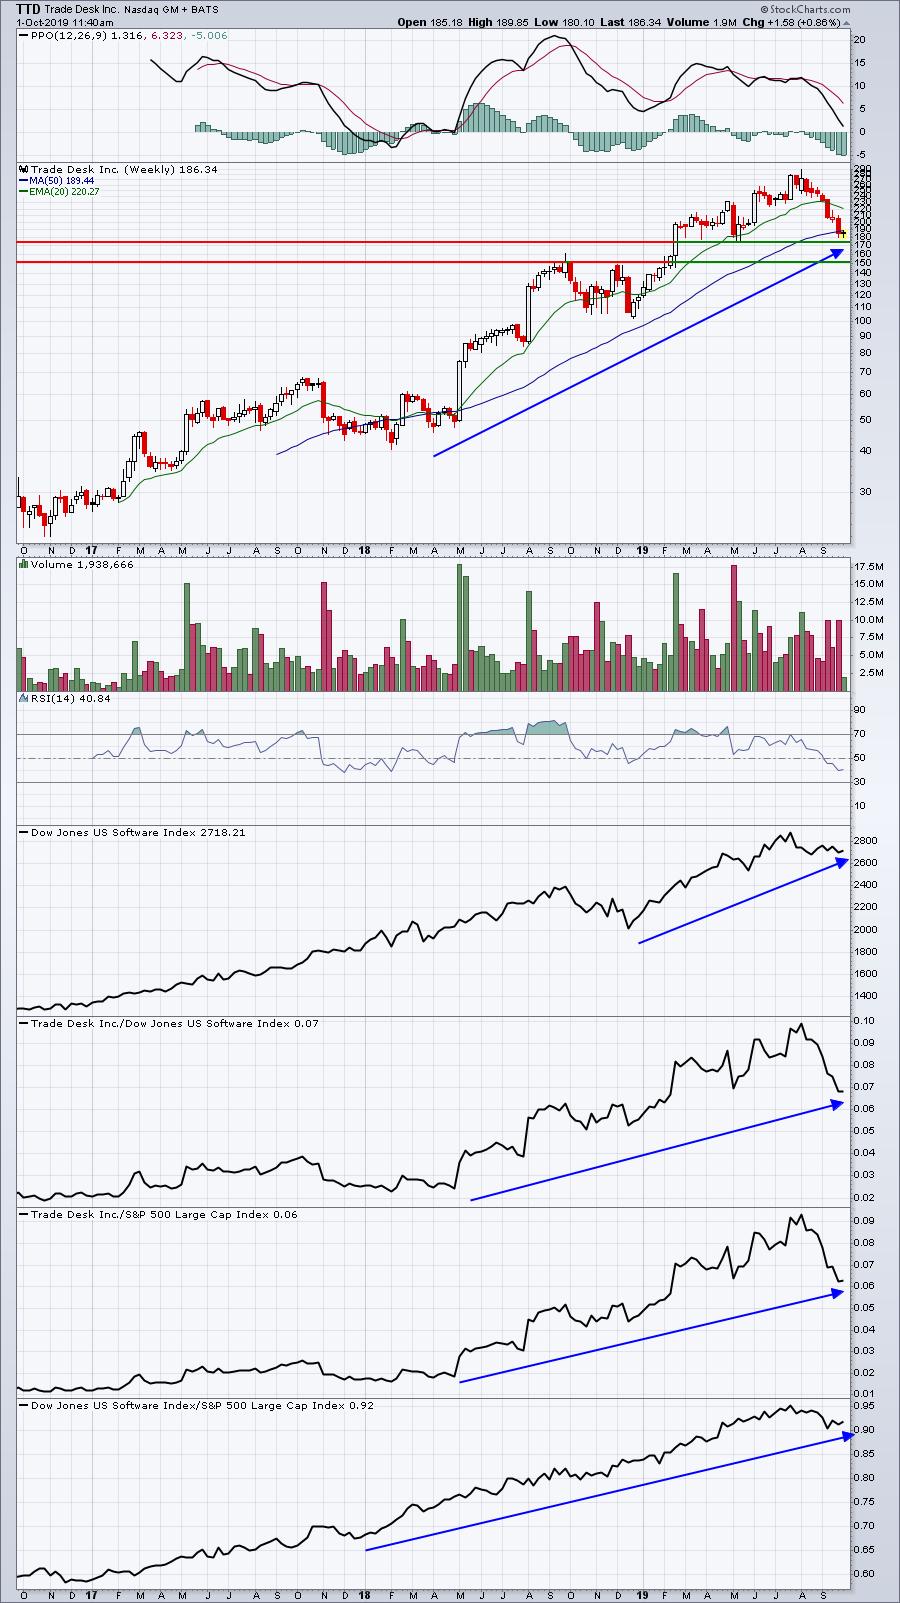
I could make a long-term argument for a lot of software stocks, but TTD has been one of the best - until August and September. If TTD is to turn back higher into Q4 earnings, I'd expect it to do so from the 150-175 support zone. Like the other two, weekly RSI has dropped into the 40s (actually hitting 40 here) and that's typically a nice area to take a shot from a long-term uptrend perspective.
Current Alerts
We only have active alert, although we'll be looking to potentially a couple more. Currently, the volatility and big swings back and forth are keeping us somewhat cautious in the near-term.
ROKU:
ROKU seems to be stabilizing after a few weeks of heavy selling. The recent trading zone has been 99-107. We're into our 6th day of trading in that area as you can see below with an hourly chart:
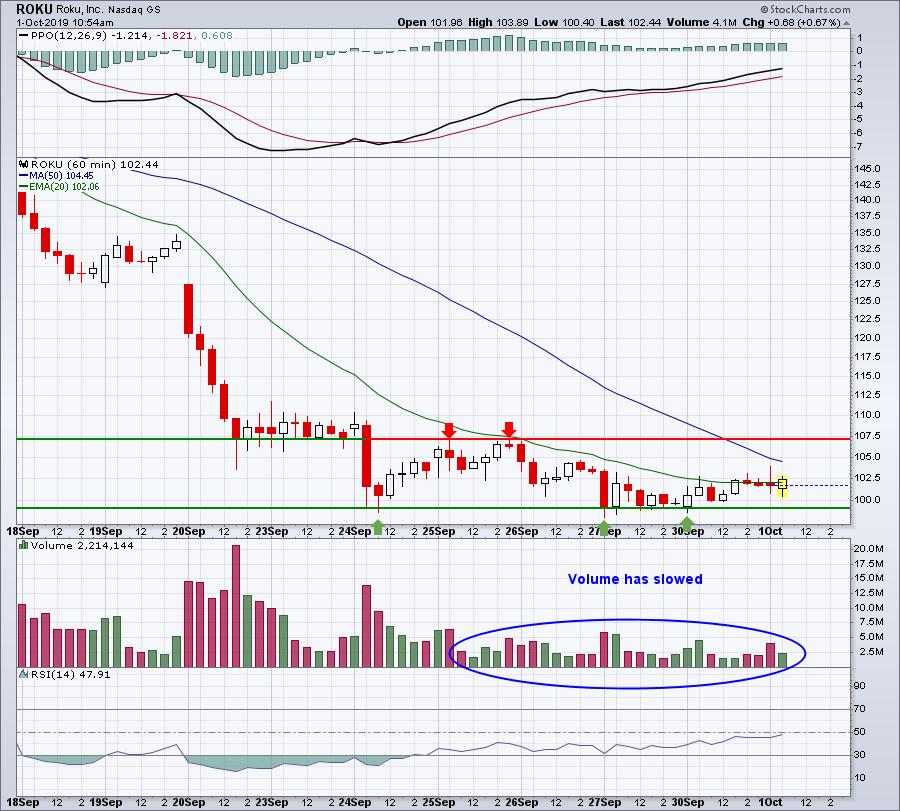
Thankfully, the selling volume has slowed, but it's too early to tell if it's gone. The first bullish step for ROKU will be to clear 107. That might be difficult on the first attempt.
Today's Movers
For today, I just want to point out the value of relative strength and the reason I try to avoid stocks that have been laggards vs. their peers and the benchmark S&P 500 for weeks or even months. The two biggest losers on the S&P 500 today are E*Trade Financial (ETFC) and Charles Schwab (SCHW). On the NASDAQ, the third biggest loser is TD Ameritrade (AMTD). If you routinely check relative strength, there's no way you'd be trading any of these three on the long side. Let's just look at AMTD, which is currently down 22.78%:
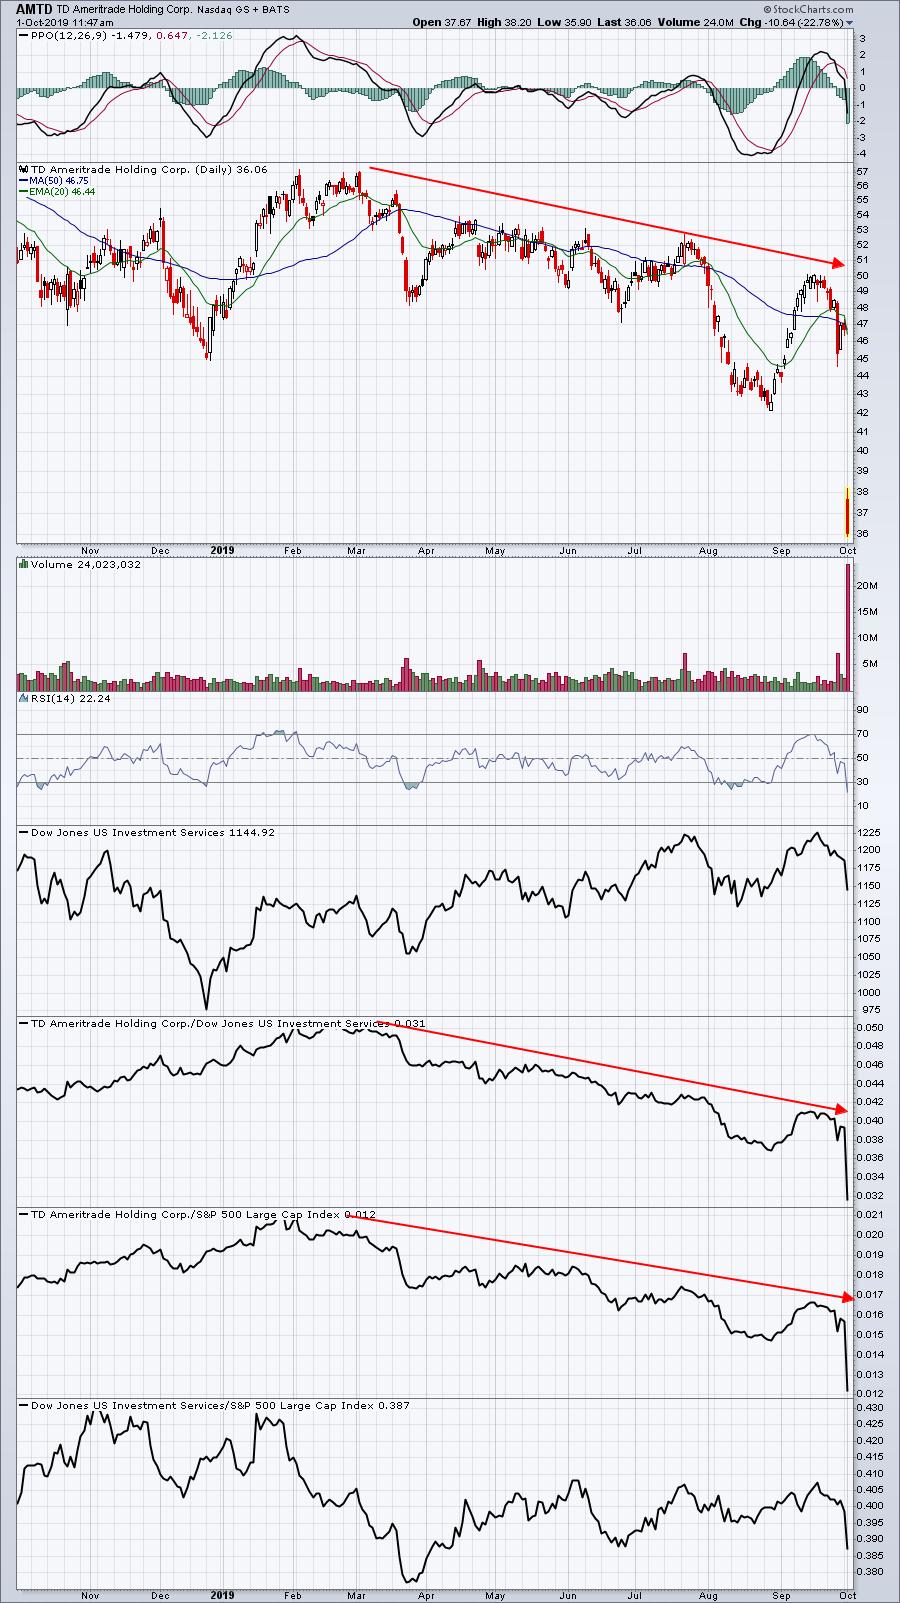
It's been a consistent underperformer throughout 2019. If you wait to see a stock begin to show higher relative highs and higher relative lows and reverse its absolute downtrend, you avoid owning a stock like AMTD on a day like today.
Earnings Reports
Here are key earnings reports for this week:
Tuesday, October 1:
MKC, NG, SFIX
Wednesday, October 2:
PAYX, LEN, LW, RPM, AYI, BBBY
Thursday, October 3:
PEP, COST, STZ
Friday, October 4:
None
Economic Reports
September PMI manufacturing released at 9:45am EST: 51.1 (actual) vs. 51.0 (estimate)
September ISM manufacturing released at 10:00am EST: 47.8 (actual) vs. 50.0 (estimate)
August construction spending released at 10:00am EST: +0.1% (actual) vs. +0.3% (estimate)
Happy trading!
Tom