
EB Daily Market Report - Monday, February 28, 2022
Executive Market Summary
- Futures were very weak when they opened on Sunday evening; we saw improvement overnight, but all of our major indices still opened lower
- Many countries were hitting Russia with sanctions over the weekend, mostly impacting their access to central banks worldwide
- Relative strength today can be found in the more aggressive NASDAQ shares as a falling 10-year treasury yield ($TNX) is likely putting a bid underneath growth stocks
- Sector leadership still remains somewhat questionable, though better than late last week
- Energy (XLE, +1.89%) is today's leader, while nearly half of our sectors are down more than 1%, including real estate (XLRE, -1.92%) and consumer staples (XLP, -1.65%)
- Financials (XLF, -1.38%) are weak, likely due to the falling TNX, which is down 12 basis points to 1.86%
- The Volatility Index ($VIX, +11.78%) has pushed back above 30 as emotional trading continues
- Renewable energy ($DWCREE, +6.83%) has been very strong today (and the past two days as well), but is now challenging key overhead resistance - more on this group below
Market Outlook
The craziness is moving to new heights. When futures opened Sunday evening at 6:00pm ET, it showed the NASDAQ down another 400-500 points initially. Overnight, futures improved with the NASDAQ opening down less than 1%. We've seen further buying this morning and, at last check, the NASDAQ was up roughly 0.50%. That's a far cry from where we were 18 hours ago. Again, this is the type of market behavior to expect. When the VIX is well into the 20s and 30s, I begin glancing at the hourly equity only put call ratio at cboe.com. Here are the instructions on how to find this information:
- Go to www.cboe.com
- Click on "Data" at the top of the screen
- Just beneath "Data", click on "Market Statistics"
- To the far left, under "U.S. Options", click on "Market Volume"
- Scroll down until you see "Equity Options"
- The hourly readings are CUMULATIVE, so if you want to get the half hour by half hour readings, you have to do a little math
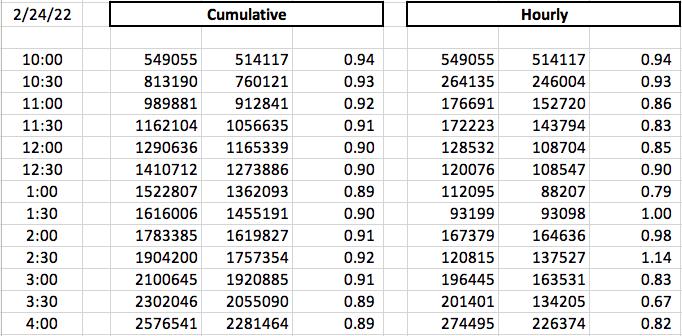
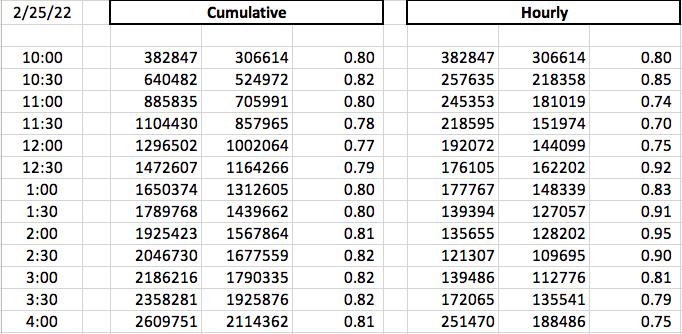
I've been watching this for the past 3 days. On Thursday, as you might imagine, the readings were heavily skewed towards put options. Here's my Excel calculation of the hourly readings Thursday, Friday, and so far today:
Thursday, February 24:
Friday, February 25:
Monday, February 28:
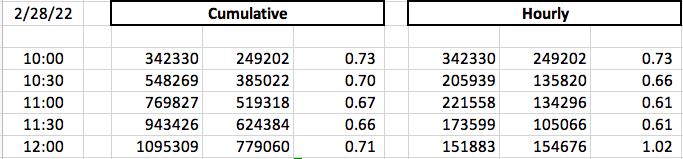
The readings on Thursday were bearish throughout the day, despite the huge intraday rally off the massive gap lower. That likely aided the recovery. Friday's readings also remained fairly high, though they did drop off of Thursday's readings a bit. Thus far today, we can already see the effect of the recent rebound. Traders are growing a bit more bullish. This is why following the equity only put call ratio is so powerful. Humans are naturally followers. They chase performance. The lower these readings get today, and possibly over the next couple days, the more likely we are getting close to a major reversal back to the downside.
I don't include index options because many professionals will hedge by trading index puts. It's not that they're bearish, they're simply using index options as a form of "insurance". You tend to see much higher readings on index options, as opposed to equity options. Also, there tends to be a disconnect between the equity only put call ratio at cboe.com and the readings shown on StockCharts.com. I've never researched the difference, but perhaps one includes ETFs and the other doesn't? Again, I haven't tried to follow up. Quite honestly, I only care to see where the readings are vs. history.
Sector/Industry Focus
Renewable energy ($DWCREE) is soaring and has really made a huge move over the past few days. There was a positive divergence and now the group has tested its 50-day SMA with its PPO moving closer to centerline resistance. I'd expect renewable energy stocks to pause here. Those who are EXTREMELY aggressive could consider shorting the group (or individual stocks in the group) here. Check out the chart:
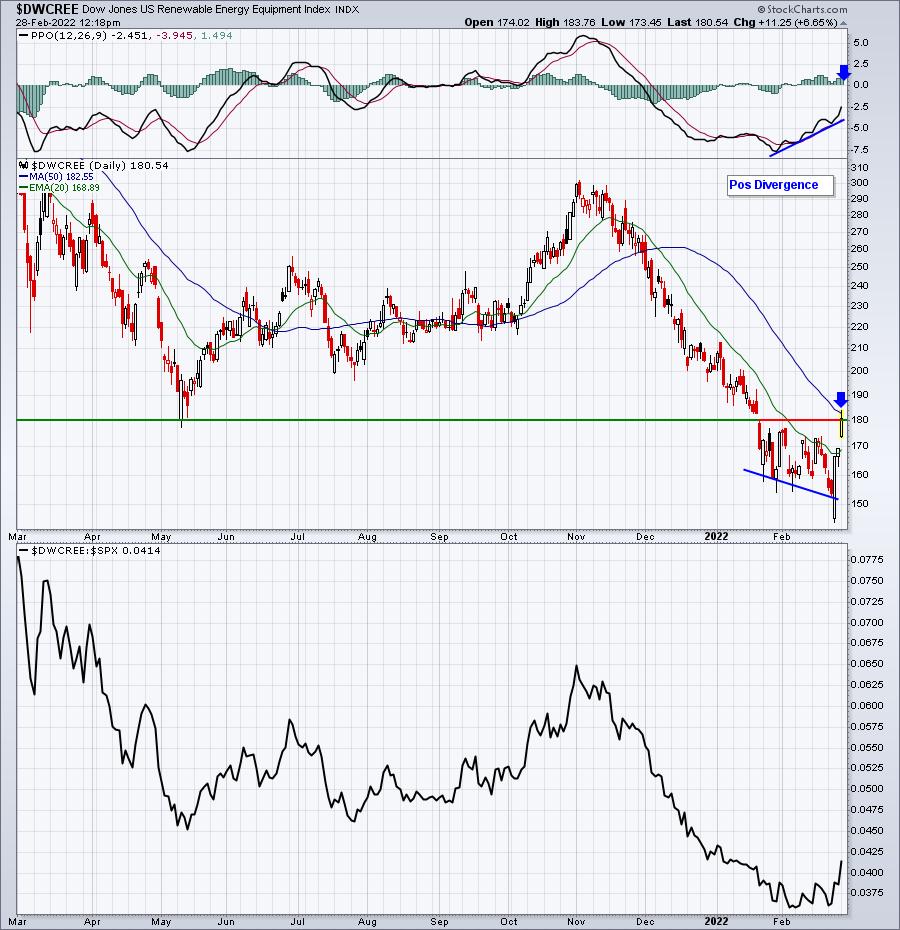
Note also that the low back in May could now serve as key resistance. My "educated" guess is that renewable energy may be topping right here. I'd be quick to admit defeat, however, if the group finishes strong today.
ChartLists/Strategies
The Upcoming Earnings ChartLists have been updated on our website. In particular, today's ChartList shows some big movers. Check this out:
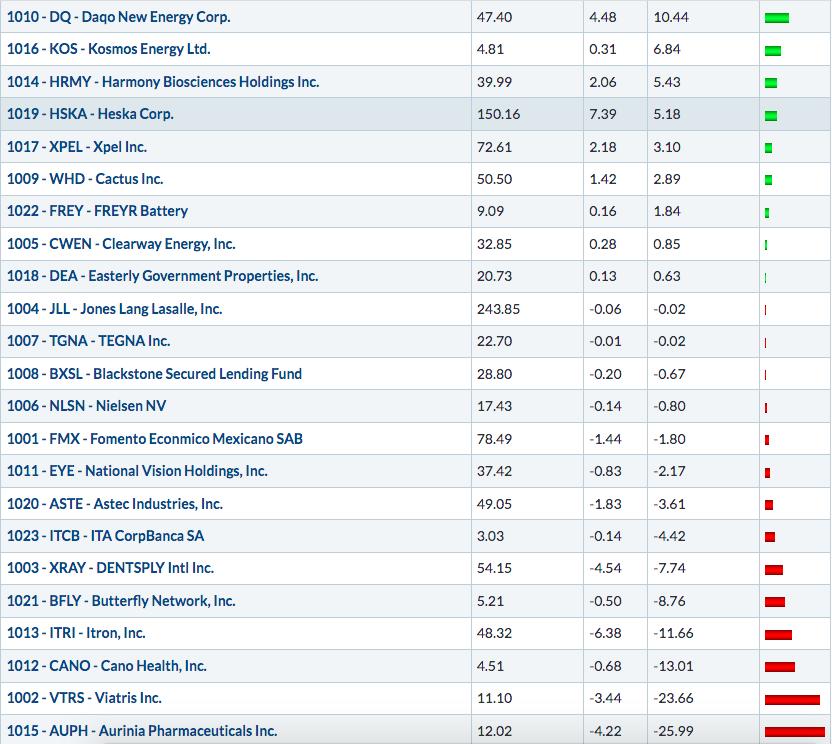
One stock that looks interesting to me is KOS, attempting to make a breakout. It's already a technically-sound chart and a breakout today would only add to that. In the meantime, however, a pullback to test the rising 20-day EMA would represent the best reward-to-risk entry:
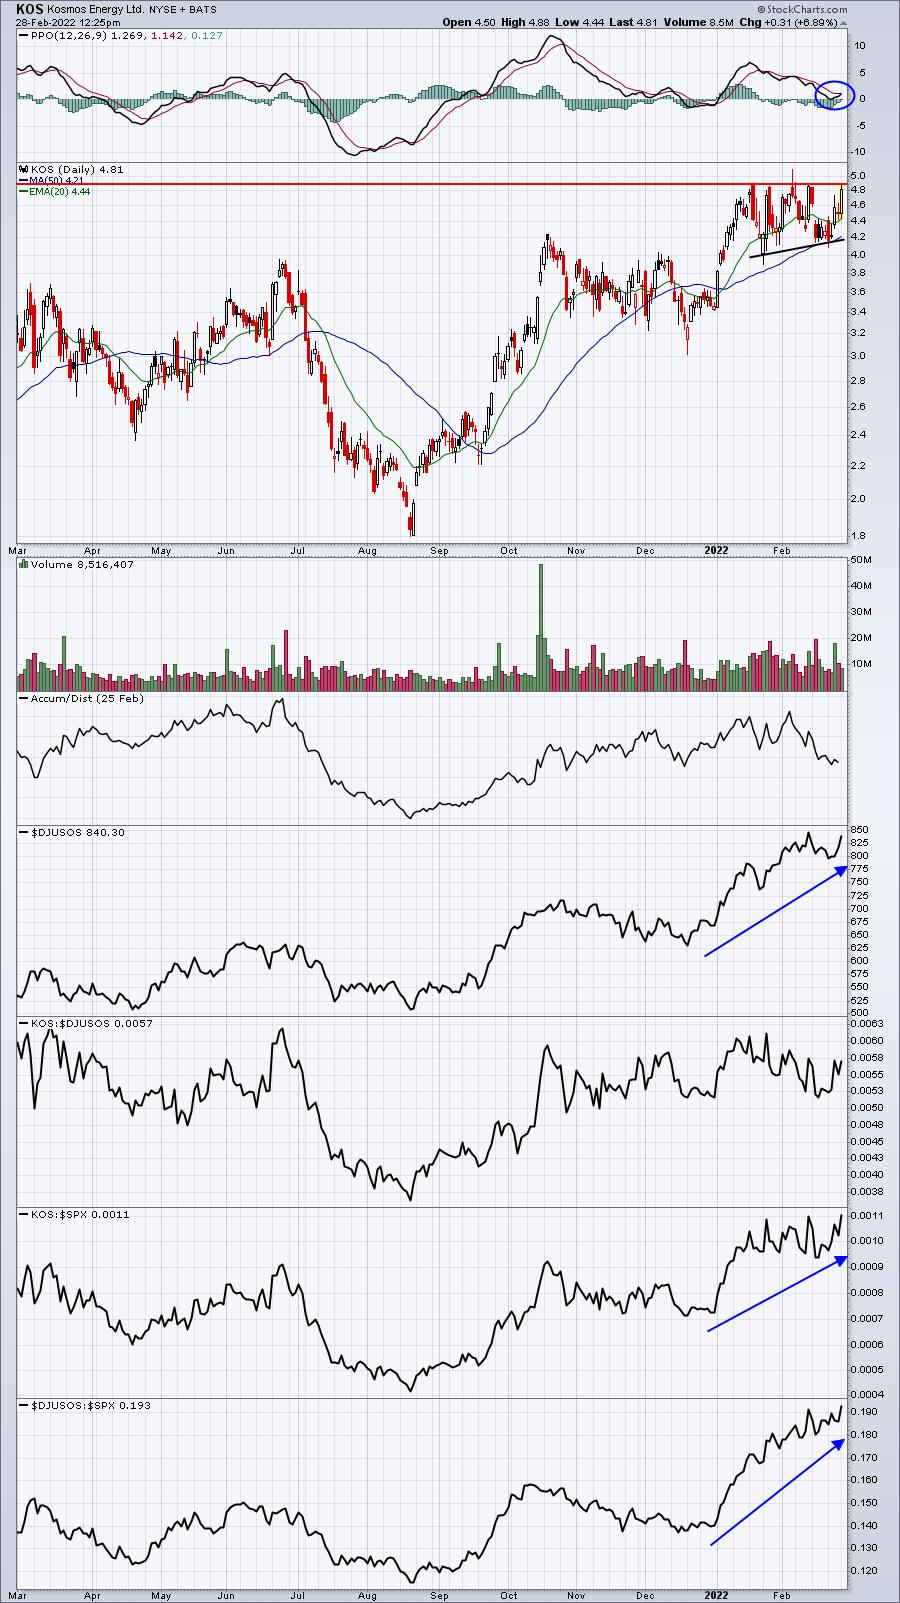
The recent higher lows and the equal highs give this the look of a bullish ascending triangle pattern. A breakout would measure to roughly 5.90. The PPO has reset near its centerline, so a breakout would likely be more sustainable, with the rising 20-day EMA acting as solid support on any pullbacks.
Earnings Reports
Here are the key earnings reports for the next two days, featuring stocks with market caps of more than $10 billion. I also include a few select companies with market caps below $10 billion. Finally, any portfolio stocks that will be reporting results are highlighted in BOLD. If you decide to hold a stock into earnings, please understand the significant short-term risk that you are taking. Please be sure to check for earnings dates for any companies you own or are considering owning.
Monday, February 28:
WDAY, LCID, ZM, HPQ, SBAC, OKE, FMX, VTRS, XRAY, JLL, DAR, GDRX, TREX, CWEN, NLSN, NVAX, FSK, PDCE, AMBA, LAZR, TGNA, ACHC, SGRY, ACAD, SAIL, PGNY, DQ, EYE, AAON, TASK, VRRM, ITRI, DDD, PRAA, NKTR, VCYT, BIGC, DVAX, APR, BFLY, BLNK
Tuesday, March 1:
CRM, TGT, BNS, BMO, SE, BIDU, AZO, ROST, EC, HRL, HPE, HZNP, DPZ, SJM, BLDR, BSY, CLVT, AMC, SOFI, KSS, FSLR, SRPT, IGT, HGV, ADT, SGMS, WEN, MLCO, PRGO, CELH, FOUR, JWN, IQ, TWNK, KTB, URBN, ZIP, REGI, EVERI, XHR, CDLX, NSTG, AVID, TGTX, AMRN
Economic Reports
February Chicago PMI: 56.3 (actual) vs. 63.0 (estimate)
Happy trading!
Tom