
EB Daily Market Report - Tuesday, February 28, 2023
Upcoming Vacation Starts This Friday
I've been mentioning this in recent weeks, but I want to make sure everyone is aware. I'll be out of the country on vacation from this Friday, March 3rd through the following Friday, March 10th. There will be no Trading Places Live shows during that period, although there will likely be earlier recordings replayed on StockCharts TV on Tuesday, March 7th and Thursday, March 9th. There will be no Daily Market Reports on Friday, March 3rd or the following week, but John Hopkins will provide everyone at least a brief market update each day. There will be no EB Weekly Portfolio Report on Sunday, March 5th, though I should be back in time to provide one on Sunday, March 12th.
I am working on updating all the ChartLists and my plan is to have all key ChartLists (SECL, SFECL, SADCL, RGCL, and BTCL) completed prior to leaving on March 3rd. I am also striving to complete both the March Seasonality and March Short Reports before I go as well. It should be a fairly quiet period from March 3rd through March 10th as earnings season slows down significantly and there'll be no more Fed meetings until March 21-22. The jobs report will be out on Friday, March 3rd, so we could see a bit of fireworks that day, but otherwise it should be relatively quiet.
Executive Market Summary
- Futures were mostly higher overnight, but those pre-market gains were erased as our major indices opened slightly lower
- Cryptocurrencies are mostly higher today and litecoin ($LTCUSD, +2.90%) continues to show relative strength vs. bitcoin ($BTCUSD)
- Commodities are mostly higher on the session, led by crude oil ($WTIC, +2.34%), which has risen back above $77 per barrel
- The 10-year treasury yield ($TNX) is up 2 basis points to 3.94% as treasury prices fall
- Sector performance is mixed with defensive groups mostly lagging; utilities (XLU, -0.53%) and consumer staples (XLP, -0.48%) are the two-worst performing sectors
- Meanwhile, steel ($DJUSST, +2.96%) and aluminum ($DJUSAL, +2.53%) are leading a strong materials (XLB, +0.88%) group
- The Dow Jones is lagging as its health care components struggle; Merck (MRK, -1.94%) and Unitedhealth Group (UNH, -1.39%) are laggards
- Semiconductors ($DJUSSC, +0.55%) are fairly strong, led by Applied Materials (AMAT, +4.33%), the second-best performer on the S&P 500
Market Outlook
I'll be sending out our "EB Monthly Seasonality Report - March" later today, but I'll give you a sneak preview as to how March typically unfolds. Historically, U.S. equities perform very well during the first two calendar months of each quarter - both in anticipation of earnings and then earnings itself. But the third calendar month tends to favor more value-oriented and defensive stocks. March isn't a bad month. Since 1950, it actually ranks as the 5th best calendar month of the year, trailing only November, December, April, and July (in that order). Here are two seasonal considerations as we approach March.
Utilities over Transports
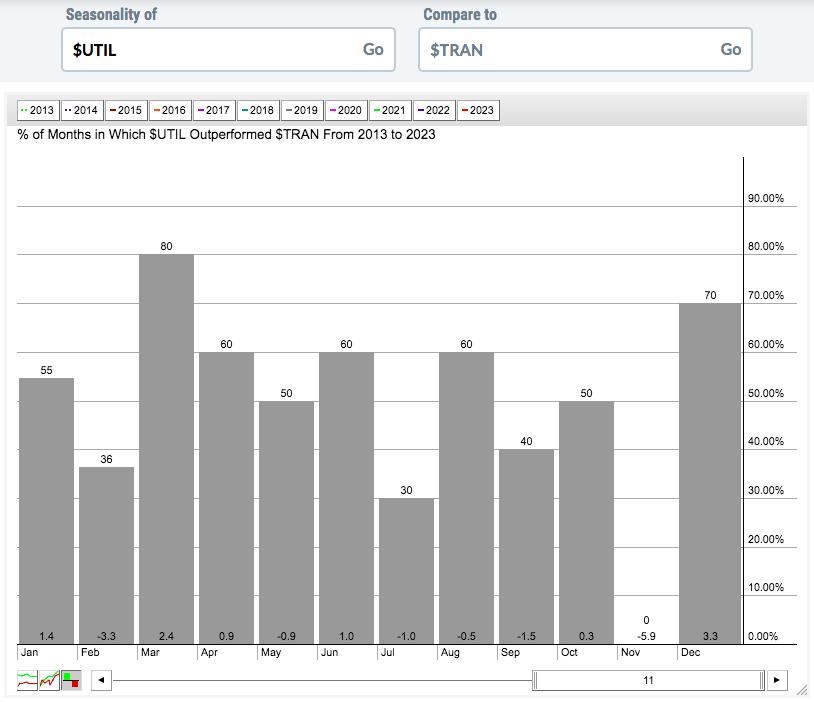
During secular bull market advances, transports ($TRAN) typically outperform utilities ($UTIL). That's especially true during the month of November. Since this secular bull market started in 2013, utilities have never outperformed transports in November. In March, it's nearly opposite. The $UTIL has bested $TRAN during 80% of March's since 2013 and has averaged outperforming by 2.4%, its best relative performance month, other than December:
Staples over Discretionary
Consumer staples (XLP) have averaged outperforming consumer discretionary during March by 1.2% since 2013. Again, this shift to defensive sectors is typical for third calendar months of calendar quarters. Here's a breakdown of how the XLP performs relative to the XLY in each of the 3 calendar months of quarters:
- Month 1 (Jan, Apr, Jul, Oct): -4.0%
- Month 2 (Feb, May, Aug, Nov): -2.3%
- Month 3 (Mar, Jun, Sep, Dec): +3.0%
So even during a secular bull market like the one we've enjoyed since 2013, there's a rotation that quite obviously takes place during third calendar months of quarters. News slows down and money rotates - for a period of time. Then earnings season approaches and money rotates back to offensive sectors. That's how the stock market works. Keep in mind these are tendencies, not guarantees. This rotation doesn't happen every month according to the above. But there's a definite tendency to do so that we all need to be aware of, especially those of us who like to swing trade.
This rotation is why I suggested the S&P 500 could be most vulnerable during February and March. It's also why I provided the chart in early January at MarketVision 2023 that suggested we'd see a big rally in January, followed by a period of weakness/consolidation in February/March. It's a seasonal tendency, certainly not a guarantee.
Sector/Industry Focus
Over the past month, precious metals ($DJUSPM) and miners ($DJUSMG) have completely fallen apart. I pulled up our Industry Group Relative Strength ChartList in summary form for the past month to see what groups have struggled the most relative to the S&P 500. Here are the Bottom 10:
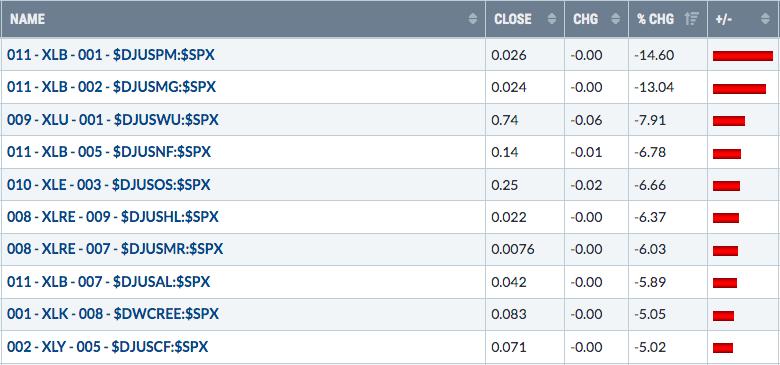
The top 2, BY FAR, are the precious metals and miners. I have remained steadfast in saying that gold (GLD) is only worth owning when the Volatility Index ($VIX) is on the rise. Some falsely believe that you want to own gold when the dollar (UUP) is falling. It's true that gold tends to rise when the dollar falls, but that doesn't mean it'll outperform the S&P 500. True outperformance occurs by gold, precious metals, and miners when there is tremendous fear in the air. Check out this chart:
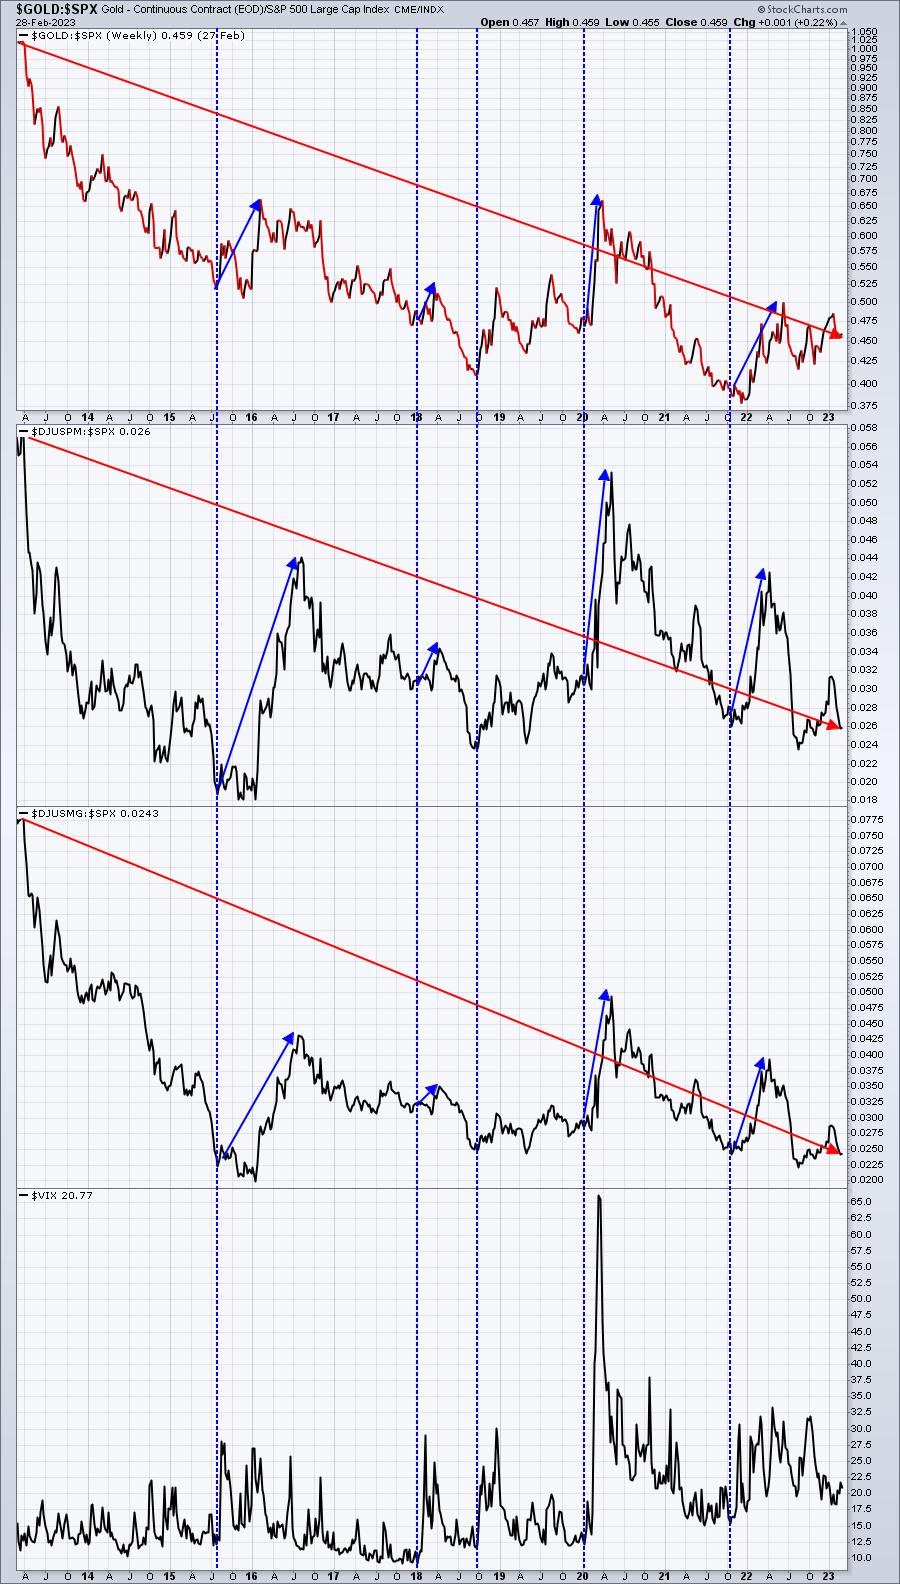
Every significant spike in the relative performance of gold, precious metals, and miners occurred when the VIX was rising. It had nothing to do with the dollar. The dollar will influence absolute performance, but not relative performance. Aren't we looking for outperformance? I wrote an article in my Trading Places blog early in 2022, saying that it was time to buy gold and that I believed gold could explode higher. I said it because I expected the VIX to rise throughout the cyclical bear market. That's the time to own gold. Owning gold and precious metals during a secular bull market is literally throwing returns right out the window. I'm still not a fan of this area. I believe the next time to own gold long-term for strong relative performance will occur as we enter our next secular bear market, which I don't believe we'll see until the 2030s. That's when gold outperforms. Think 1970s. Think 2000s. And the upcoming 2030s - all in my opinion, of course.
ChartLists/Strategies
I like trading stocks that sell off early in the session with strong AD lines. Strong AD lines are the result of stocks tending to finish their trading sessions in the upper half of their daily trading range. Therefore, stocks with strong AD lines that are down in the morning could see buying later in the day. That's their tendency and why they are on our Strong AD ChartList (SADCL). Here are the worst performers on our SADCL as off 11am ET today:
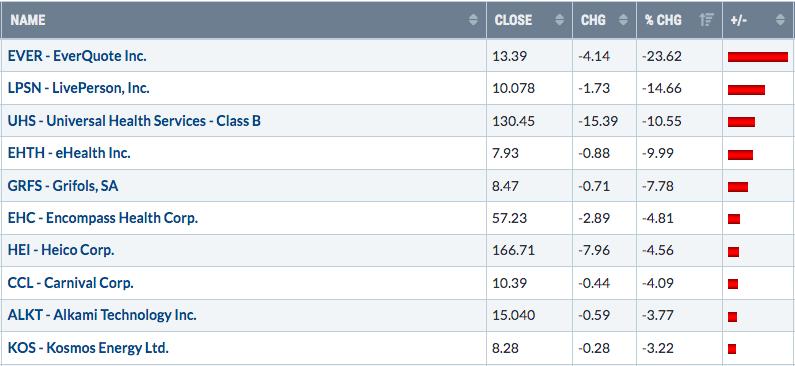
I know EVER and EHTH both reported quarterly earnings and their reactions are obviously quite negative. EHTH, however, is quite interesting, because it's been a very hot stock and it beat both its top and bottom lines by a mile. In other words, it CRUSHED its revenue and EPS estimates. This could be a "buy on rumor, sell on news" scenario. Will EHTH rebound today? I don't know, but given its strong AD line, there's a decent chance buyers step back in. Here's the chart:
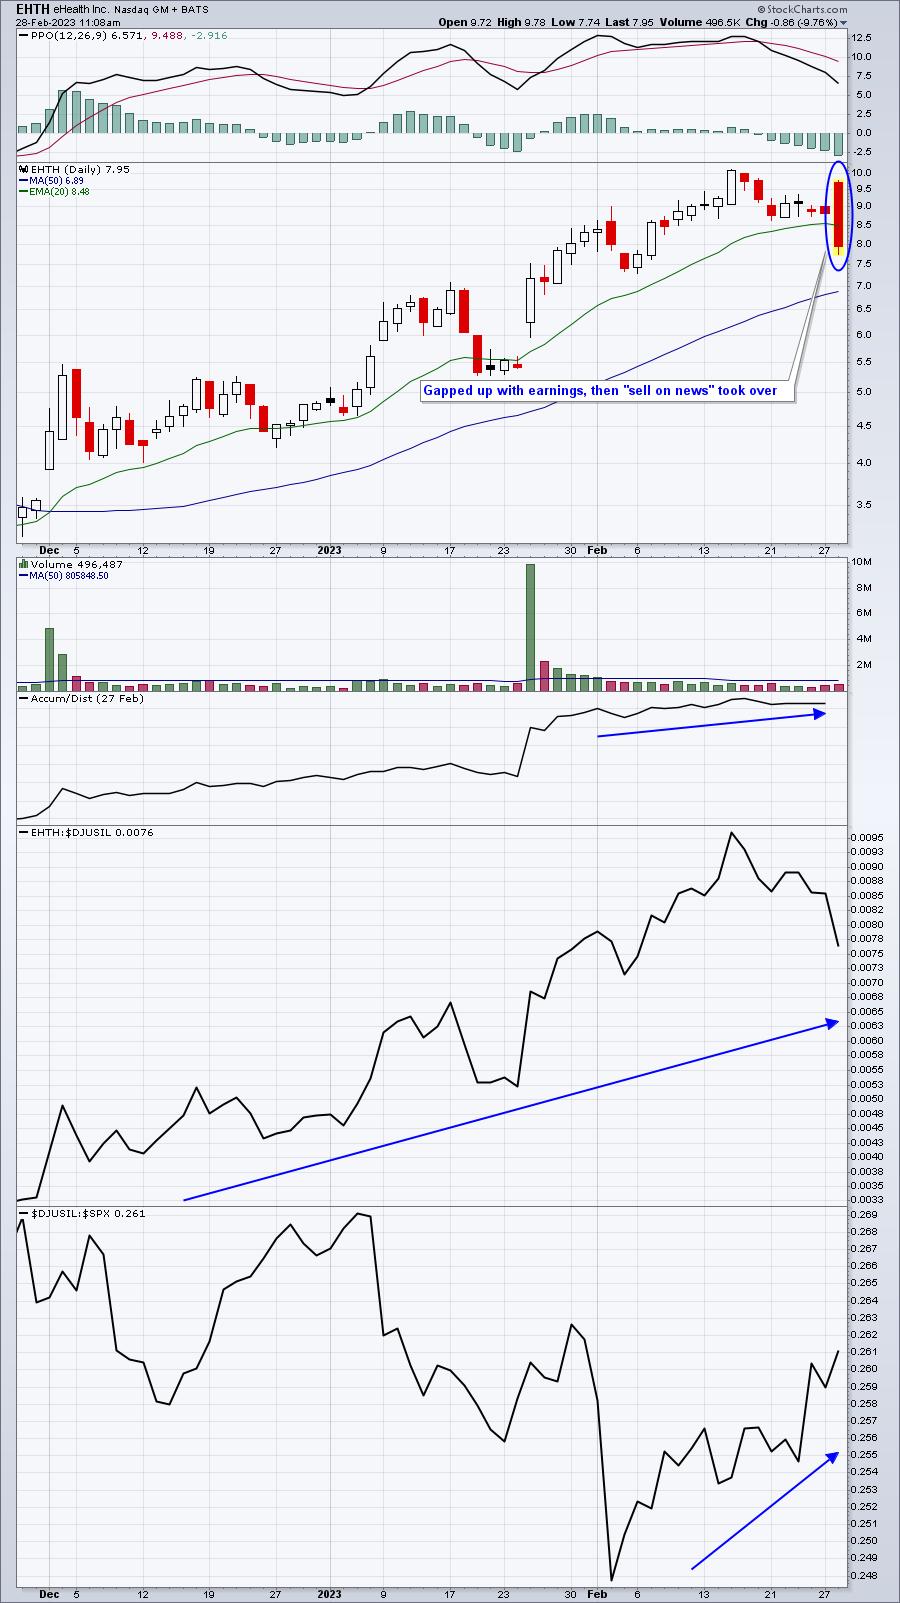
There's definitely more room to the downside, but how long will a strong performer stay down after releasing MUCH better than expected news? I took a small position around 7.95, because EHTH is a risky trade. If it continues lower into the 7s, I may consider adding. For now, I'm comfortable with a small position.
Earnings Reports
Here are the key earnings reports for the next two days, featuring stocks with market caps of more than $10 billion. I also include several companies with market caps below $10 billion. Finally, any portfolio stocks that will be reporting results are highlighted in BOLD. If you decide to hold a stock into earnings, please understand the significant short-term risk that you are taking. Please be sure to check for earnings dates for any companies you own or are considering owning.
Tuesday, February 28:
TGT, BMO, BNS, MNST, SRE, AZO, A, ROST, HPQ, VRSK, CPNG, EC, FSLR, RIVN, SJM, RKT, EDR, AXON, BLDR, BSY, RYAN, SRPT, BKI, MASI, AAP, XRAY, NXST, ADT, NCLH, IGT, FOUR, NTRA, SWX, OLPX, AMBA, DUOL, MQ, AMC, RVNC, PRFT, KTB, URBN, TGTX, CARG, SILK, SPCE, OMI, MYGN, DDD, WRBY
Wednesday, March 1:
CRM, RY, LOW, SNOW, DLTR, VEEV, HZNP, SPLK, NIO, OKTA, JAZZ, PSTG, PLUG, CLH, CELH, MLCO, WB, WEN, BOX, DV, KSS, AXNX, AEO, FTDR, MDRX, EVRI, XHR, JACK, ANF, ZUO
Economic Reports
January wholesale inventories: -0.4% (actual) vs. +0.0% (estimate)
December Case-Shiller home price index: -0.5% (actual) vs. -0.5% (estimate)
December FHFA house price index: -0.1% (actual) vs. -0.3% (estimate)
February Chicago PMI: 43.6 (actual) vs. 45.0 (estimate)
Happy trading!
Tom