
EB Daily Market Report - Wednesday, March 31, 2021
ChartList Update
The Short Squeeze ChartList (SSCL) has been updated on our website. The Strong Earnings ChartLists, Strong Future Earnings ChartList, and Raised Guidance ChartList were all updated over the weekend. You can view those ChartLists on our website, or download them directly into your StockCharts.com account (requires an Extra or Pro membership at SC.com).
Executive Market Summary
- Futures were mixed overnight and this morning, though we've seen much more strength from the NASDAQ
- The U.S. Dollar (UUP) is taking a breather today, but is starting to rally back this afternoon
- The 10-year treasury yield ($TNX) is up 2 basis points to 1.74% after solid jobs data was released via the ADP employment report; the more-closely watched nonfarm payrolls report will be released on Friday
- The drop in the dollar is lifting most commodities, though that list doesn't include crude oil ($WTIC), which is lower by 2.41% to $59 per barrel
- It's been awhile, but technology (XLK, +1.82%), consumer discretionary (XLY, +1.17%), and communication services (XLC, +0.86%) are the top three sectors on the session
- Energy (XLE, -0.62%), reeling a bit from the drop in crude, trails all sectors
- Renewable energy ($DWCREE, +5.11%), autos ($DJUSAU, +3.72%), and semiconductors ($DJUSSC, +3.17%) are the top industries
- Chewy (CHWY, +6.84%) and Walgreens Boots Alliance (WBA, +4.13%) are performing well after better-than-expected earnings reports; the latter is today's best Dow Jones component stock
Market Outlook
Earlier this week, the Dow Jones set an all-time high at 33259. Today, the S&P 500 set a new all-time high at 3994.41, less than 6 points away from a historic move past 4000. Coming into 2021, I was expecting all-time highs and another solid year ahead. Through one-quarter of the year - check and check. The problem child, however, has been the NASDAQ as growth stocks have been shunned, particularly over the past six weeks. Well, now is the time for the NASDAQ to shine as we move into April and begin thinking about upcoming earnings reports. History supports a move higher in April.
We have two perfectly-sloped downtrend lines to form a channel off the February 16th high on the NASDAQ. We also have a declining 20-day EMA that the NASDAQ must negotiate. We're trying to close back above the 20-day EMA this afternoon. It currently resides at 13208. We're trading roughly 0.5% above that moving average. The down channel is a different story. We have yet to clear that:
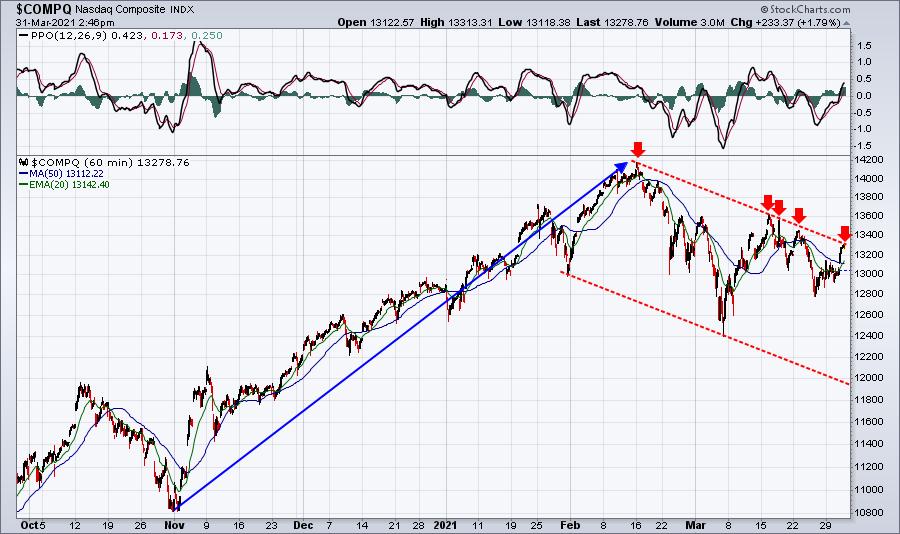
This is a big opportunity for the bulls. We're moving into a period where U.S. equities have a long history of performing well. Since the 2009 market bottom, April has been the NASDAQ's 2nd strongest month, trailing only July:
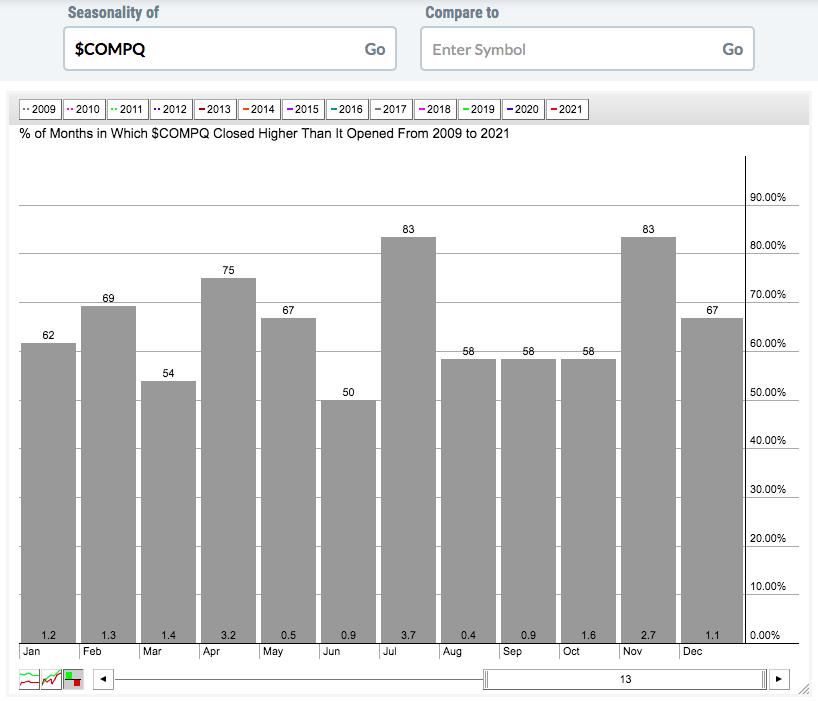
So I suppose the question is.....do the April tailwinds carry the NASDAQ to another breakout as earnings season kicks into gear? As we close out March, the channel breakout is literally waiting on the doorstep.
Sector/Industry Focus
Like the NASDAQ above, the technology sector (XLK) is attempting to do what it needs to do to stop the bleeding - close back above the 20-day EMA and clear neckline resistance near 135:
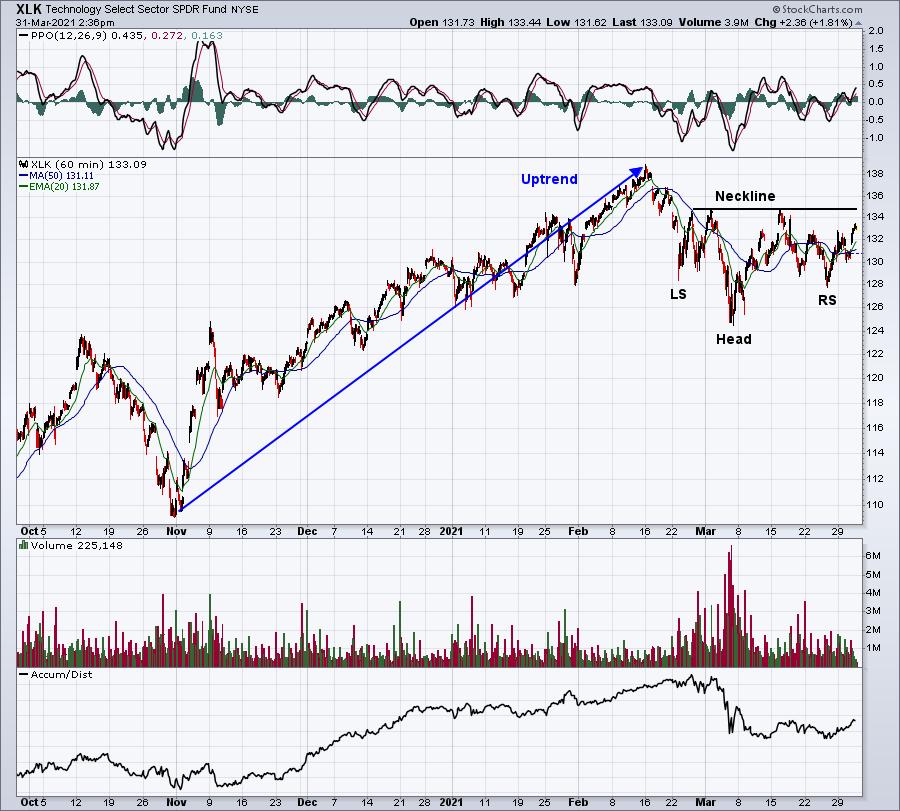
Confirmation of this pattern would be a breakout above 235. Failure to hold right shoulder support, though, would likely lead to further selling and a potential test of the early-March low just above 124. We are coming off an extended uptrend, so I tend to believe that patterns will break in the direction of the prior trend, which is higher.
ChartLists/Strategies
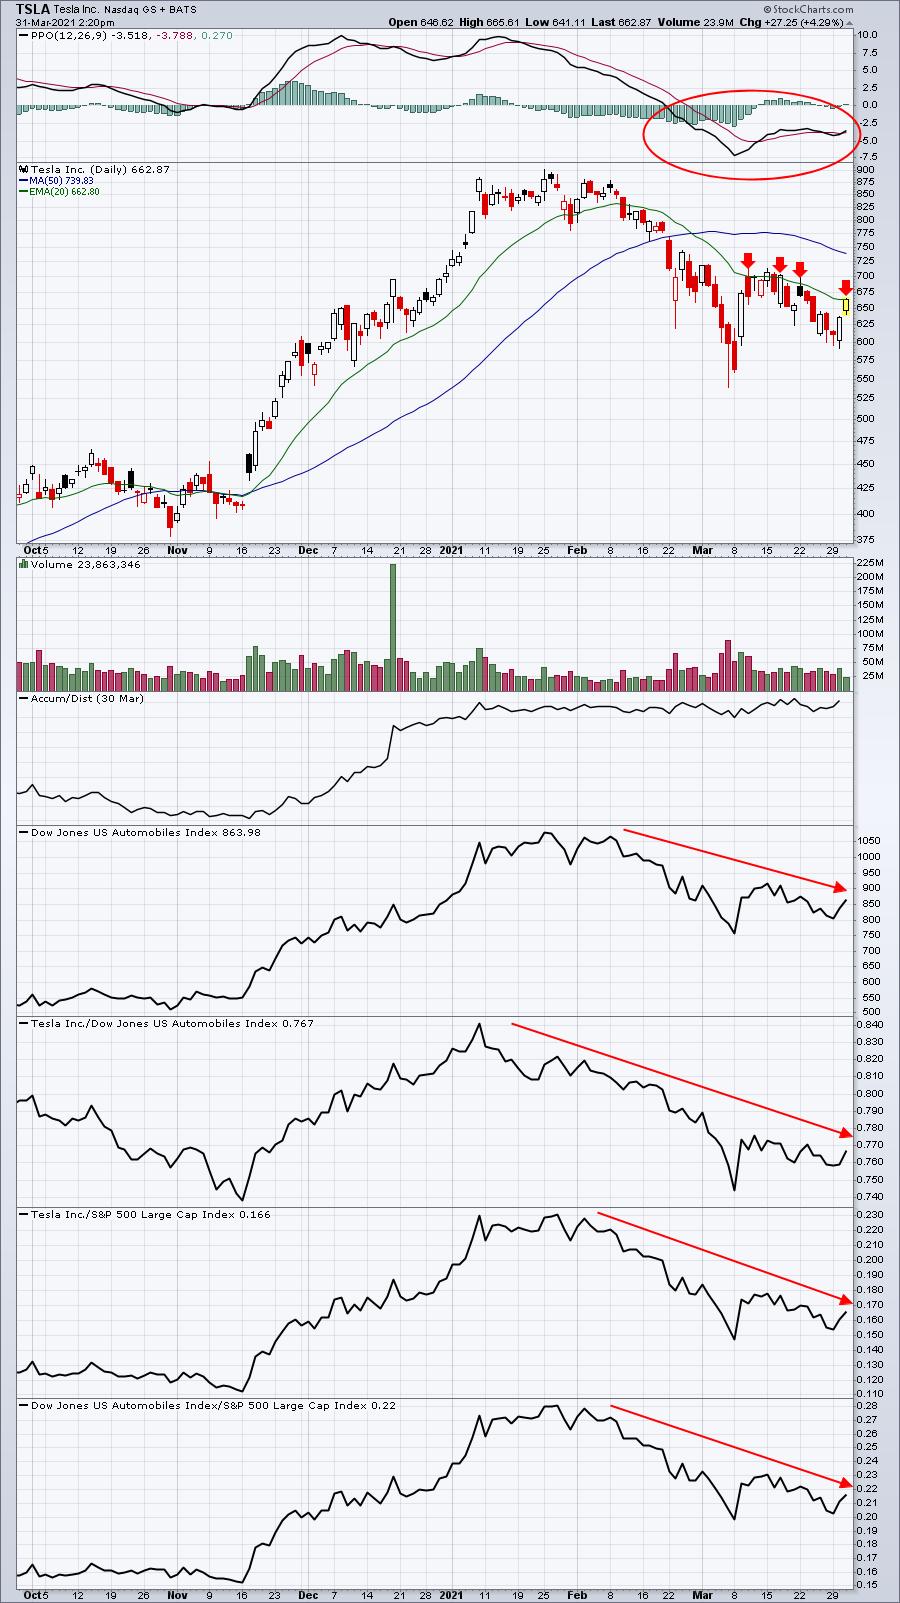
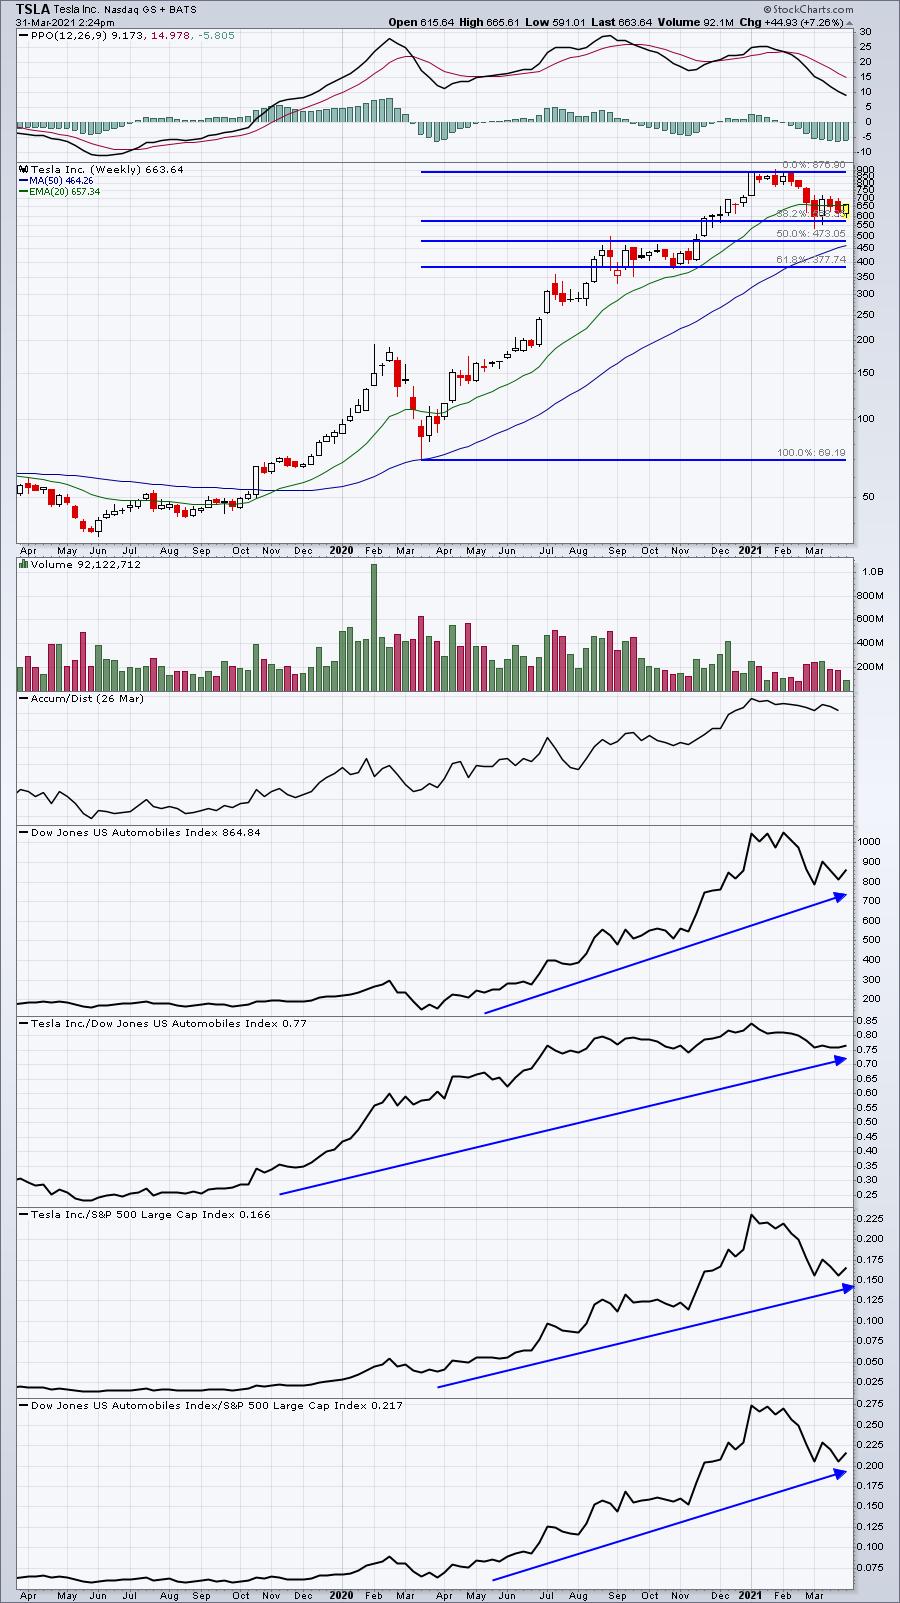
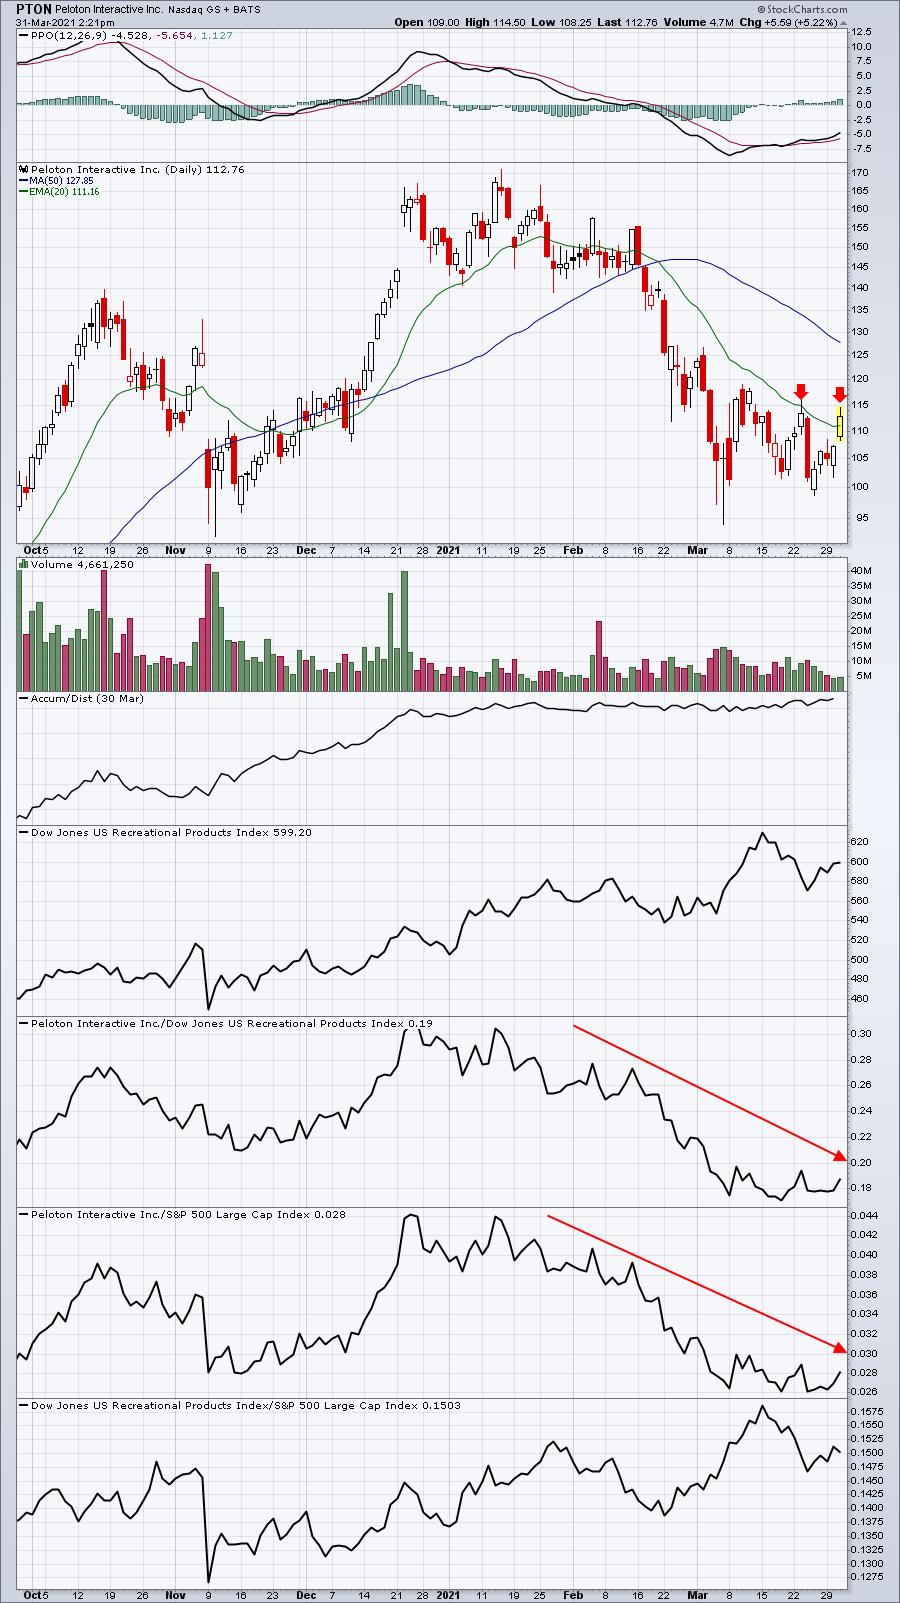
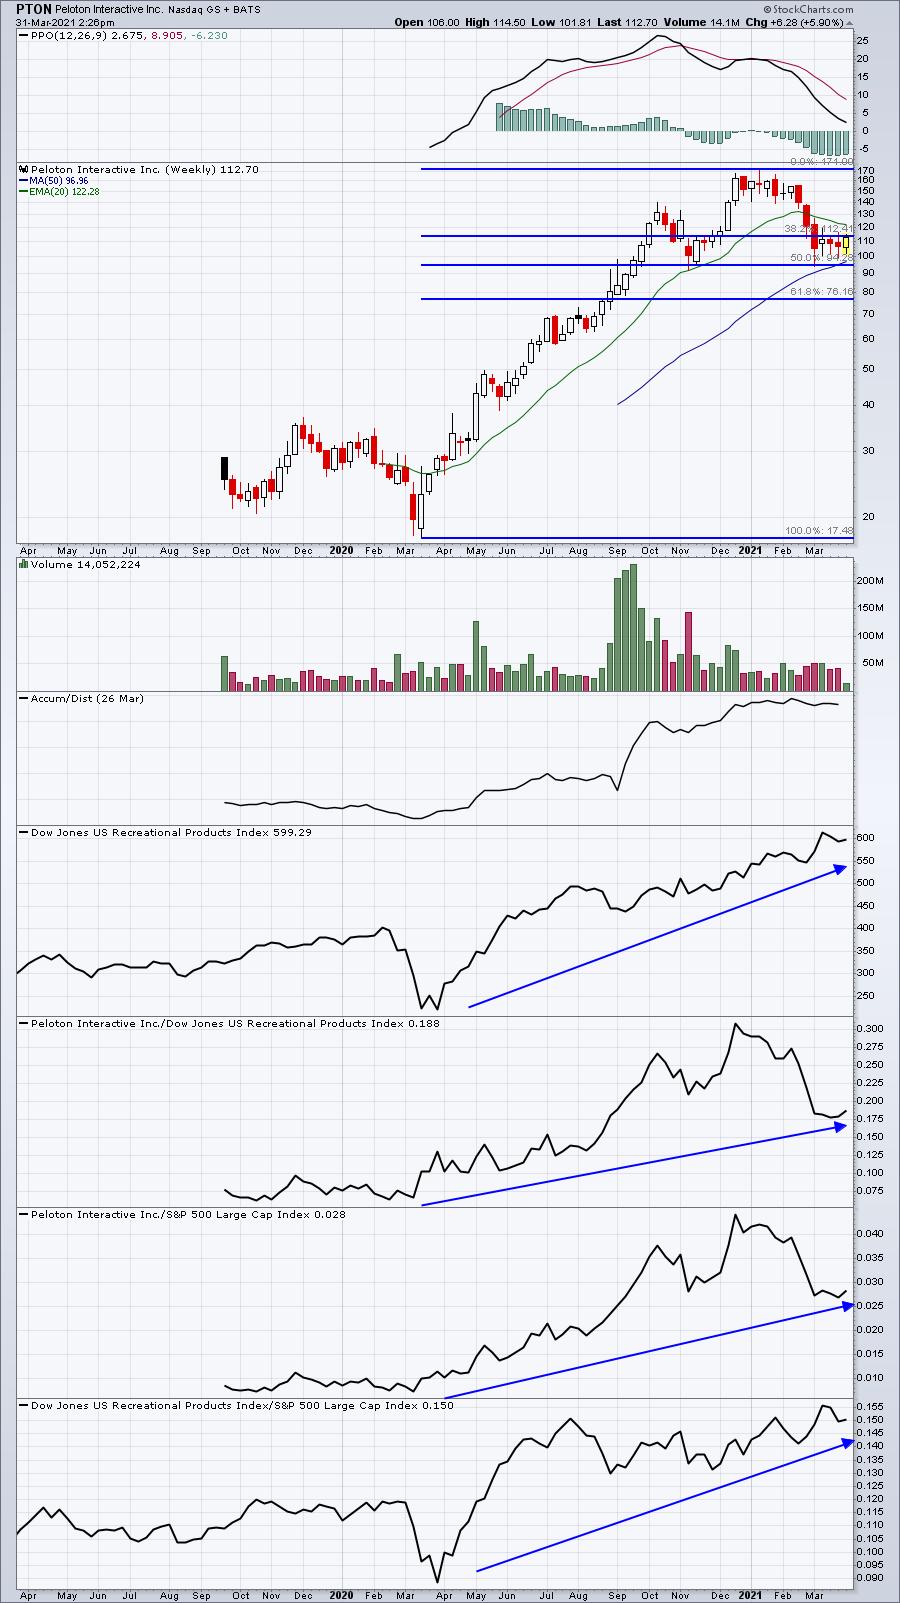
Changing time frames on your charts could very likely change your perspective on a stock's outlook. I want to show you two stocks that I've addressed plenty of times over the past year - Peloton (PTON) and Tesla (TSLA) - and look at them on both a 6-month daily chart and a 2-year weekly chart:
TSLA - 6-month daily chart:
TSLA - 2-year weekly chart:
PTON - 6-month daily chart:
PTON - 2-year weekly chart:
The 6-month daily charts show two companies struggling, with each trying to push back through declining 20-day EMAs. Their PPOs are deeply in the red and their relative weakness is quite apparent.
But switching to a longer-term weekly chart shows a completely different picture. Over a two-year weekly span, I see two leading stocks that were in desperate need of some selling and consolidation, which we've now seen on those shorter-term daily charts. The Fibonacci retracement tool suggests that both pullbacks may have run their course. Before we can make that call, however, we need to see both TSLA and PTON trade back above their respective 20-day EMAs and use that moving average as support in the weeks ahead, rather than resistance we've seen over the past 4-6 weeks.
Earnings Reports
Here are the key earnings reports for the next two days, featuring stocks with market caps of more than $10 billion. I also include a few select companies with market caps below $10 billion. Finally, any portfolio stocks that will be reporting results are highlighted in BOLD. If you decide to hold a stock into earnings, please understand the significant short-term risk that you are taking. Please be sure to check for earnings dates for any companies you own or are considering owning.
Wednesday, March 31:
MU, WBA, AYI, NG, VRNT, PLAY, GES, SPWH
Thursday, April 1:
KMX
Economic Reports
March ADP employment report: 517,000 (actual) vs. 500,000 (estimate)
March Chicago PMI: 66.3 (actual) vs. 60.3 (estimate)
February pending home sales: -10.6% (actual) vs. -3.0% (estimate)
Happy trading!
Tom