
EB Daily Market Report - Friday, March 31, 2023
ChartLists Updated
I have updated several of our ChartLists at EarningsBeats.com. They are:
- Strong Earnings (SECL)
- Strong Future Earnings (SFECL)
- Strong AD (SADCL)
- Raised Guidance (RGCL)
- Bullish Trifecta (BTCL)
- Short Squeeze (SSCL)
I'll be working on our April Seasonality Report, which will be published over the weekend. The above ChartLists have not yet been updated on our website, but will be later this afternoon. By today's close, you should be to view/download all of these updated ChartLists.
Executive Market Summary
- Futures were higher once again, we gapped higher, and we're continuing to build on those gains
- Commodities are mixed, though crude oil ($WTIC, +1.55%) is spiking again, this time above $75 per barrel
- The 10-year treasury yield ($TNX) is down 4 basis points to 3.52%, likely reacting to the better-than-expected Core CPE reading this morning
- Leadership is favorable again as consumer discretionary (XLY, +2.11%) and communication services (XLC, +1.16%) pace today's advance
- All 11 sectors are higher, though utilities (XLU, +0.16%) are lagging noticeably
- Automobiles ($DJUSAU, +4.84%) are enjoying a solid day, led by Tesla (TSLA, +5.41%), today's best-performing S&P 500 stock
- Internet ($DJUSNS, +1.51%) is turning back up, though the group needs to clear 2500 in order to clear cup resistance; it's currently at 2442
- Intel (INTC, +2.08%) is having another strong session, leading all Dow components, and helping to lift the Dow Jones nearly 300 points
Market Outlook
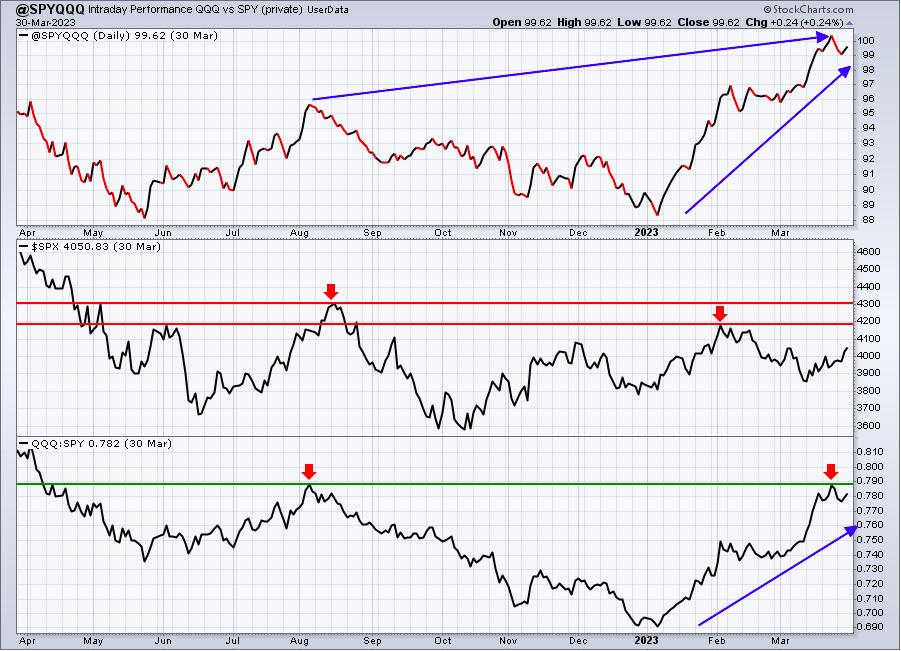
I want to give you a quick update of my two key charts that track intraday accumulation. One follows the QQQ:SPY (ignore the "@SPYQQQ" chart name, it's actually QQQ:SPY) and the other tracks the two consumer sectors, XLY:XLP:
QQQ:SPY
XLY:XLP
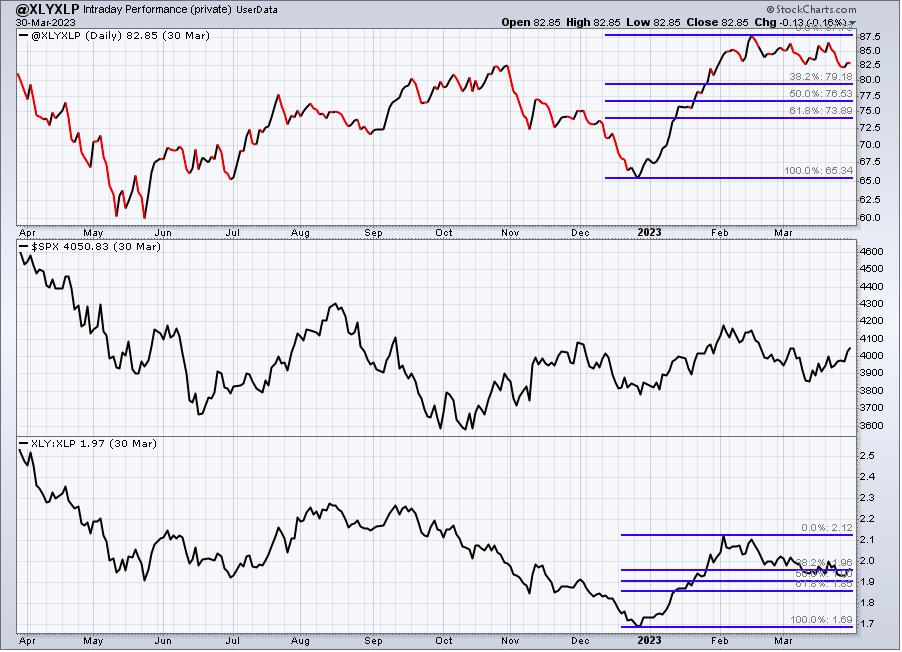
Both of these charts are absolutely supporting my theory of higher prices ahead. In the bottom chart (XLY:XLP), I've used the Fibonacci retracement tool to show you that while the XLY:XLP (includes opening gaps) has fallen back just beyond its 38.2% retracement, the intraday XLY:XLP (ignores gaps) shows much less retracement. In other words, during the trading day, the XLY vs. the XLP is holding up much, much better. The additional weakness in the bottom panel is due to GAPS - more manipulation for market makers to grab additional aggressive shares cheaper.
In the first chart, the intraday QQQ:SPY is WAY ABOVE where it was in August last year, despite the fact that overall market prices remain below that key level. To me, it illustrates the "beneath the surface" rotation that's been taking place since August as Wall Street takes full advantage of those that were willing to sell with all the negative headlines.
I was bullish then and I'm bullish now.
Sector/Industry Focus
Media agencies ($DJUSAV) is having a nice day today, helping to lead the communication services (XLC) sector higher. We haven't seen a breakout yet, though, in the DJUSAV, similar to the DJUSNS. When these two industries break out, I believe we'll see another big surge in the XLC on an absolute and relative basis:
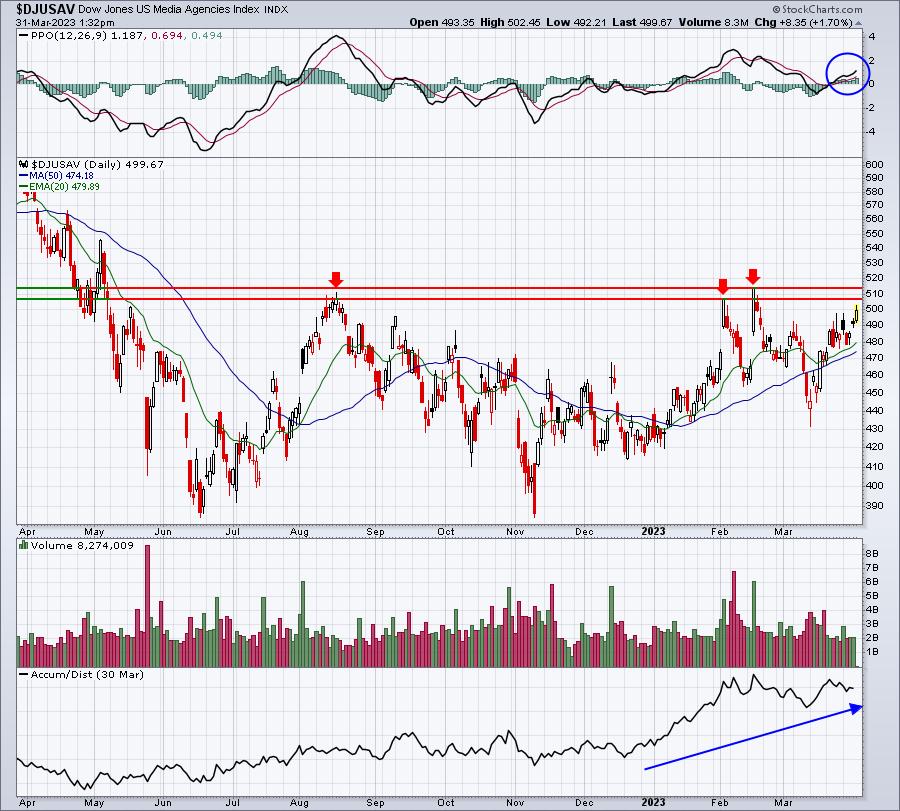
The PPO is turning up nicely from its centerline and the AD line suggests this group has been heavily accumulated by institutions. The only thing left, technically, is the breakout above the 505-515 range.
ChartLists/Strategies
Here's another breakout from a head & shoulders pattern (and from our Strong Earnings ChartList), clearing neckline resistance on heavier-than-normal volume (on pace to surpass 50-day SMA volume):
NOW:
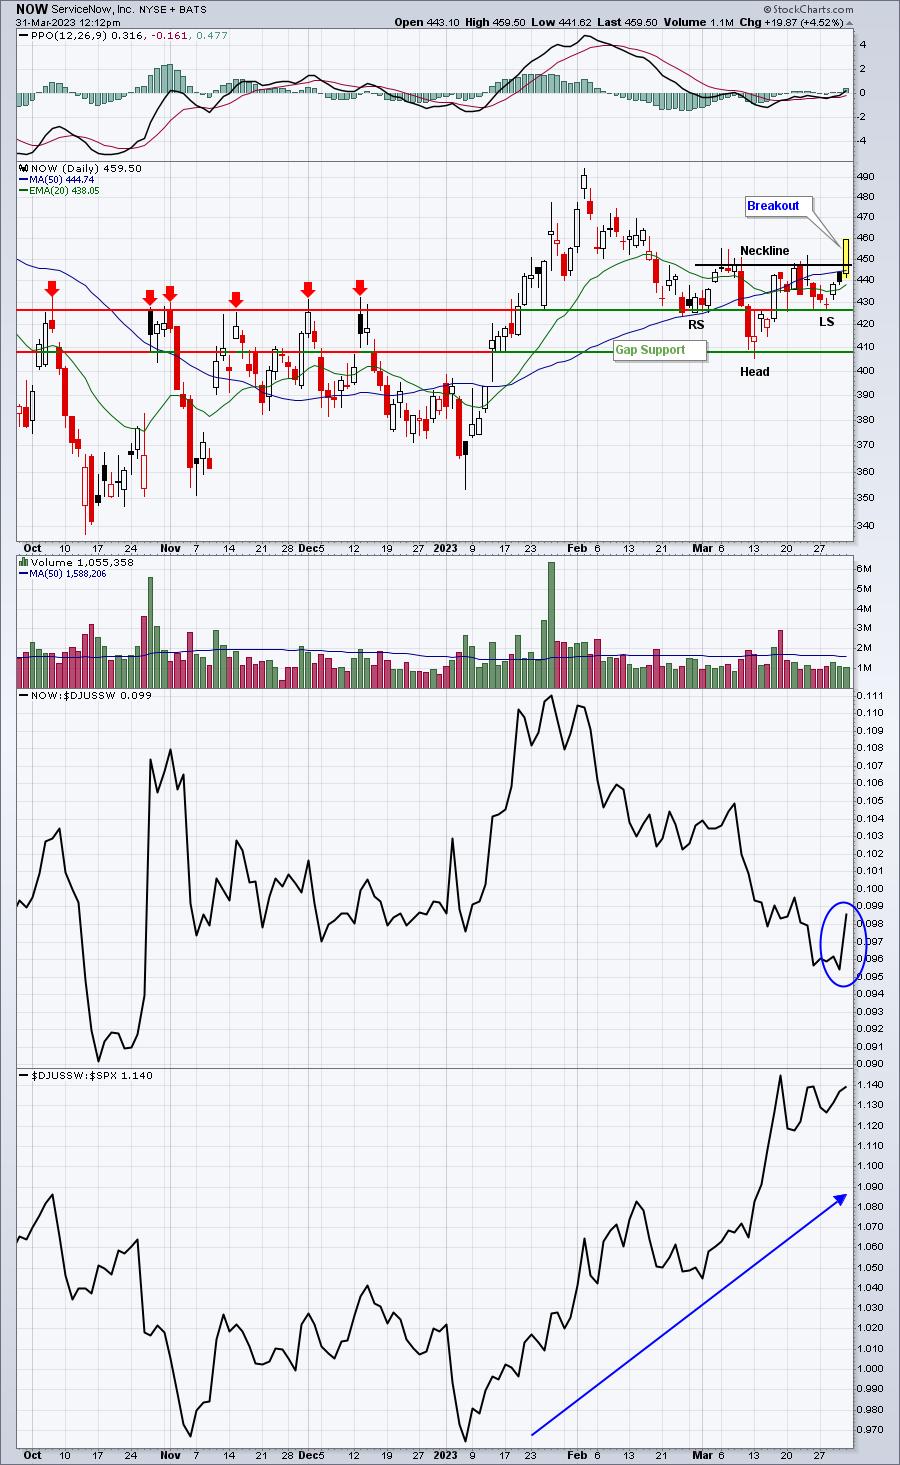
I just wrote an article over at StockCharts.com in my Trading Places blog. I featured AMZN, which I discussed in yesterday's DMR, and NOW, which looks very bullish - assuming today's intraday breakout holds into the close. My blog article can be found HERE.
Earnings Reports
Here are the key earnings reports for the next two days, featuring stocks with market caps of more than $10 billion. I also include several companies with market caps below $10 billion. Finally, any portfolio stocks that will be reporting results are highlighted in BOLD. If you decide to hold a stock into earnings, please understand the significant short-term risk that you are taking. Please be sure to check for earnings dates for any companies you own or are considering owning.
Friday, March 31:
None
Monday, April 3:
SAIC
Economic Reports
February personal income: +0.3% (actual) vs. +0.3% (estimate)
February personal spending: +0.2% (actual) vs. +0.2% (estimate)
February Core PCE price index: +0.3% (actual) vs. +0.4% (estimate)
March Chicago PMI: 43.8 (actual) vs. 43.9 (estimate)
March consumer sentiment: 62.0 (actual) vs. 63.4 (estimate)
Happy trading!
Tom