
EB Daily Market Report - Friday, April 28, 2023
Executive Market Summary
- Futures were lower overnight, but buyers quickly stepped in and our major indices have been in positive territory most of the day
- The 10-year treasury yield ($TNX) quickly reversed and gave back yesterday's rise; the TNX is down 9 basis points today to 3.44%
- Crude oil ($WTIC, +2.64%) is rebounding strongly and currently approaching $77 per barrel
- Energy (XLE, +1.62%) is bouncing, thanks to the rise in crude prices
- Financials (XLF, +1.01%) and materials (XLB, +0.92%) are also having strong sessions
- Meanwhile, consumer stocks are struggling somewhat today, with both staples (XLP, +0.22%) and discretionary (XLY, +0.13%) trailing the benchmark S&P 500
- Broadline retailers ($DJUSRB, -2.90%), leaders of late, are stumbling today as Wall Street reacts to Amazon.com's (AMZN, -3.54%) quarterly earnings report
- First Republic Bank San Francisco (FRC, -38.21%) is again under immense selling pressure; the stock is now down roughly 75% over the past 4 trading days - since it reported customer deposits had fallen much more quickly than anticipated
Market Outlook
We're pausing on the QQQ right at critical short-term overhead price resistance. Here's the chart that I showed yesterday:
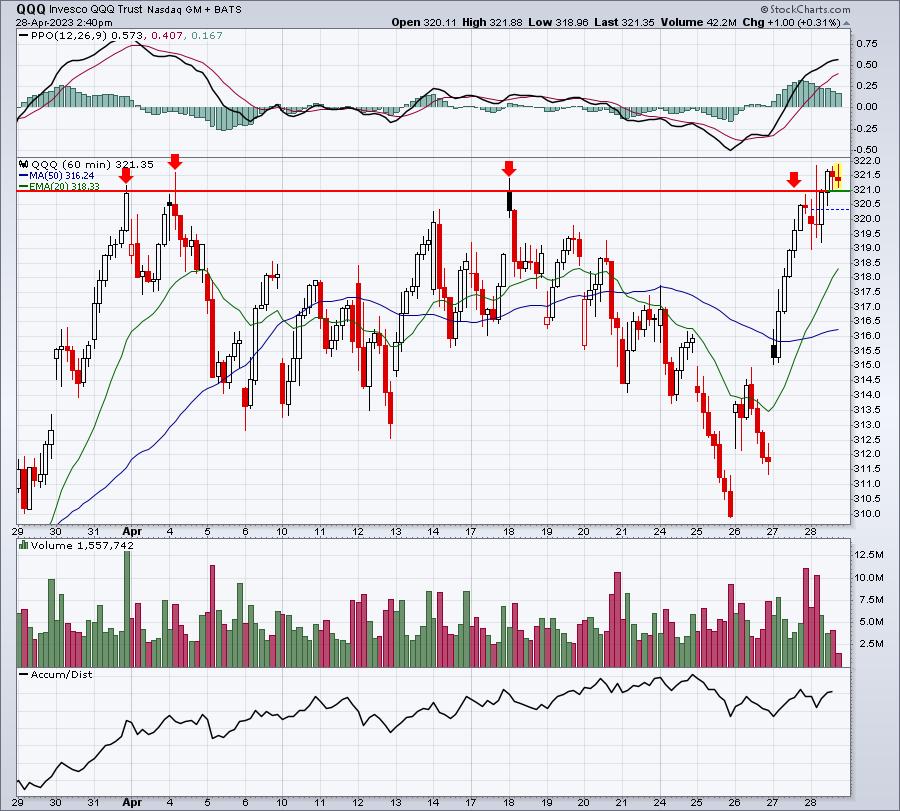
We're doing more than just quickly touching this resistance level this time. We've been trading at or above it most of the day. We need to see how we finish today, but if it's strong, then I'd look for further strength in the days ahead. It's helping that semiconductors ($DJUSSC) are strong today after printing that hammer yesterday. Now the big question short-term is.....can we clear the 20-day EMA?
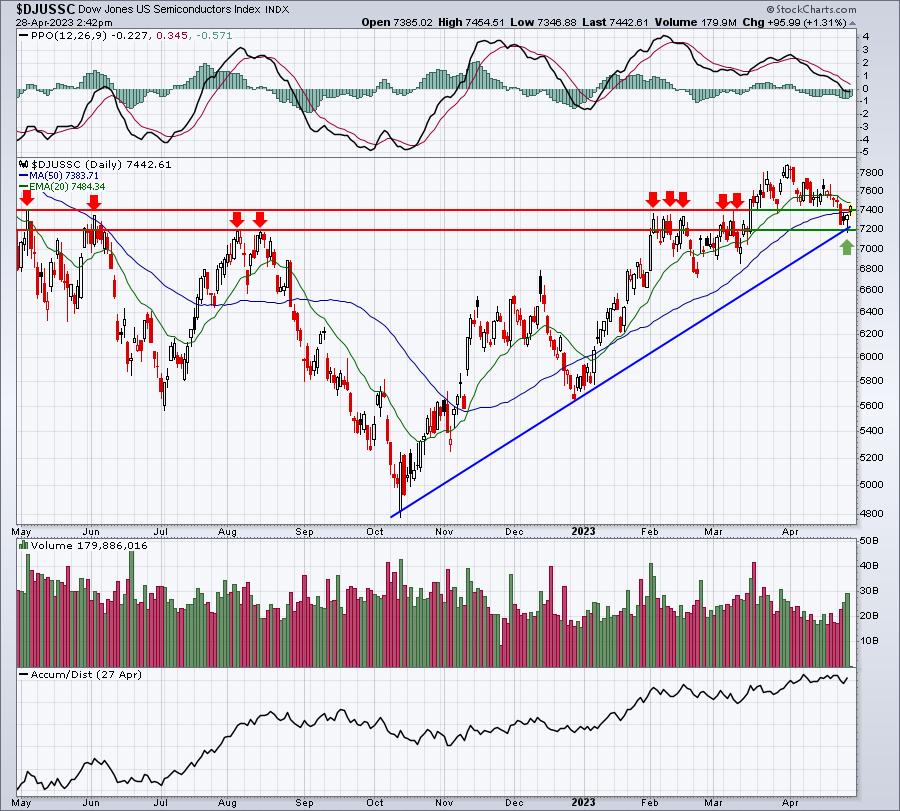
It's bullish to see the move back up and out of the key 7200-7400 support level. I actually took a small leveraged position in semis today. SOXL is the 3x ETF that tracks the ICE Semiconductor Index. This is a Direxion ETF and has a Top 10 Holdings that looks like this:
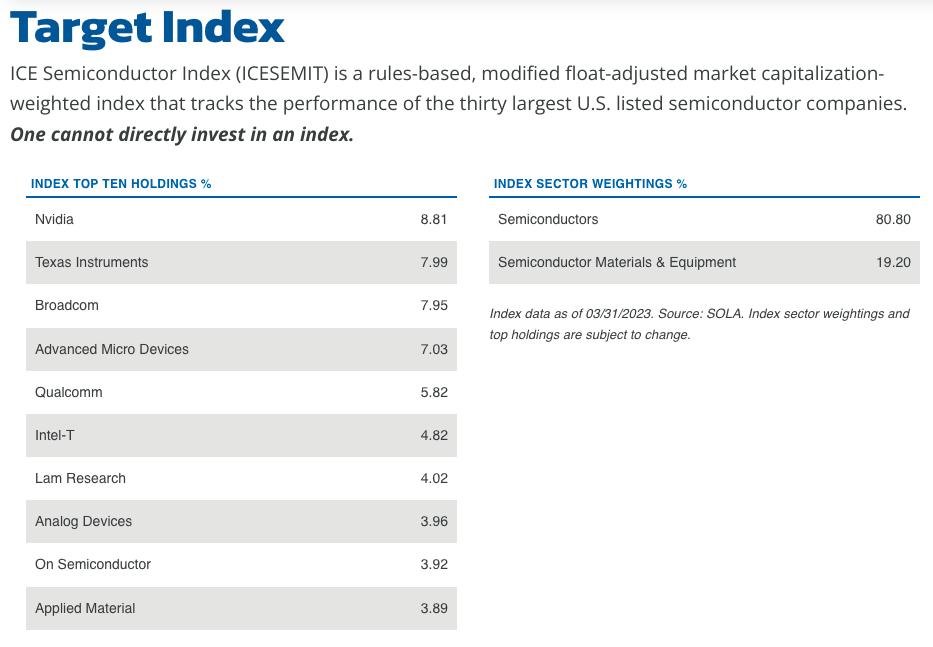
The Top 5 represent approximately 37-38% of the entire ETF and I really liked the 5 charts, which is shown in the next section.
Sector/Industry Focus
I always pay much attention to what's going on with semiconductors, because they have such a heavy influence on our major indices, especially the NASDAQ 100 ($NDX or QQQ is the ETF equivalent). As I mentioned above, I moved into SOXL, the 3x leveraged ETF that tracks semiconductors. Here are the Top 5 charts of the companies with the most representation in this index:
NVDA:
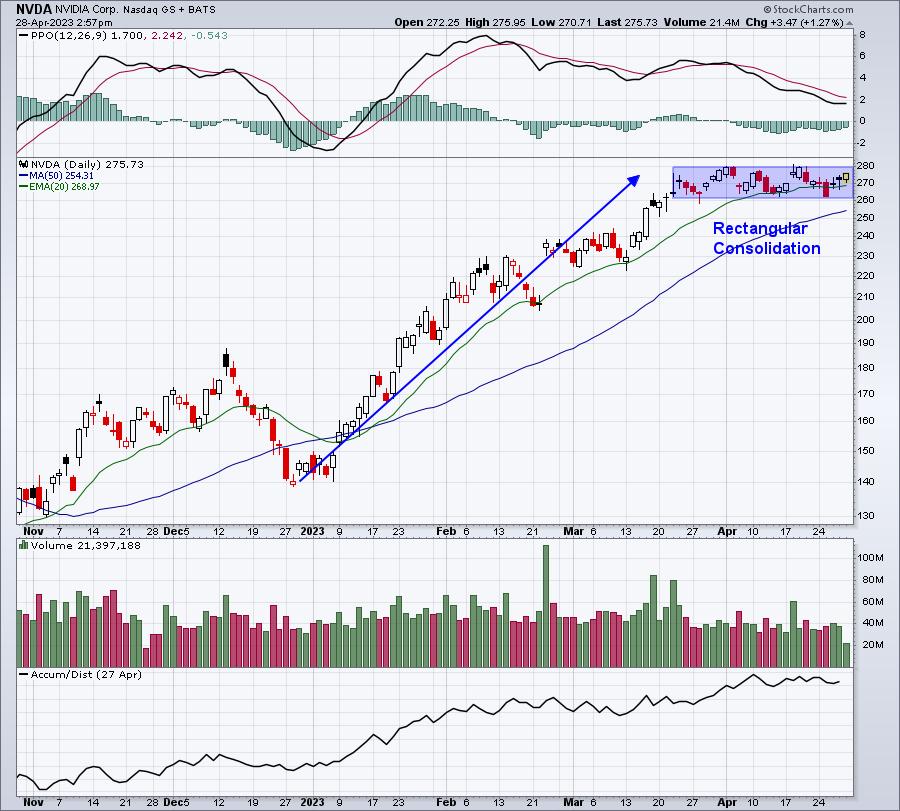
This is a very bullish continuation pattern with recent highs near 280 and lows near 260. My expectation would be a breakout to the upside coming out of this rectangular consolidation (or bull flag) pattern.
TXN:
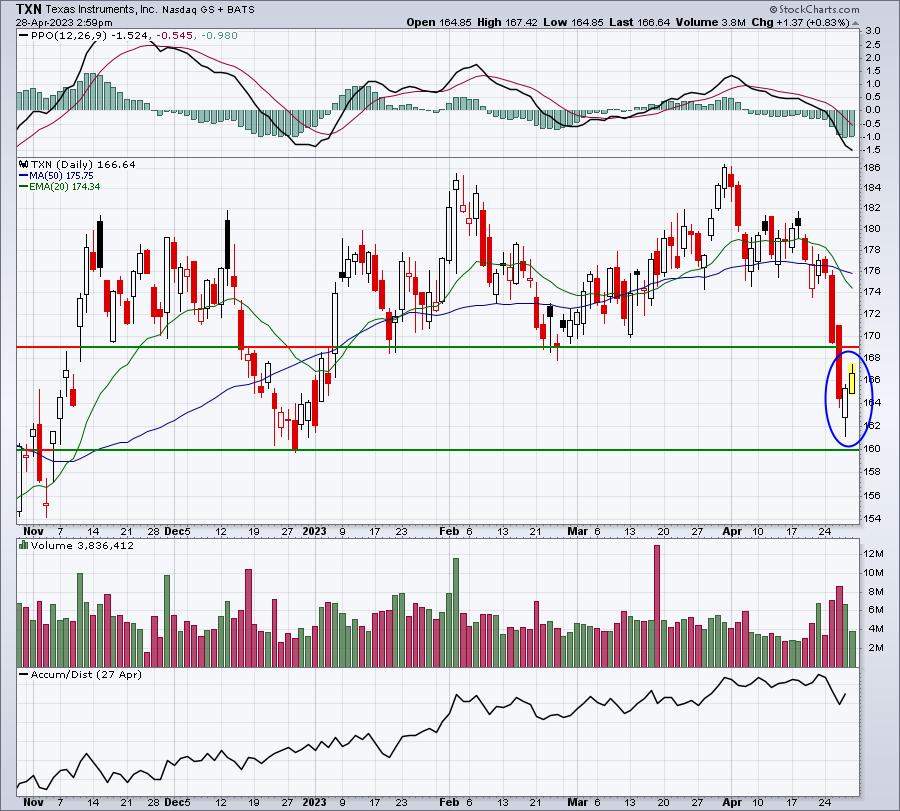
I like the reversal here as it neared key price support at 160. If TXN can clear the short-term price resistance at 169, an upcoming 20-day EMA test becomes much more likely. The AD line here remains excellent.
AVGO:
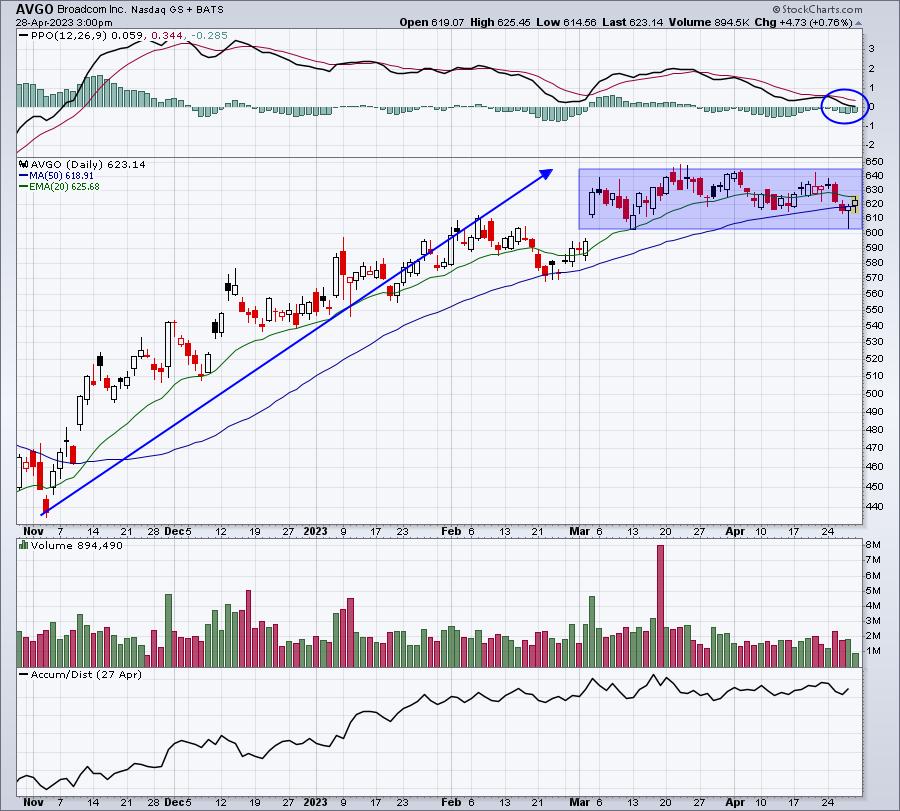
Looks similar to NVDA. Bounced yesterday off rectangular consolidation support. The AD line here is strong as well. I'm looking for a breakout.
AMD:
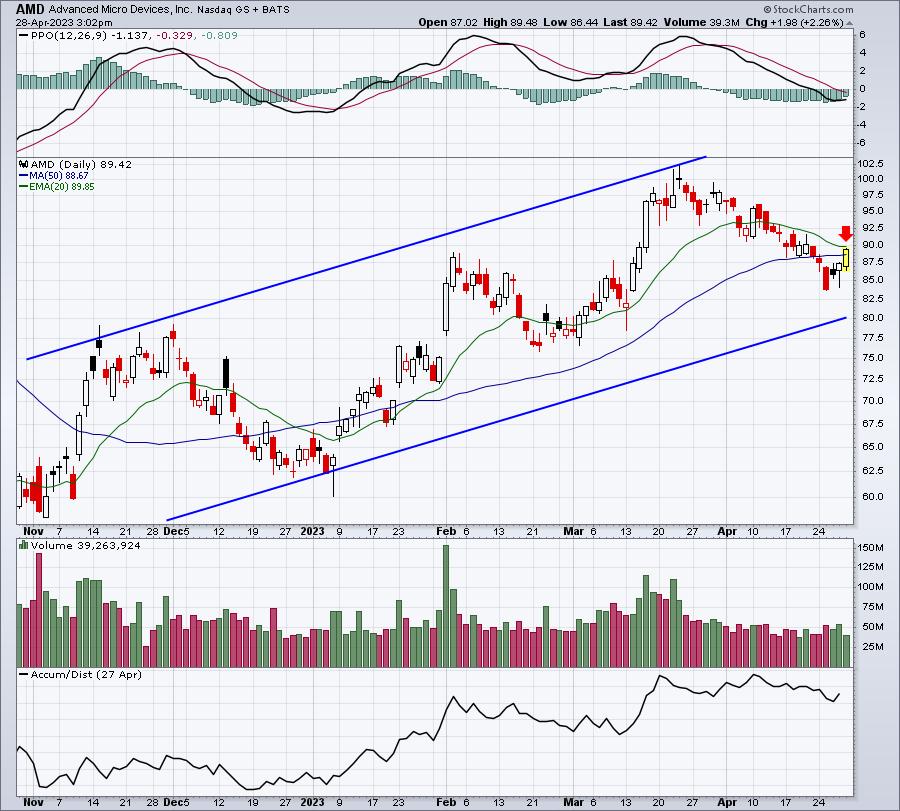
AMD remains in a bullish up channel and appears to be turning up again. A close above the 20-day EMA would likely confirm it. AD line on AMD is very strong, climbing right along with price.
QCOM:
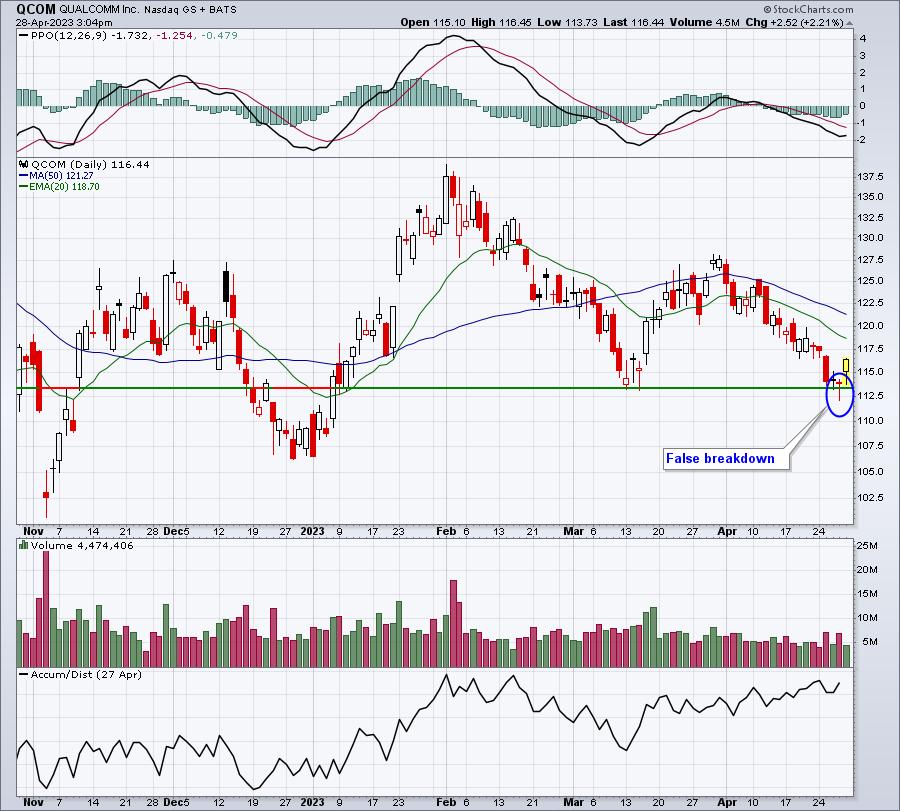
QCOM printed a reversing doji candlestick at key price support. Note the false breakdown - I love to see those. Today, QCOM is rebounded strongly and it, too, has an excellent AD line.
First, it's important to note that I remain extremely bullish in the days and weeks ahead. Also, history tells me that the semiconductors lead such secular bull market advances. Therefore, taking a chance on the SOXL when it reverses at key support with its top component stocks looking bullish as well makes a lot of sense. Is there risk? Of course. Semiconductors are very aggressive and can move quickly in both directions. But we're at a key 7200-7400 support level, which provides me the confidence to enter the trade. Also, the reward to risk doesn't get much better than this.
ChartLists/Strategies
I've had several members ask for an update on Crocs, Inc. (CROX) after a very rough day yesterday, post-earnings. First, let me be clear that our position on Portfolio stocks is to hold them for 90 days, until we re-evaluate the market and the market leaders and restock our portfolios. We employ mostly a buy-and-hold strategy with our portfolios, but only for 90 days. Using stops, taking profits, and those types of strategies are trading strategies. There's nothing wrong with using those strategies as a trader. However, we hold these in our portfolios for the entire period. Some of our portfolio stocks will do very well after earnings (eg, META, FCFS) and others may tumble (eg, CROX, MSCI). Over time, we believe that poor reactions will be offset by strong reactions. Sometimes, however, bad luck takes over and we have more than our fair share of disappointments. We live with them and move on.
From a trading perspective, I personally wouldn't give up just yet on CROX. Remember, this is a stock that ran from 110 to 150 in the month before earnings (buy on rumor). CROX reported revenues and EPS that blew away Wall Street consensus estimates (EPS: 2.61 vs. 2.15). Earnings reactions can be quite painful. Just last week, CDNS reported great results, tumbled 10% after earnings and now, four days later, is almost back to where it was before earnings were released.
My experience has been to stick with leaders, especially those leaders that report better-than-expected results. Had CROX simply moved from 110 to 120 prior to earnings and was currently trading at 124, there'd be no issue. It's the volatility and psychological component of trading that market makers feast on, knowing that traders overreact in the short-term to everything. I use relative strength to help me determine which companies the big Wall Street firms are favoring. They tend to be great investments, but not always great short-term trades. It's all about perspective and where you entered.
Anyway, here's my latest take on CROX:
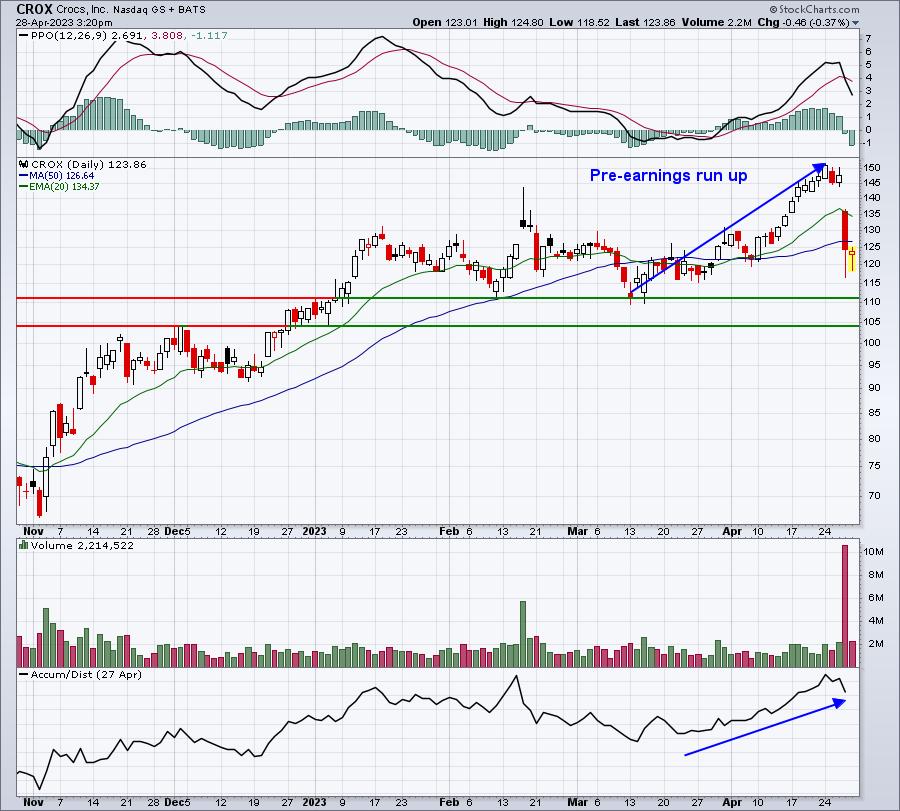
I still like CROX a lot, but I'd like it better when its price moves back above both its 50-day SMA and its 20-day EMA. To the downside, I've annotated the two key levels of price support I'd be most interested in.
Earnings Reports
Here are the key earnings reports for the next two days, featuring stocks with market caps of more than $10 billion. I also include several companies with market caps below $10 billion. Finally, any portfolio stocks that will be reporting results are highlighted in BOLD. If you decide to hold a stock into earnings, please understand the significant short-term risk that you are taking. Please be sure to check for earnings dates for any companies you own or are considering owning.
Friday, April 28:
XOM, CVX, SONY, AON, CL, CHTR, TRP, IMO, LYB, ARES, WPC, AVTR, CCJ, SAIA, NVT, GNTX, GTLS, NWL, POR, LAZ, CRI, JKS, DAN, BLMN
Monday, May 1:
SYK, VRTX, ANET, NXPI, VICI, ON, WEC, GPN, SBAC, FANG, HOLX, INVH, SYM, RE, MBM, CHKP, FMC, CF, BEN, LSCC, SCI, CNA, LOGI, ZI, KBR, CAR, BRX, CACC, SON, WWD, AMKR, SOFI, NCLH, SGRY, RMBS, AL, FLS, RIG, SFM, MSTR, TEX, AXNX, VNO, TMDX, VRNS, CHGG, KMT
Economic Reports
March personal income: +0.3% (actual) vs. +0.2% (estimate)
March personal spending: +0.0% (actual) vs. +0.0% (estimate)
March PCE price index: +0.1% (actual) vs. +0.1% (estimate)
Q1 employment cost index: +1.2% (actual) vs. +1.0% (estimate)
April Chicago PMI: 48.6 (actual) vs. 43.5 (estimate)
April consumer sentiment: 63.5 (actual) vs. 63.5 (estimate)
Happy trading!
Tom