
EB Daily Market Report - Friday, May 29, 2020
Executive Market Summary
- Futures were lackluster overnight and the Dow Jones is seeing some profit taking today
- The NASDAQ is showing relative strength and is higher
- Meanwhile, small caps ($SML) and mid caps ($MID) are the worst two key indices
- Technology (XLK, +0.37%) is the only sector in positive territory, while energy (XLE, -1.75%) is weak
- Crude oil prices ($WTIC) are down just fractionally and the U.S. Dollar (UUP) is down slightly, so the poor performance in the XLE could simply be profit taking after its recent rally
- Veeva Systems (VEEV, +5.28%) and Okta, Inc. (OKTA, +4.39%) reported solid results in the software group
- Salesforce.com (CRM, -5.33%) remains a relative laggard in software following its quarterly report
Market Outlook
Let's discuss key areas of price support on the benchmark S&P 500. We've seen a tremendous rebound off the March lows, so it might be a great time to look at what levels we could see if a period of selling were to hit:
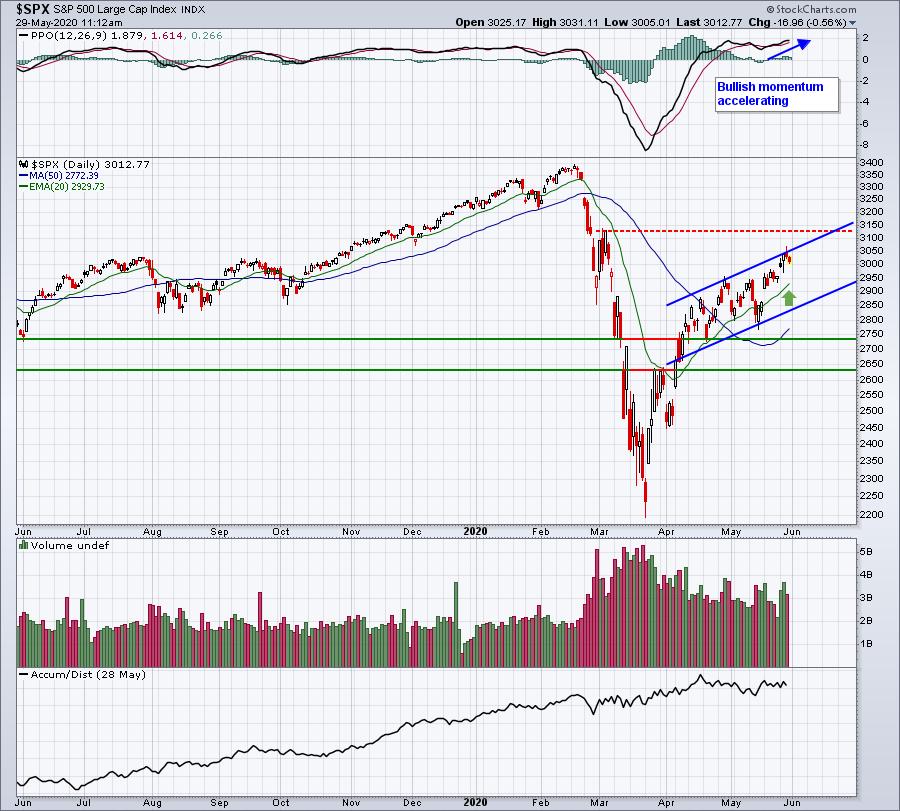
Using my most bullish forecast, I'd view a 20 day EMA test and/or a channel support test as the most downside we'll likely see. But if you want to take a slightly less optimistic view, then consider the two horizontal price support lines that I've drawn.
Sector/Industry Focus
We've recently seen both financials (XLF) and industrials (XLI) join the party and break out above April highs. Unfortunately, real estate (XLRE) is still mired beneath its April high. Until that price resistance is cleared, I doubt we'll see any relative strength here:
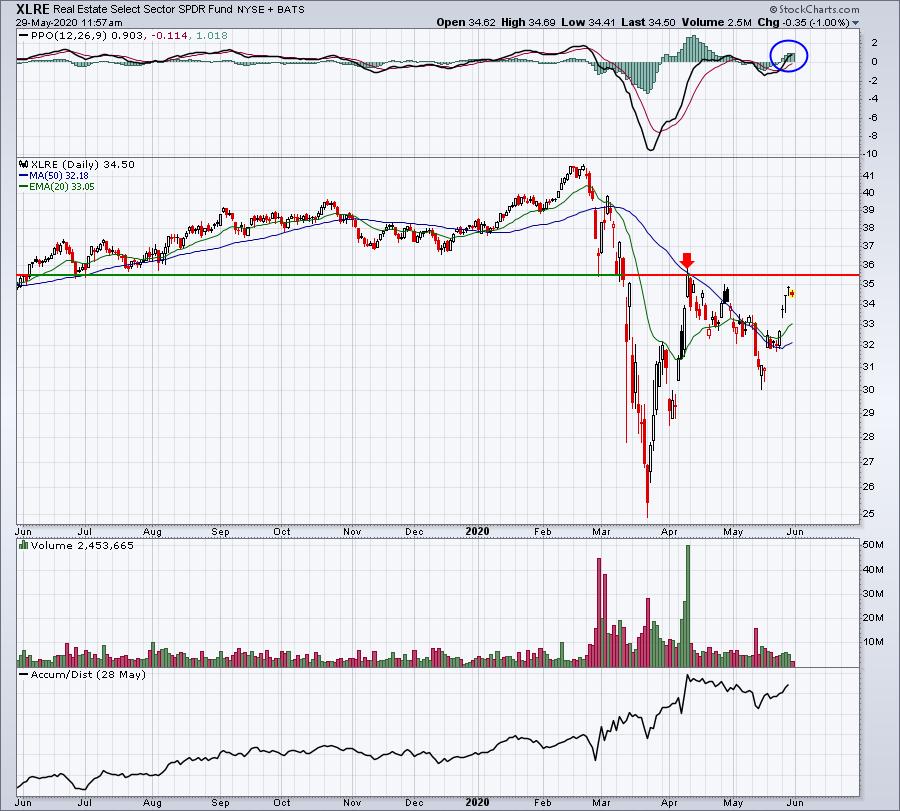
The PPO has crossed centerline resistance (blue circle), which suggests increasing bullish momentum. But we still need to see that breakout above the early-April price reaction high near 35.50. A close above that resistance level would likely trigger technical buying.
ChartLists
I reviewed our Strong Earnings ChartList and found a handful of interesting chart that I wanted to share:
ABT:
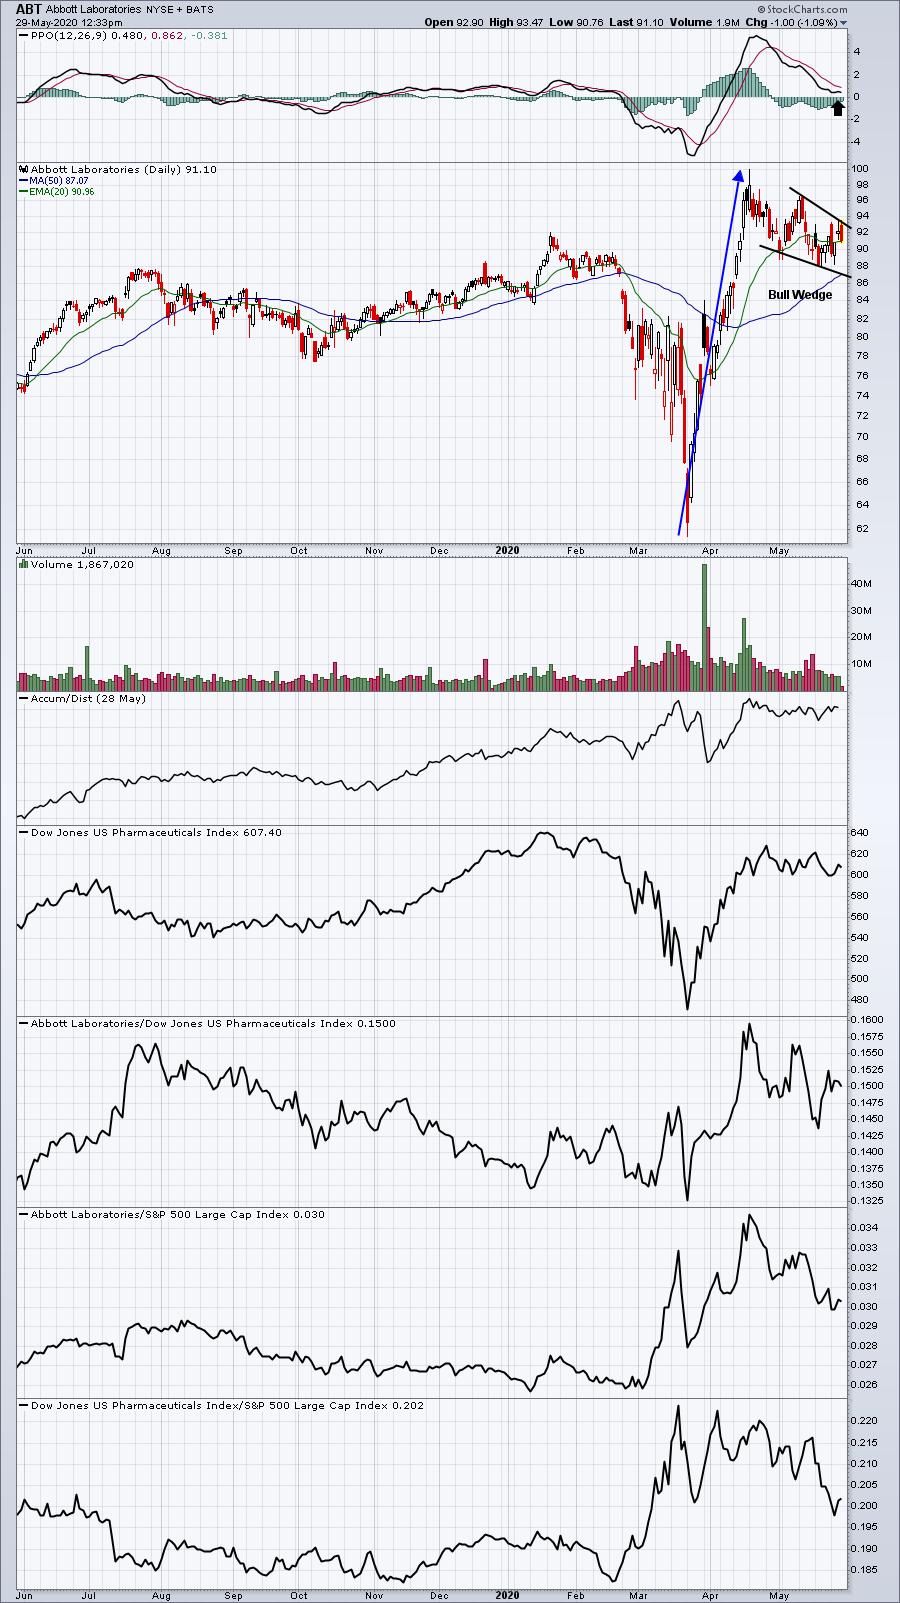
After an extended advance, ABT is pausing in a bull wedge pattern. As it moves closer and closer to 87-88, the reward to risk gets stronger and stronger. Building a position from the current level down to 87 with a tight stop underneath makes technical sense.
LMT:
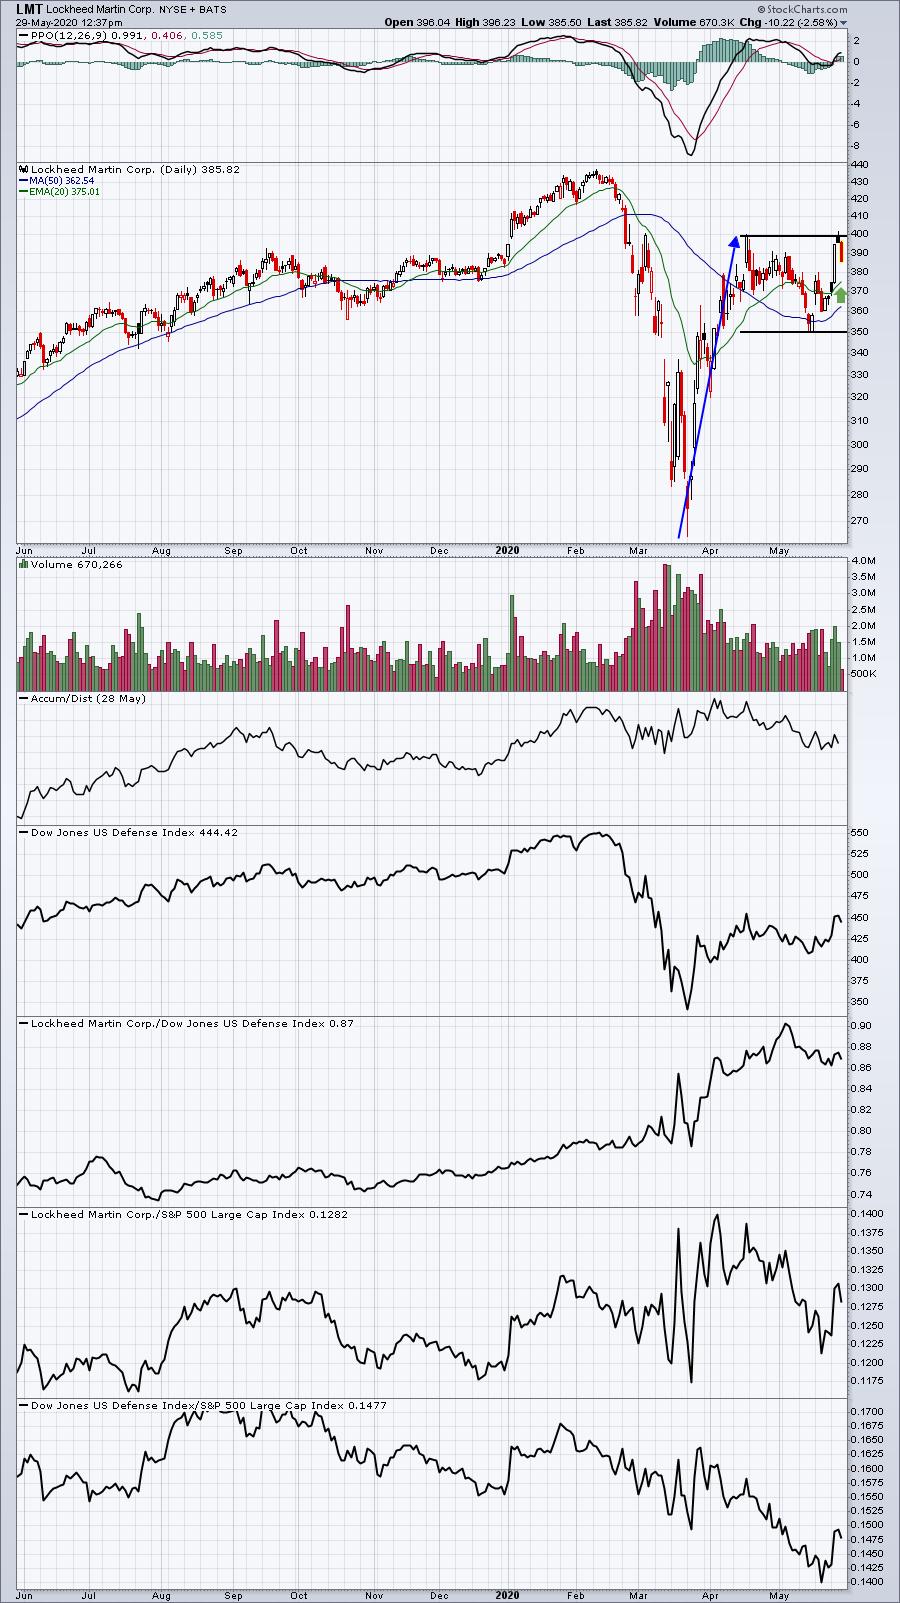
LMT is one of the leading defense stocks. It was unable to make the breakout at 400 to clear April's high, but I wouldn't give up on it just yet. The rising 20 day EMA could represent a turning point for LMT. If not, I fully expect the 350 support level to hold, should we get there.
SLGN:
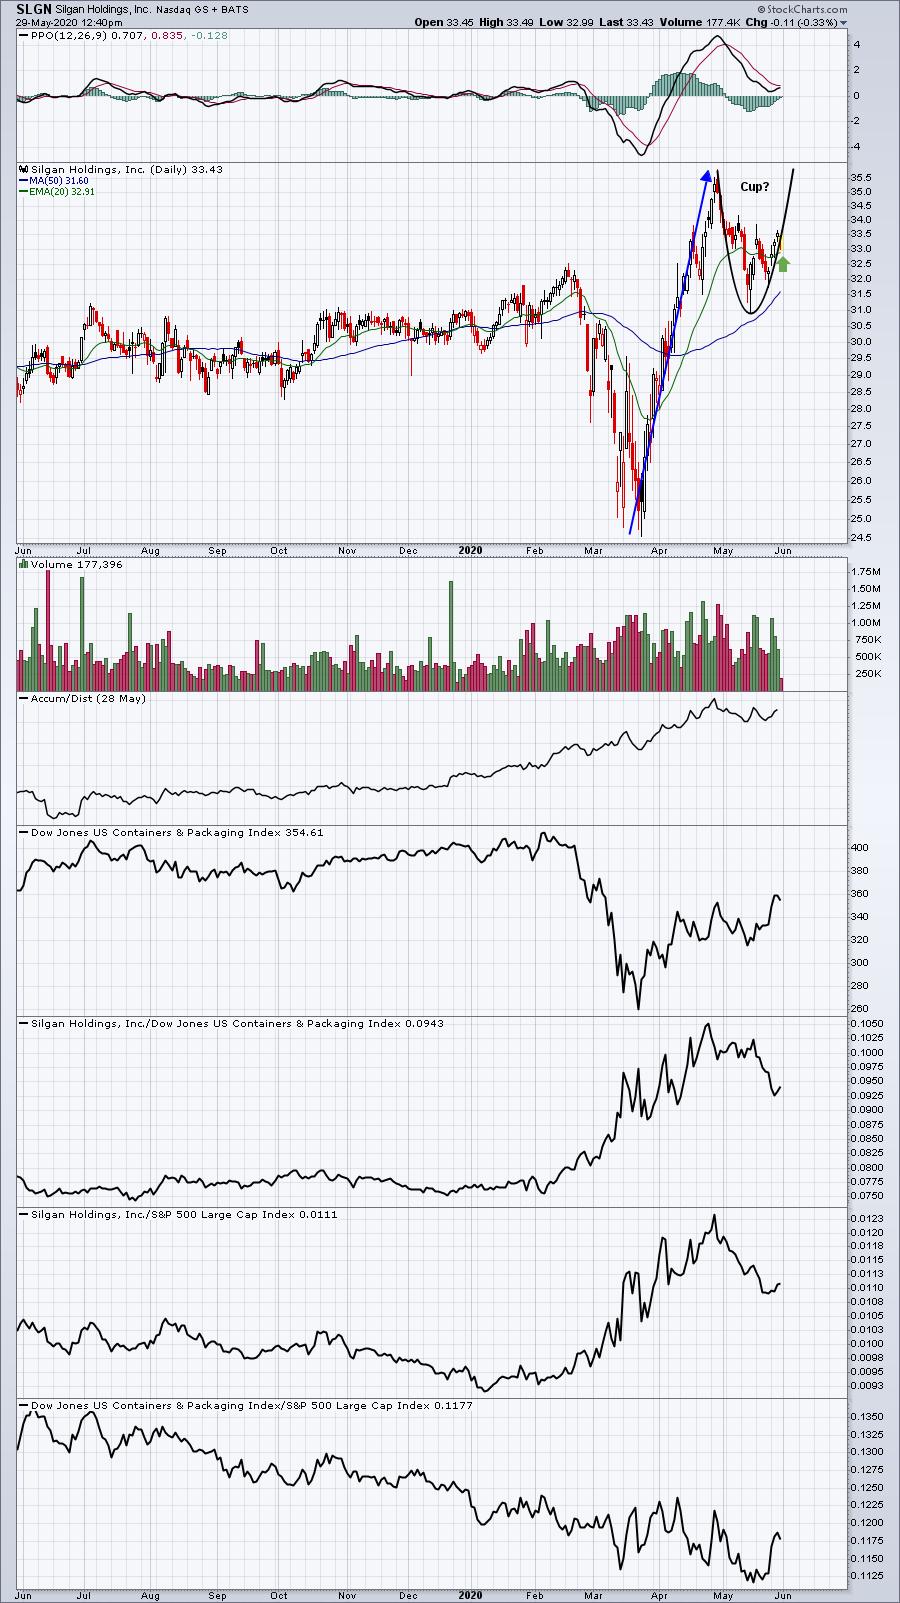
I like that SLGN's PPO has returned to centerline support during this period of selling/consolidation. I wouldn't be surprised to see the recent strength continue until the right side of a cup prints. In the very near-term, keep an eye on that rising 20 day EMA. That may be the key support for awhile.
XLNX:
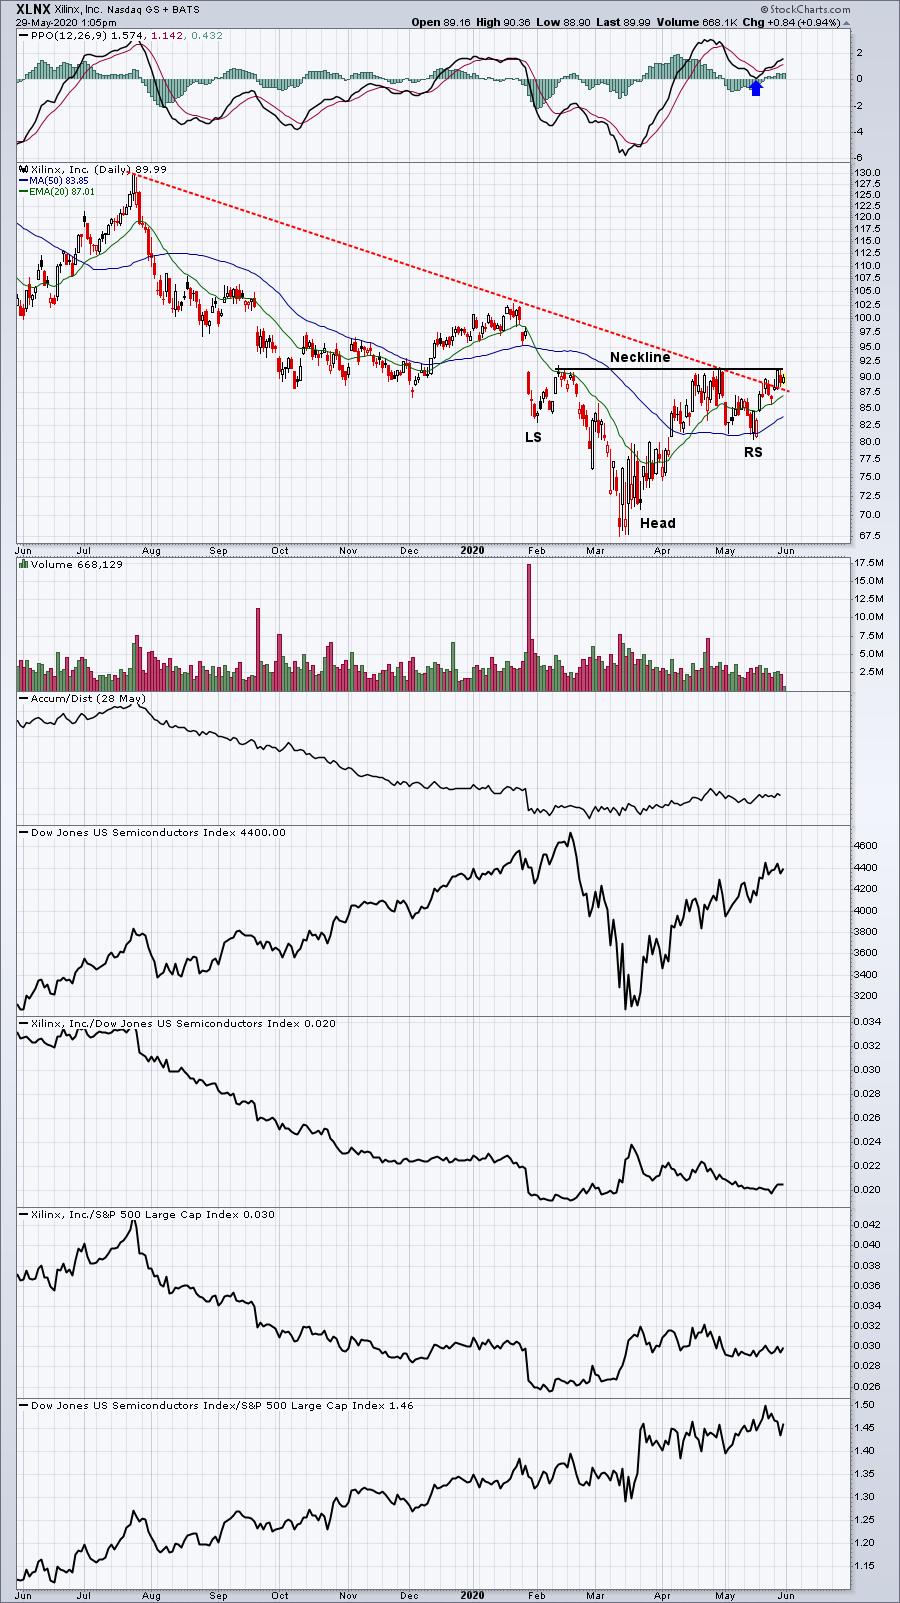
XLNX is showing signs of a potential bottom, namely in the form of a bottoming reverse head & shoulders pattern. A heavy volume burst through neckline resistance at 91.30 is what I'll be looking for in a possible bottom confirmation. Note the PPO held centerline support on the last bout of selling in XLNX - a positive development. I still want to see this breakout before I'd be interested, however.
SGEN:
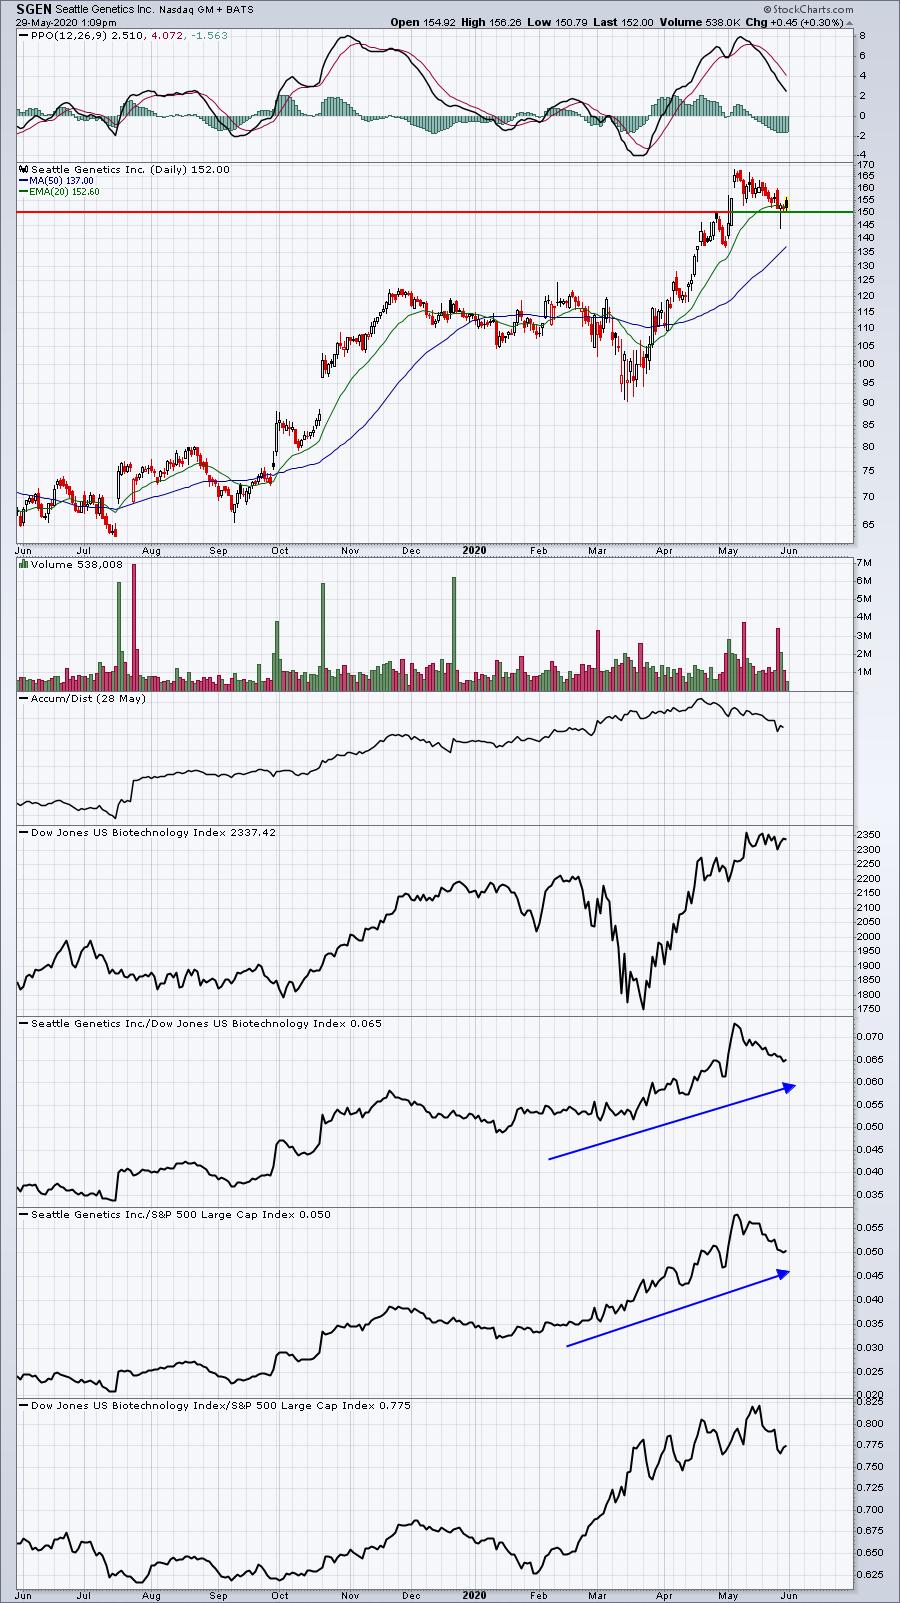
SGEN has been one of the best biotech stocks in 2020, and while the group is currently consolidating, I'd look to short-term weakness as an opportunity to build a position in one of industry's best component stocks.
Earnings Reports
Here are the key earnings reports for today and tomorrow, featuring stocks with market caps of more than $10 billion. I also include a few select companies with market caps below $10 billion. Finally, any portfolio stocks (or active trade alerts) that will be reporting results are highlighted in BOLD. If you decide to hold a stock into earnings, please understand the significant short-term risk that you are taking. Please be sure to check for earnings dates for any companies you own or are considering owning:
Friday, May 29:
CGC, BIG
Monday, June 1:
ATHM, ENS
Economic Reports
April personal income: 10.5% (actual) vs. -6.0% (estimate)
April personal spending: -13.6% (actual) vs. -12.6% (estimate)
May Chicago PMI: 32.3 (actual) vs. 40.0 (estimate)
May consumer sentiment: 72.3 (actual) vs. 74.0 (estimate)
Happy trading!
Tom