
EB Daily Market Report - Tuesday, June 30, 2020
Executive Market Summary
- U.S. equities were mixed at the open and they're still mixed
- NASDAQ shares are outperforming, while the Dow Jones is flat
- Gold ($GOLD) has gained nearly 1% and is rapidly approaching $1800 per ounce in more than seven years
- The 10 year treasury yield ($TNX) is trying to reverse its recent downtrend, rising 3 basis points to 0.66%
- Micron Technology (MU, +4.59%) beats forecasts and raises guidance; Xilinx (XLNX) raises revenue guidance; semiconductors ($DJUSSC, +2.39%) are strong
- Technology (XLK, +1.16%), energy (XLE, +1.14%), and health care (XLV, +1.06%) are today's leading sectors
- All 11 sectors are higher, but utilities (XLU, +0.02%) and consumer staples (XLP, +0.09%) are the laggards
- Boeing (BA, -5.45%), yesterday's Dow Jones darling, is easily today's worst performer
- Tesla (TSLA, +6.85%) breaks out and sets new all-time high, leads automobiles ($DJUSAU, +4.95%) higher
Market Outlook
As I look ahead to July, I have mixed feelings. Historically, we've seen a pre-earnings push higher that typically lasts through July 17th. But the period July 17th through 24th is the second worst week of the year, trailing only the October 21st through October 27th period. July 17th also kicks off what I would label the "Go Away In" period, which stretches from July 17th to September 27th. This 10 week period has produced annualized returns of roughly -2.5% on the S&P 500 over the past 7 decades. So there's clearly some truth to the summertime stock market weakness theory.
Below is a seasonal chart for the S&P 500 over the past 20 years:
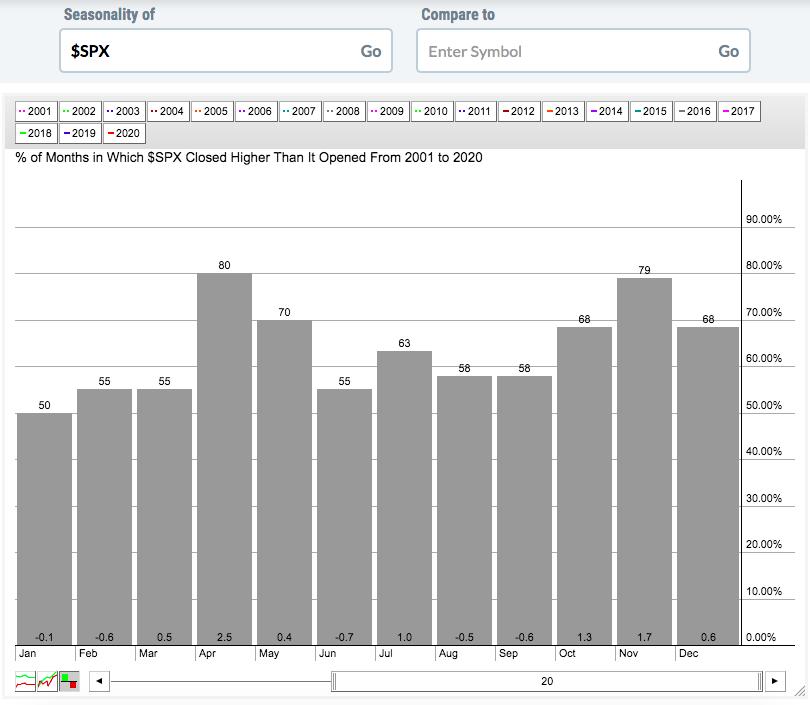
While July shows a modest 1% average gain, keep in mind that the first half of July is much, much better than the 2nd half. And note that both August and September show average monthly losses this century. Based on my view of the market and the seasonality chart above, if we do see a nice earnings push higher the next couple weeks, I'd be prepared to let off the gas a bit as the actual earnings reports come out.
Sector/Industry Focus
Banks ($DJUSBK) are struggling to participate in this rally as the 10 year treasury yield ($TNX) continues to drift lower. The yield spread, or the difference between the 10 year treasury yield and the 2 year treasury yield ($UST10Y-$UST2Y), has been declining for the past three weeks as well. Until one or both of these reverse back to the upside, the banks are very likely to underperform. Check out this chart:
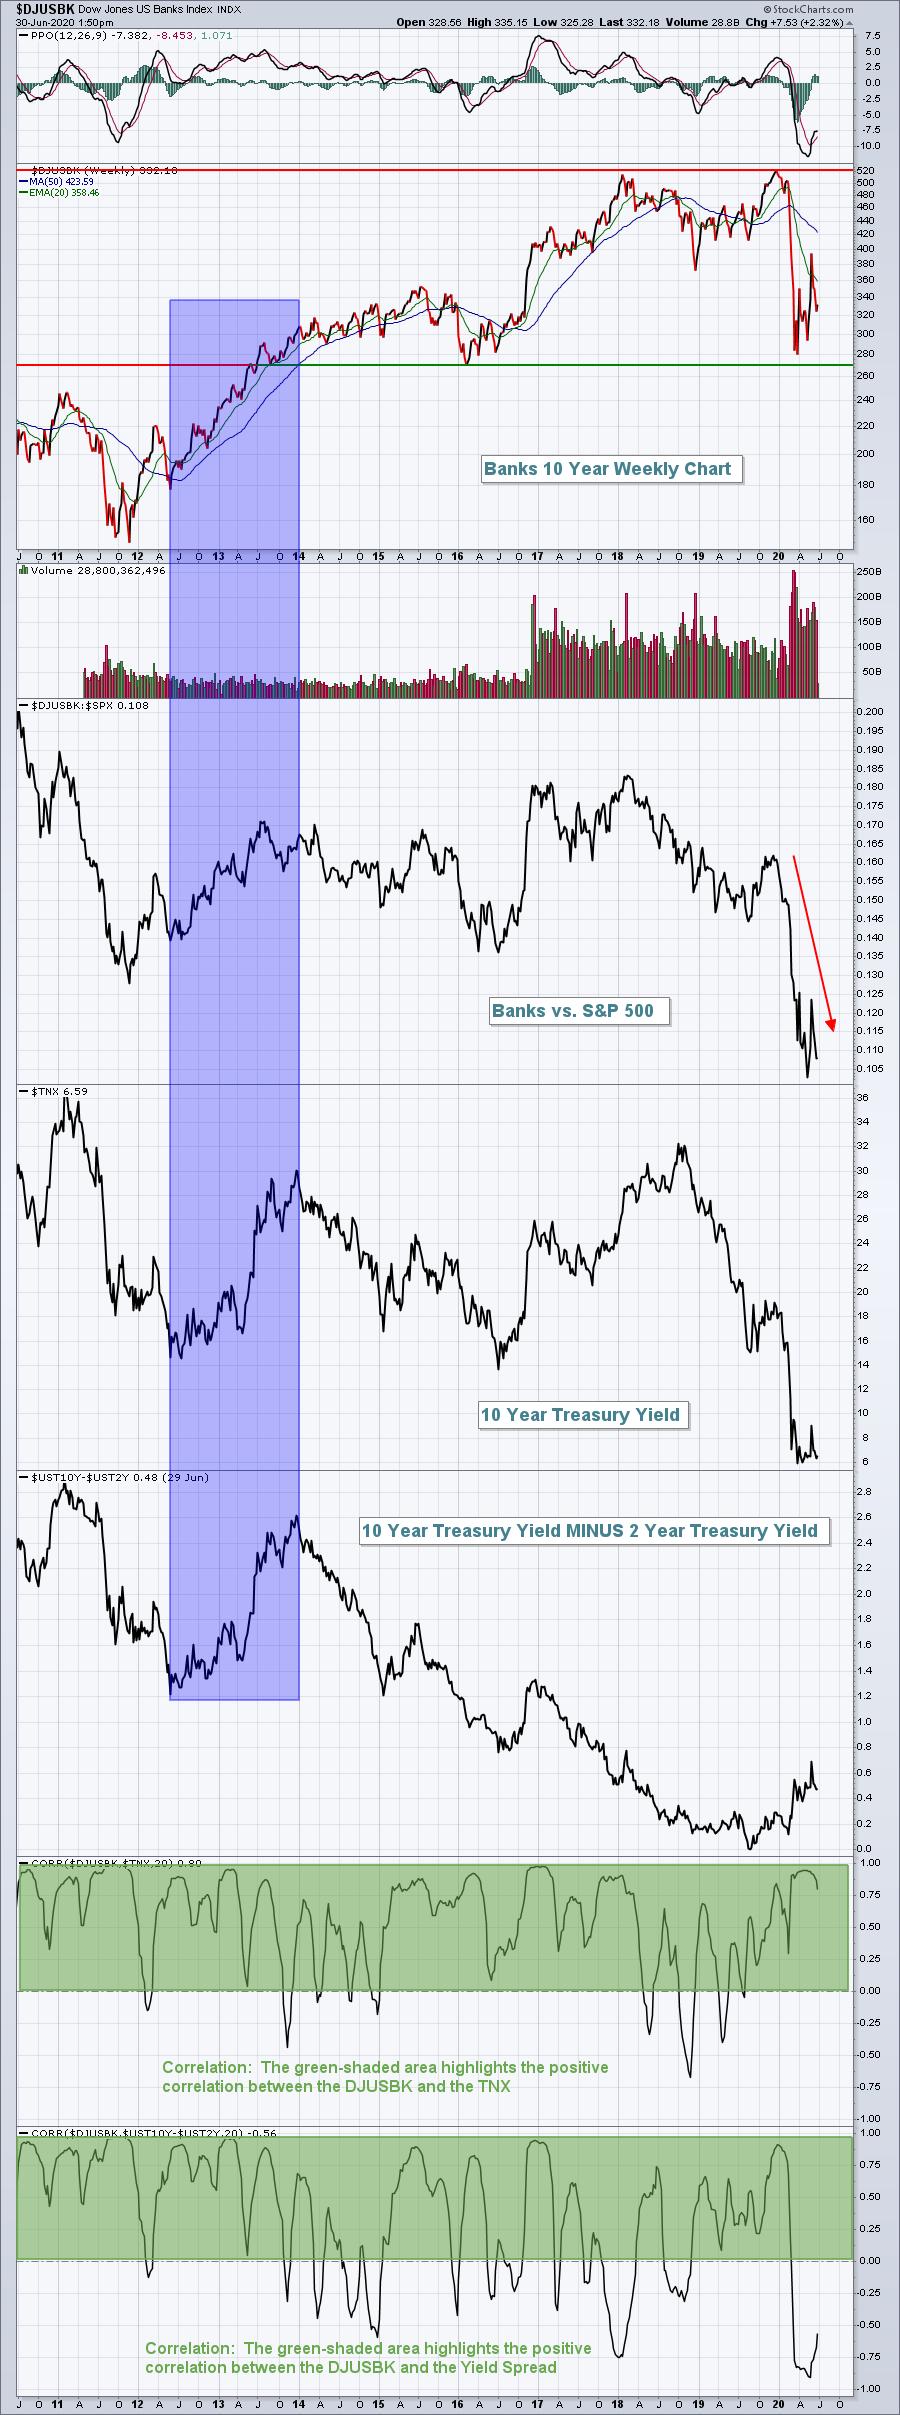
There's a lot on this chart, but it's all very important. First, note the blue-shaded area. This is the only extended period of time in the past decade where we've seen the 10 year treasury yield trending higher, along with a rising yield spread. That also coincided with one of the strongest periods for banks throughout the past decade. The bottom two panels show the positive correlation between bank performance and (1) the TNX and (2) the yield spread. As we look at the relative weakness in banks in 2020, note that its directional move lower is following the TNX. The yield spread, however, has mostly been rising and that's resulted in inverse (or negative) correlation between banks and the yield spread. Why? Well, it most likely has to do with a non-interest related matter - loan loss reserves that have been increased significantly to account for bad loans as a result of the COVID-19 pandemic. When the bond market truly believes in a strong economic rally ahead AND worries a bit more about inflation, that's when we'll see the TNX begin to rise. Unfortunately, until that happens, I'd expect no better than average performance from banks.
ChartLists
I ran the Downtrend Reversal scan from our website and uncovered the following stocks:
From the Strong Earnings ChartList (SECL) - BYND, INTC, NOMD, RRC, SHW, VIPS. The one I like here is BYND:
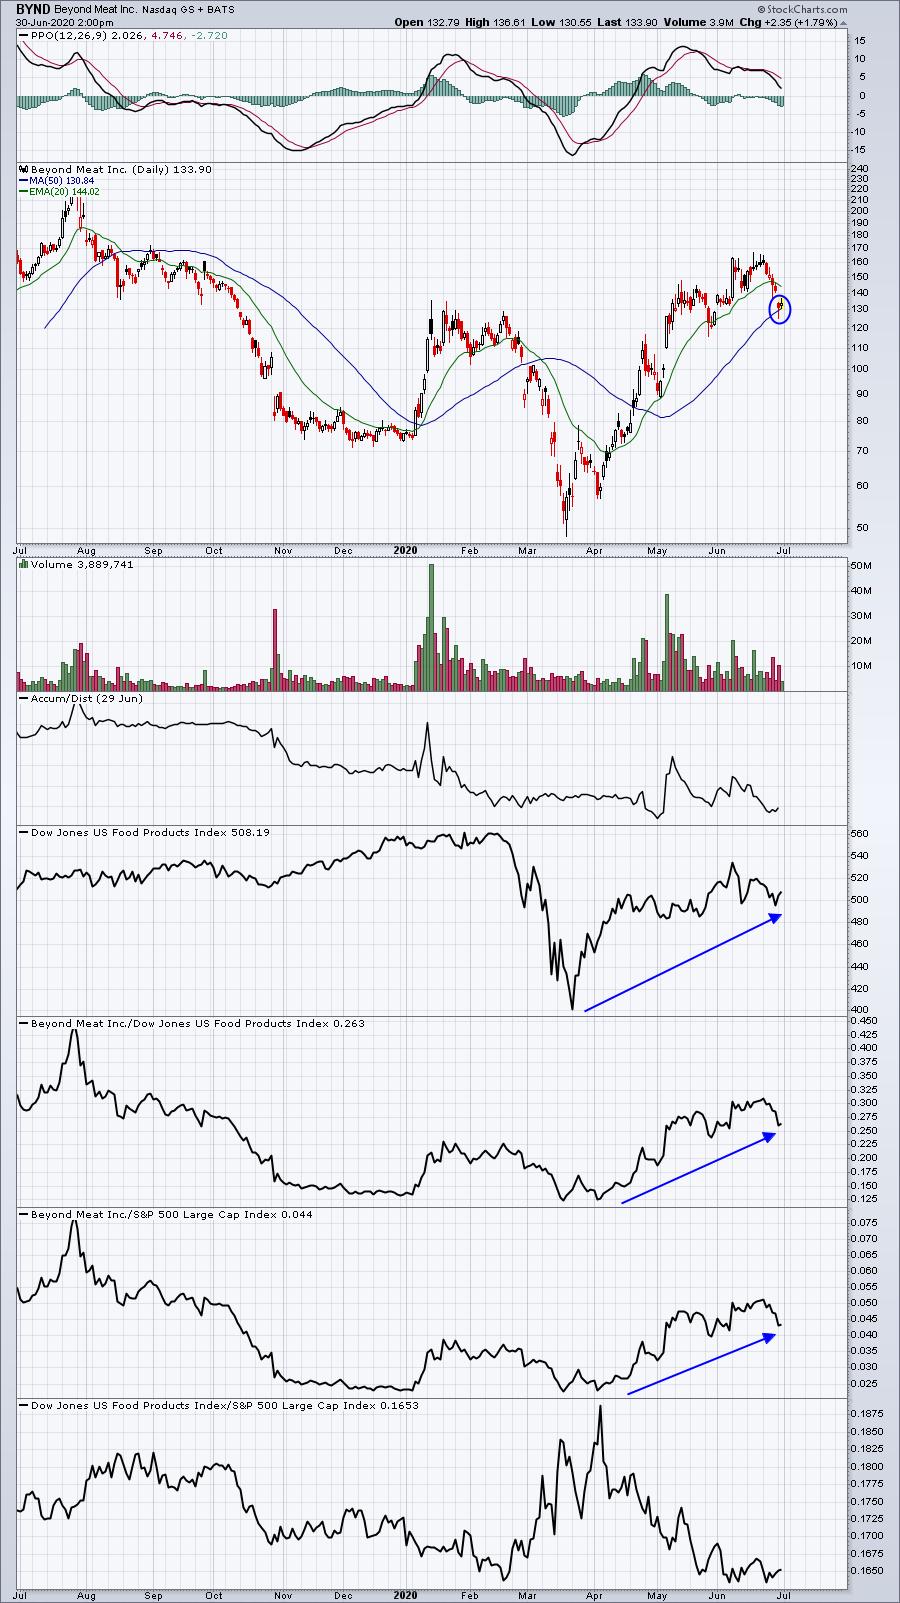
I like the hammer from Monday and the higher high printing today. I'd grow more cautious with a close below 130, so I'd keep a fairly tight stop.
From the Strong Future Earnings ChartList (SFECL) - BSGM, ENV, KIRK, KOD, MASI, MGEN, MITK, NK. I own MASI, so clearly I like this one. But I've provided charts on MASI in the recent past, so I'll take a look at MGEN, a smaller and very volatile stock:
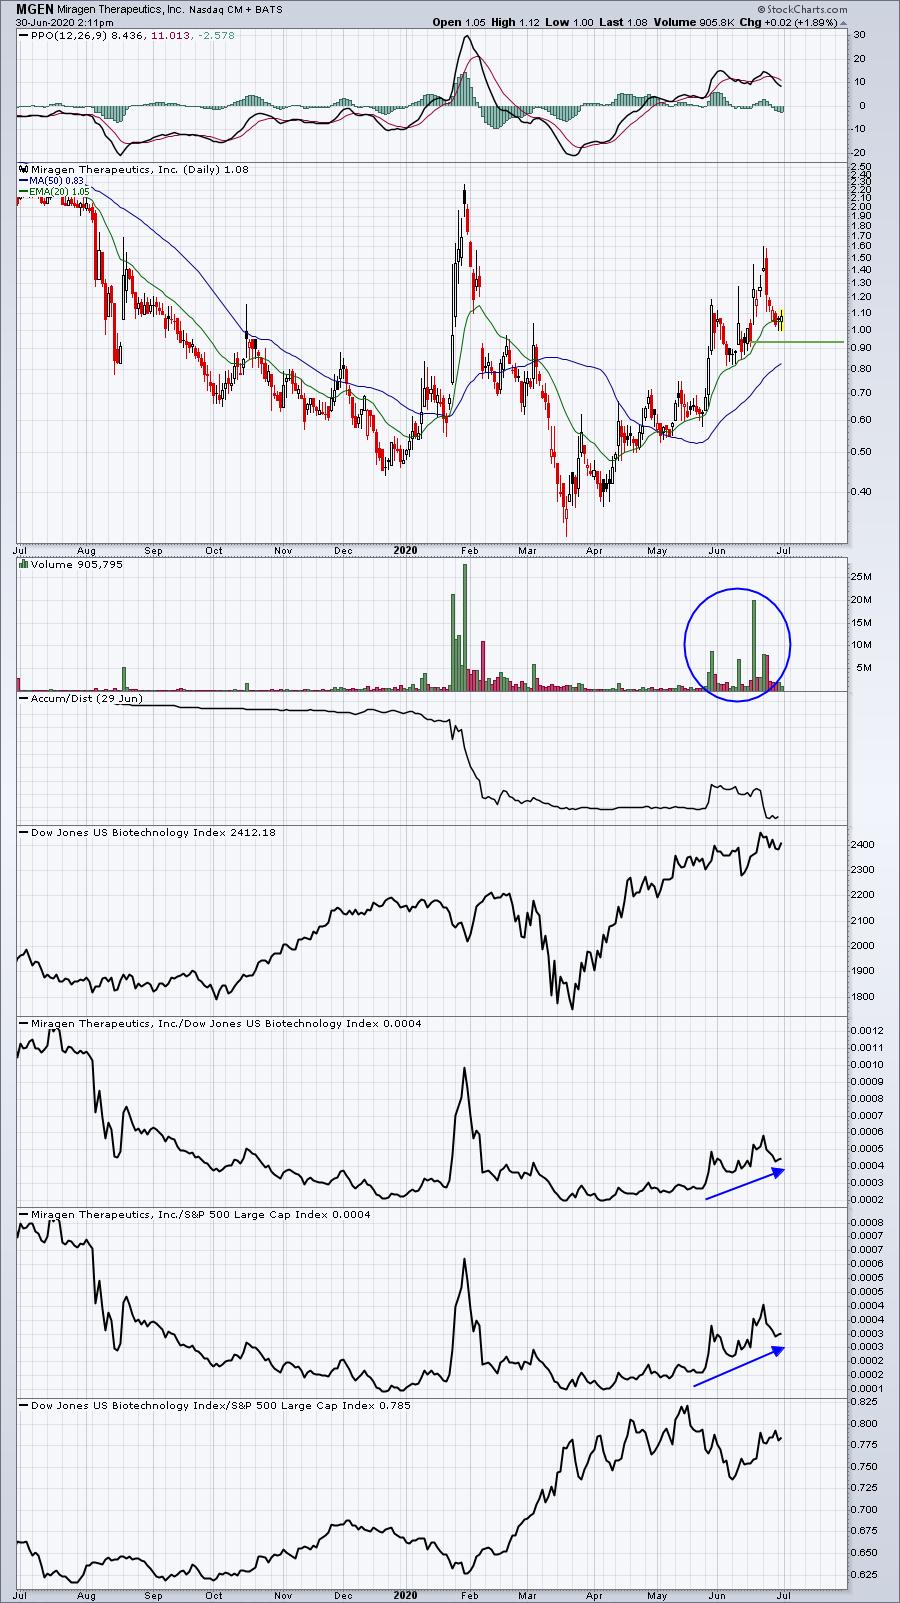
MGEN is just over $1 and many traders, including myself, avoid trading small dollar stocks like this one. Nonetheless, it has fallen back considerably from its recent high and is approaching key gap support. Just remember there's much more risk in a stock like this one.
From the Strong AD ChartList (SADCL) - BSGM, CCI, CCXI, CWEN, EQT, KOD, MASI, NOMD, RCUS, RRC, SAFE, SYNA, VIPS. I like 3 of these as follows:
CCI:
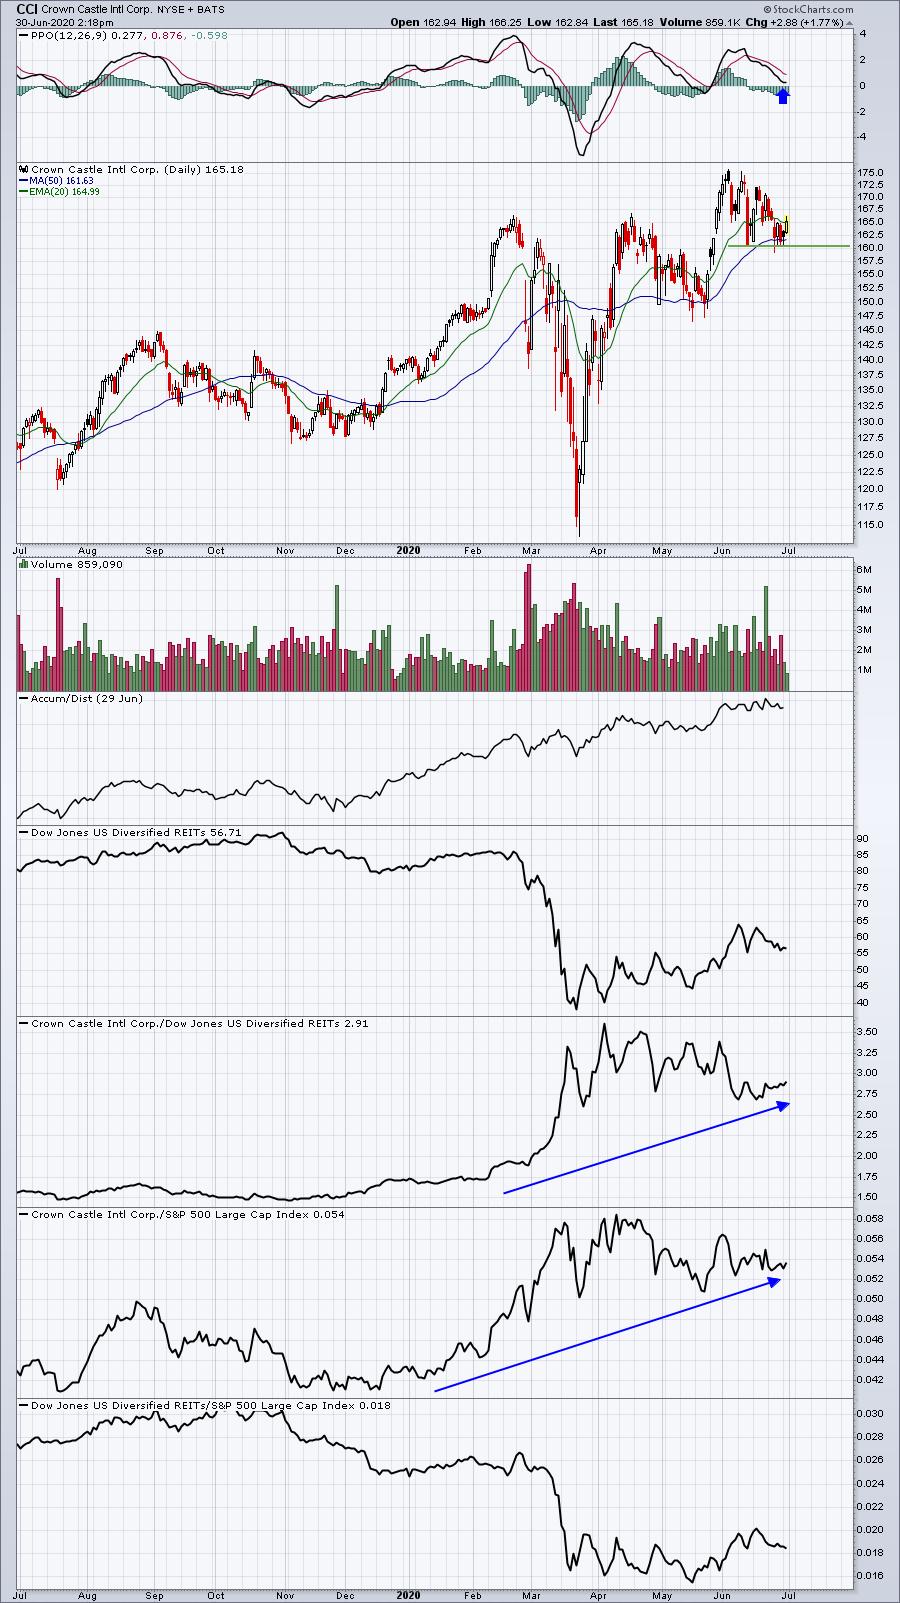
The PPO here is nearly back to centerline support, so the pullback may have ended. Also, CCI hit price support near that 160 level on Monday. I believe this could be the start of another uptrend. 160 could be used as a closing stop.
CWEN:
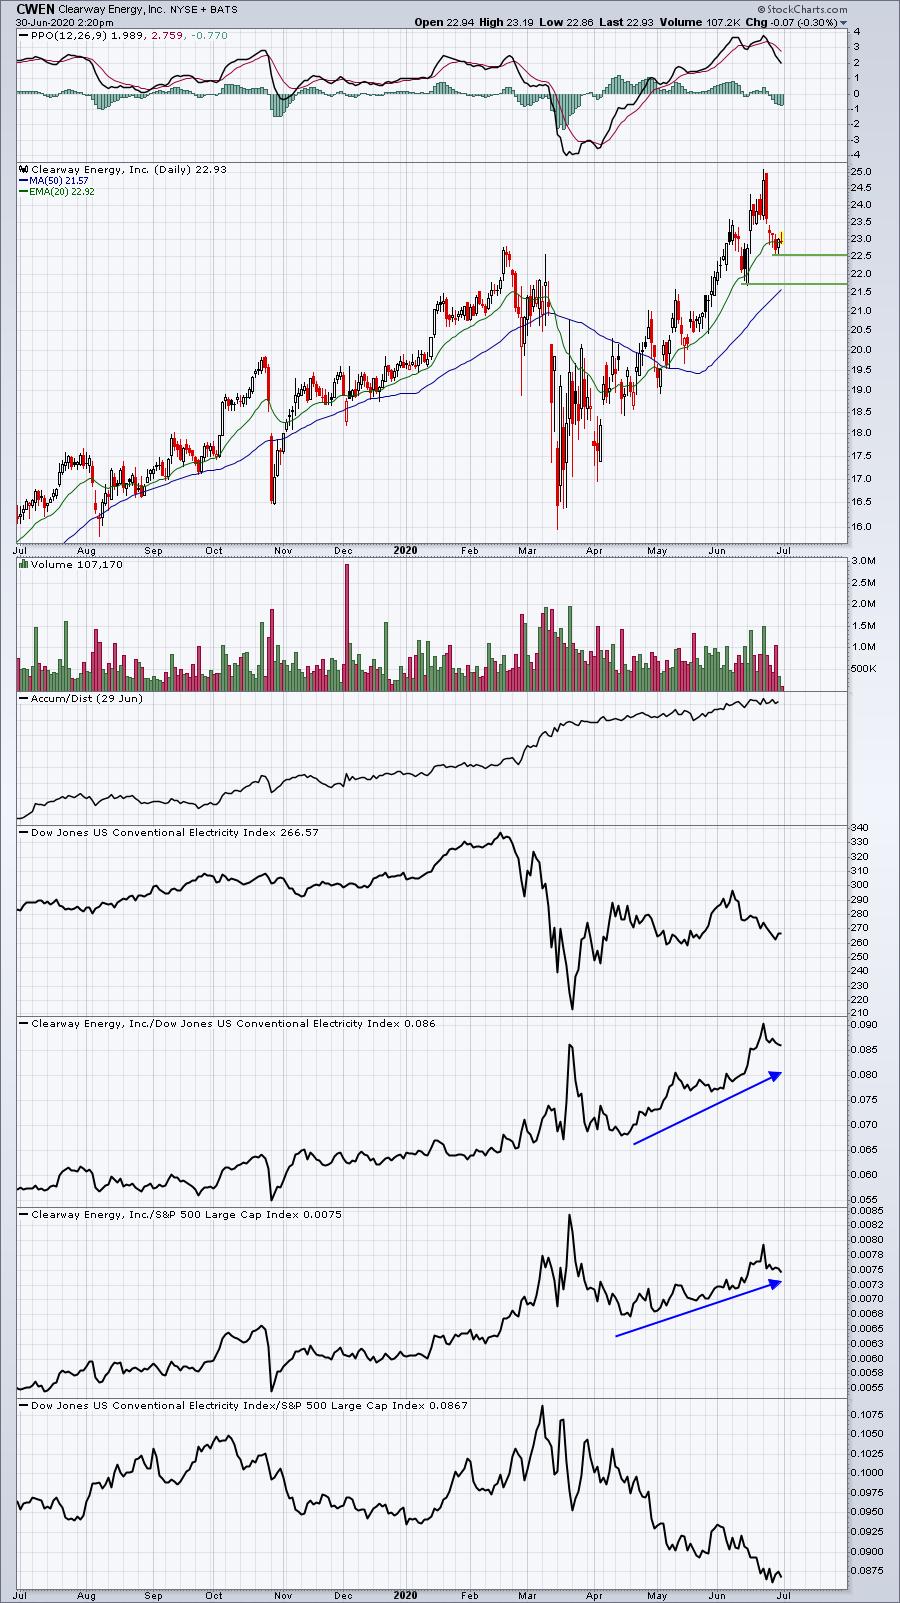
The 20 day EMA has proven to be solid entry on CWEN and we're testing that moving average again. Also, after hitting 25 recently, CWEN pulled back 10%, certainly improving the reward to risk in trading this stock.
VIPS:
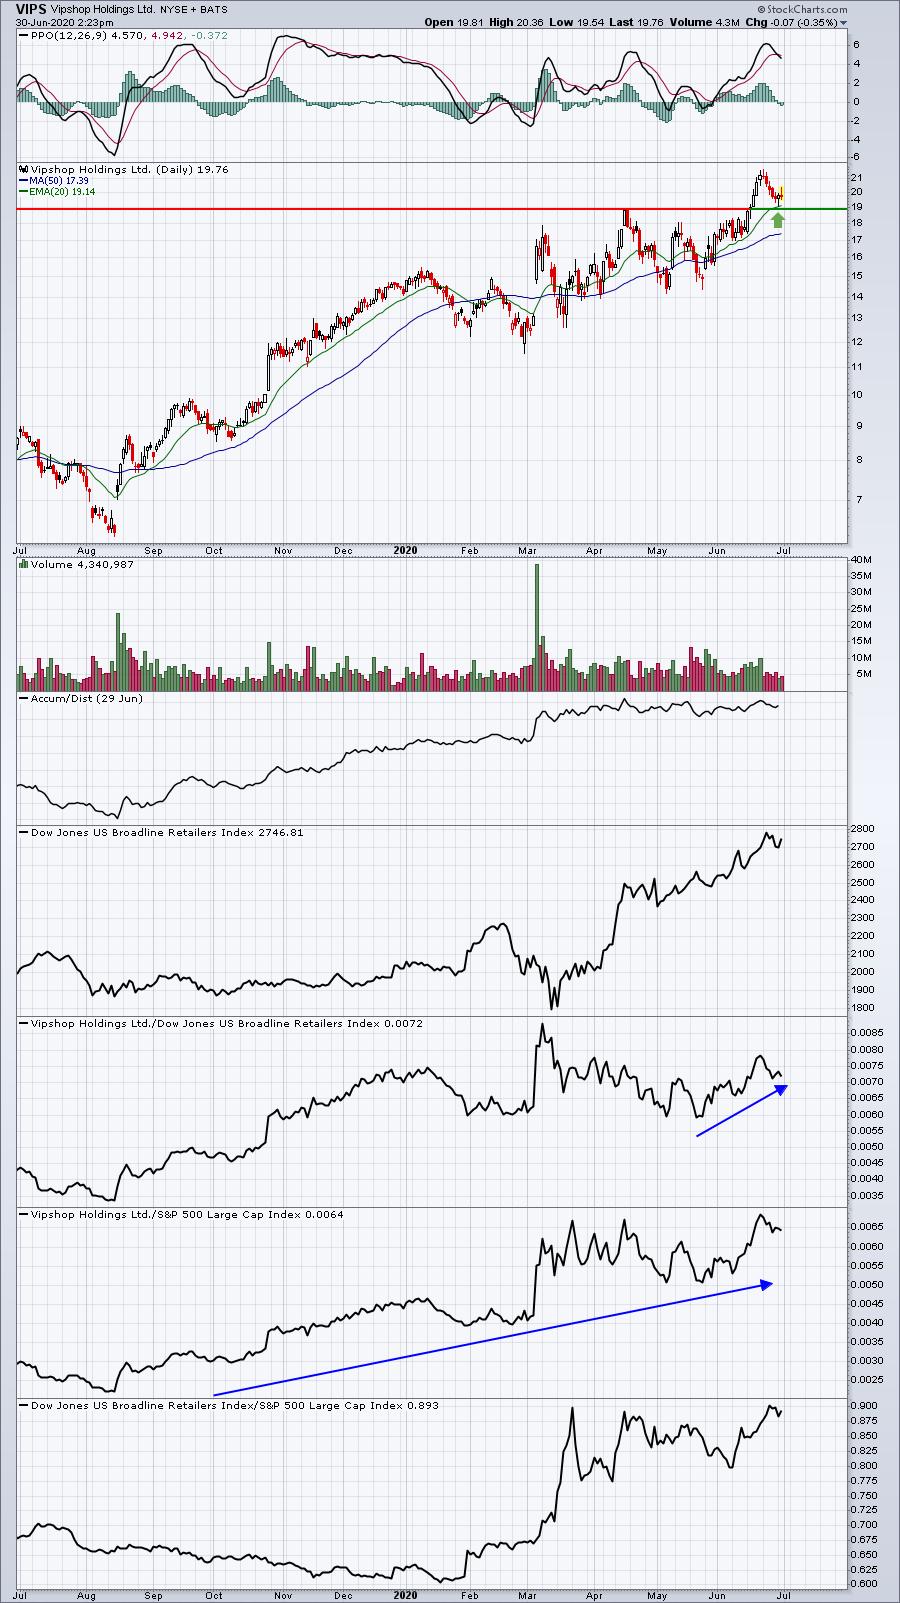
There haven't been many areas to trade any better than broadline retail ($DJUSRB) and VIPS has been one of the best. Monday's pullback tested price support and today's high might be triggering the start of another advance. I like VIPS from the current price down to 19 price support.
Earnings Reports
Here are the key earnings reports for today and tomorrow, featuring stocks with market caps of more than $10 billion. I also include a few select companies with market caps below $10 billion. Finally, any portfolio stocks (or active trade alerts) that will be reporting results are highlighted in BOLD. If you decide to hold a stock into earnings, please understand the significant short-term risk that you are taking. Please be sure to check for earnings dates for any companies you own or are considering owning:
Tuesday, June 30:
FDX, CAG, AYI, MEI
Wednesday, July 1:
GIS, STZ, UNF, FIZZ, CPRI
Economic Reports
April Case-Shiller HPI: +0.3% (actual) vs. +0.5% (estimate)
June Chicago PMI: 36.6 (actual) vs. 44.5 (estimate)
June consumer confidence: 98.1 (actual) vs. 90.0 (estimate)
Happy trading!
Tom