
EB Daily Market Report - Thursday, June 30, 2022
ChartLists Update
I have updated the Raised Guidance ChartList (RGCL), Strong AD ChartList (SADCL), and Bullish Trifecta ChartList (BTCL) today. Be sure to check out our website later this afternoon and hopefully you'll be able to view/download these 3 ChartLists.
Executive Market Summary
- Futures were very weak and our major indices tumbled in the first hour of trading
- A strong rally followed, however, and our key indices turned green or at least moved back to breakeven
- Initial jobless claims again came in higher than expected
- Crude oil ($WTIC, -3.69%) is down to $105 per barrel and energy (XLE, -2.55%) is very weak as a result
- Weak economic reports resulted in the 10-year treasury yield ($TNX) falling another 11 basis points to 2.98%
- All other commodities and cryptocurrencies are falling as well
- Renewable energy ($DWCREE, +2.28%) is having a solid day, bucking the overall downtrend; Enphase Energy (ENPH, +5.67%), a volatile stock of late, is leading the S&P 500
Market Outlook
Ummmm, has anyone noticed that the 10-year treasury yield ($TNX) has fallen back below 3.0%? We hit 3.48% on June 14th - the very same week as my bottom call on the S&P 500. Since that time, yields have fallen 50 (!!!!) basis points. When yields fall, bond prices rise. The reason that bond prices rise is because traders are buying significant amounts of bonds. But why would they do that at a 3% yield, when inflation is rising at a 6% + clip? It makes no sense. I've always said that the bond market is smarter than the stock market. And the primary reason is that much more manipulation takes place in the stock market, because of the significant trading done by market makers. The bond market is turning its attention to the recession that we're likely already in and appears to be paying little attention to inflation now. Perhaps increased selling returns to the bond market soon, but right now, bond traders are saying "goodbye" to inflation.
Today's consumer spending came in WELL BELOW expectations. That could reflect recessionary pressures, but more importantly demand appears to be slowing. As supply chain issues are resolved and demand slows, inflationary pressures DIE.
All of this should add up to more rotation into growth-oriented companies. Just look at this 2-month chart of the S&P 500, with the IWF:IWD relative chart beneath:
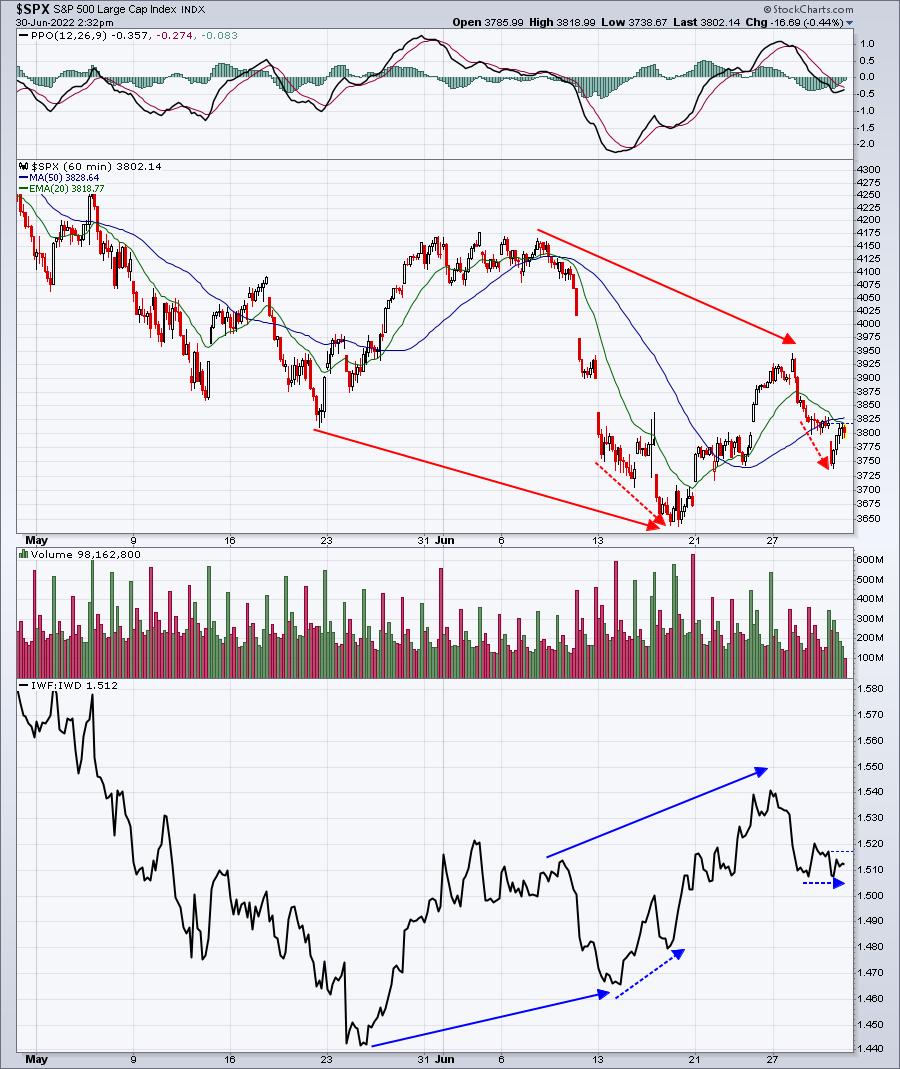
I can write and write and write about how I think the stock market is bottoming. But look at this chart and ask yourself one simple question. With the media talking incessantly about inflation and recession, why in the heck would money be rotating towards growth. Inflation KILLS growth stocks. A recession KILLS growth stocks. Yet this IWF:IWD ratio shows us bullish rotation as this ratio rises. Wall Street is repositioning into growth stocks, while nearly every retail trader is panicking about economic armageddon ahead.
The reason why Wall Street wants growth stocks now, in my opinion, is that they believe inflation is under control and that recessionary pressures will shift the Fed's focus in the future from a rate-hiking campaign to a rate-cutting campaign. I correctly predicted that all the talk would shift from inflation to recession. I predict that recessionary concerns will lead the media to begin talking about DEFLATION later this year. That will put pressure on lowering interest rates, and THAT is the environment where growth stocks typically soar.
Hey, I don't make this stuff up. I simply report what I'm seeing on the charts. Let's see how it plays out.
Sector/Industry Focus
I've discussed semiconductors a lot lately, mostly in a negative light. This morning, we saw the group test the mid-June low and bounce. We really want to see that low hold as support. Otherwise, the group could see much more selling ahead, and that would make progress to the upside more difficult. Here's the 2-month hourly chart:
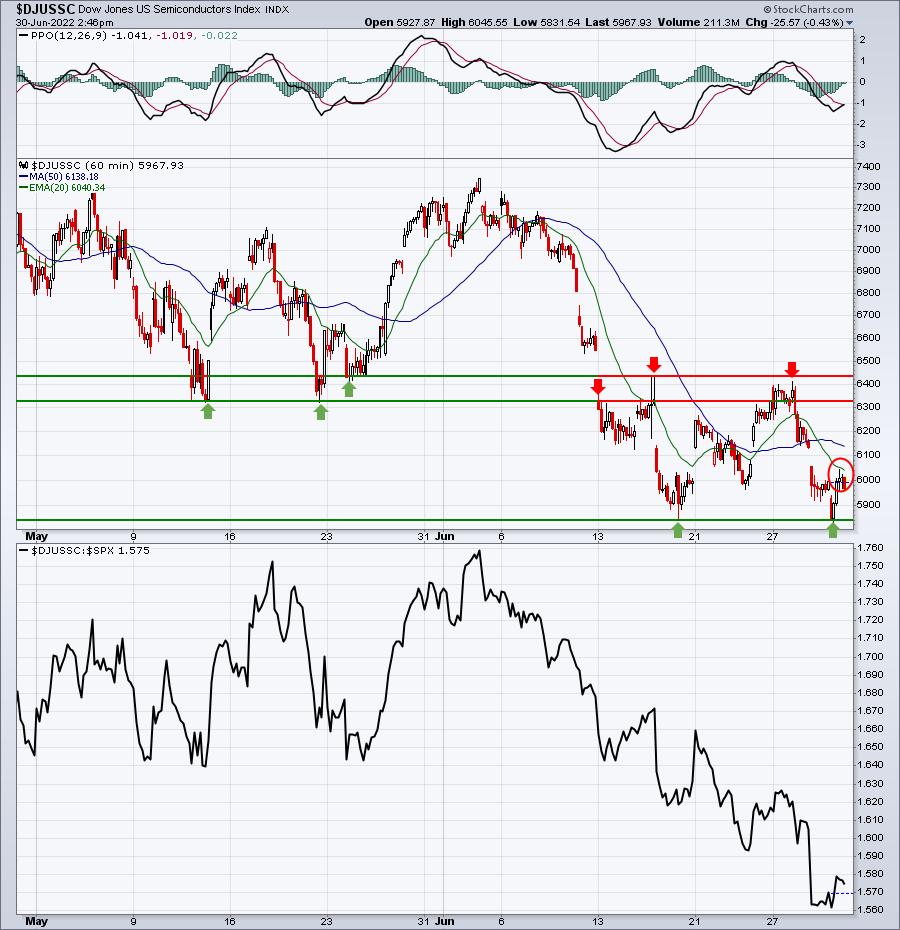
The bottom panel shows that relative strength has been awful for semis. That doesn't bode well for price support to hold. I've circled the declining 20-day EMA, because if semis are going to right the ship, it needs to start with a breakout above the 20-day. Currently, I'm seeing intraday failure there.
ChartLists/Strategies
I'm not adding anything today. We had a rough morning, but a solid recovery. But how are we going to finish today? A weak finish could lead to another gap lower, while a strong finish would likely have the opposite effect. Sticking with ETFs like the SPY and QQQ helps to smooth out the risk vs. individual stocks that are literally all over the place today. Let's not forget that the Volatility Index ($VIX) remains at 29 - an extremely high level historically. That suggests more whipsaw action ahead - even if the rotation is bullish.
I'll revisit possible individual stock trades tomorrow.
Earnings Reports
Here are the key earnings reports for the next two days, featuring stocks with market caps of more than $10 billion. I also include several companies with market caps below $10 billion. Finally, any portfolio stocks that will be reporting results are highlighted in BOLD. If you decide to hold a stock into earnings, please understand the significant short-term risk that you are taking. Please be sure to check for earnings dates for any companies you own or are considering owning.
Thursday, June 30:
MU, STZ, WBA, AYI, SMPL, LNN
Friday, July 1:
None
Economic Reports
Initial jobless claims: 231,000 (actual) vs. 226,000 (estimate)
May personal income: +0.5% (actual) vs. +0.5% (estimate)
May personal spending: +0.2% (actual) vs. +0.5% (estimate)
June Chicago PMI: 56.0 (actual) vs. 58.4 (estimate)
Happy trading!
Tom