
EB Daily Market Report - Friday, June 30, 2023
Bulls-Eye Forecast: Mid-Year Update
We will be hosting our mid-year update event on Thursday, July 6th at 7:00pm ET. EB members will automatically be registered a couple days before the event, but it's fine if you sign up first. Either way, we'll make sure all of our members have full access to the live event and also the recording, which will be time-stamped for your convenience.
Executive Market Summary
- Futures were strong overnight and all of our major indices gapped higher at the opening bell as Q2 ends on fire
- The small caps and mid caps have lagged since the opening bell, but there's not much else to say negatively about today's action
- 10 of 11 sectors are higher, with only real estate (XLRE, -0.64%) struggling
- Leadership is found once again in technology (XLK, +1.69%) and consumer discretionary (XLY, +1.47%)
- Renewable energy ($DWCREE, +2.58%) and recreational services ($DJUSRQ, +4.09%) are aiding the XLK and XLY, respectively
- Etherium ($ETHUSD, +3.68%) is attempting to close at a 7-week high, while bitcoin ($BTCUSD, -0.15%) is hesitating just below 31000 - it hasn't closed above that level in just over one year
- Crude oil's ($WTIC, +1.17%) bounce continues as the price has moved back above $70 per barrel, benefiting the energy sector at large
- In an almost daily occurrence, cruise lines are on fire with Carnival (CCL, +9.56%) topping the S&P 500 leaderboard.
Market Outlook
Let's break down the S&P 500 performance (since 1950) during the month of July from an historical perspective:
- July 1-17: +25.91%
- July 18-24: -13.85%
- July 25-31: +21.07%
The week from July 18 through July 24 is the second worst historical week of the year. The October 22 through October 27 is the only week historically that produces worst results.
Here's the NASDAQ historical performance (since 1971) breakdown in July:
- July 1-17: +31.84%
- July 18-24: -31.48%
- July 25-31: +3.20%
Finally, this is how the Russell 2000 (think IWM) historical performance (since 1987) breaks down in July:
- July 1-15: +16.66%
- July 16-24: -30.13%
- July 25-31: +15.20%
The bullish and bearish periods are slightly different on the Russell 2000, but performance overall is fairly consistent. We tend to see bullish action during the first 2-3 weeks of July, then earnings start being reported and we typically have a very bearish week.
Sector/Industry Focus
Energy (XLE) and materials (XLB) are both beginning to strengthen again. Here is a 1-year daily chart of both:
XLE:
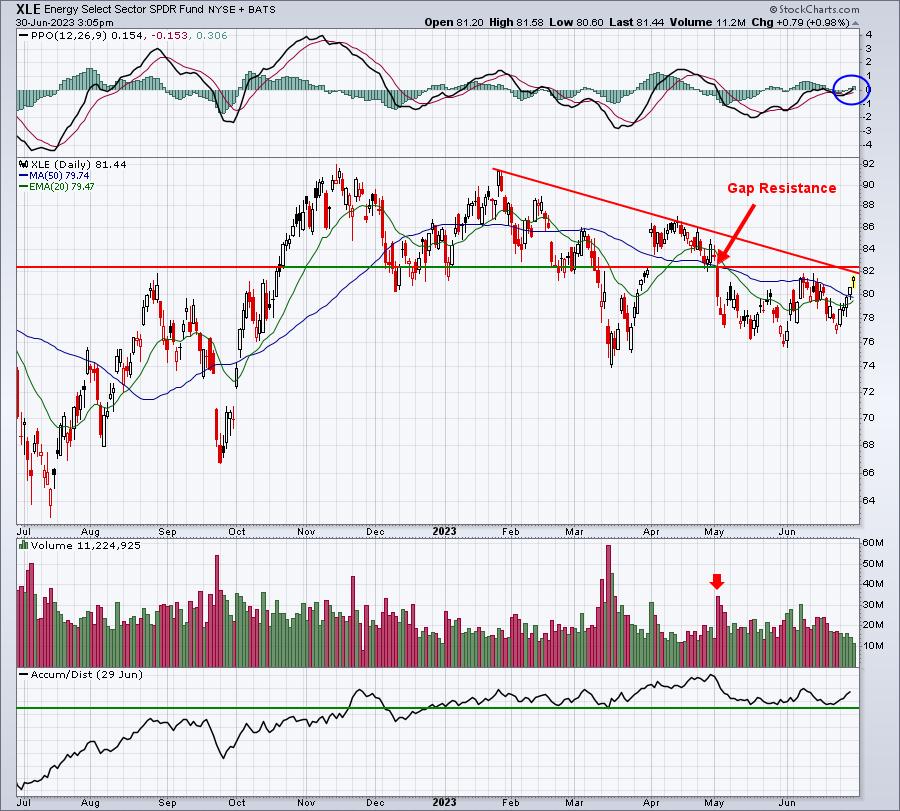
I see a very key resistance area just above current price, perhaps in the 82.00-82.50 range. A breakout above this level with continuing improvement in the AD line would be bullish.
XLB:
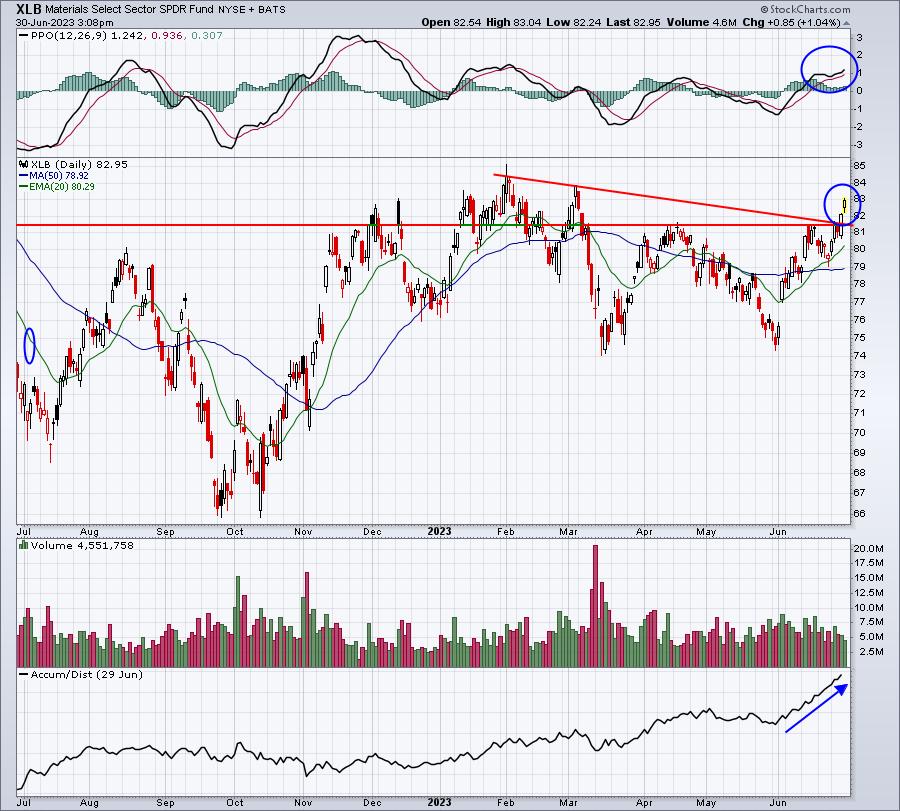
The XLB doesn't have to wait for anything. I see this chart as very bullish now. The XLB may not lead the S&P 500 higher, but its absolute price chart is quite bullish. I already see a key breakout level cleared, along with improving bullish momentum (rising PPO), and a TON of accumulation having taken place (AD line soaring).
ChartLists/Strategies
Shall we run the Downtrend Reversal scan one more day? We've now seen the major indices rising for the past few days and the number of individual stocks making reversals is dwindling, which makes perfect sense. There are only 13 today. Here are the charts that stuck out to me:
- AZN (test of price support)
- CCEP (cup with handle down to moving averages)
- IMVT (testing gap support zone)
- NVDA (bouncing off 20-day EMA)
Earnings Reports
Here are the key earnings reports for the next two days, featuring stocks with market caps of more than $10 billion. I also include notable companies with market caps below $10 billion. Finally, any portfolio stocks that will be reporting results are highlighted in BOLD. If you decide to hold a stock into earnings, please understand the significant short-term risk that you are taking. Please be sure to check for earnings dates for any companies that you own or are considering owning.
Friday, June 30:
STZ
Monday, July 3:
None
Economic Reports
May personal income: +0.4% (actual) vs. +0.4% (estimate)
May personal spending: +0.1% (actual) vs. +0.2% (estimate)
May PCE price index: +0.1% (actual) vs. +0.1% (estimate)
May Core PCE price index: +0.3% (actual) vs. +0.4% (estimate)
June Chicago PMI: 41.5 (actual) vs. 44.2 (estimate)
June consumer sentiment: 64.4 (actual) vs. 63.9 (estimate)
Happy trading!
Tom