
EB Daily Market Report - Friday, July 31, 2020
Executive Market Summary
- Despite a slew of upbeat quarterly earnings reports from tech land, stocks are mostly struggling today
- The tech-laden NASDAQ is outperforming as we should expect
- Gold ($GOLD) has rallied another $24 per ounce to $1990 as it moves closer and closer to a key psychological level at $2000
- Crude oil ($WTIC) continues to straddle the $40 per barrel level
- The 10 year treasury yield is flat at 0.54% and the dollar (UUP, +0.42%) appears to be reversing its recent downtrend
- Apple (AAPL, +9.12%) and Facebook (FB, +7.78%) are the two best performers on the S&P 500
- Amazon.com (AMZN, +3.89%) is among the S&P 500's Top 10
- After threatening a breakout above the June 8th high, Under Armour (UAA, -9.52%) is the S&P 500's worst performer today
Market Outlook
After the closing bell on Thursday, 4 of the 5 "FAANG" stocks - Facebook (FB), Amazon.com (AMZN), Apple (AAPL), and Alphabet (GOOGL) - reported quarterly results. They all CRUSHED estimates - both revenue and EPS - and 3 of the 4 are seeing very positive market reactions. Only GOOGL is lower today, and their relative strength vs. internet stocks ($DJUSNS) suggested that it's not a great investment right now. GOOGL was the one I was most concerned about heading into earnings as it had the poorest relative strength. FB also wasn't great, but we have seen a nice market reaction there as it's the 2nd best performing stock on the S&P 500 today (behind AAPL). More importantly, these earnings reactions seem to be reversing the recent downtrend on the QQQ:$SPX price relative chart:
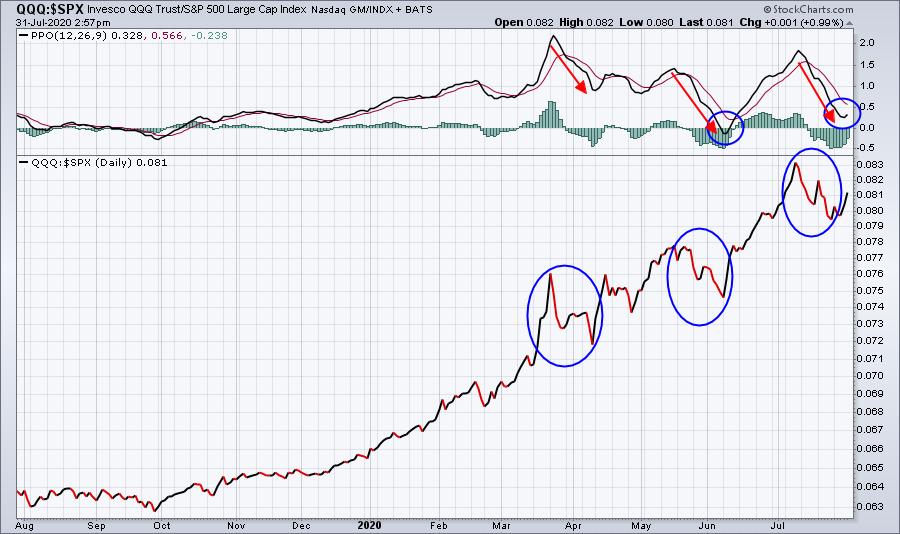
This reversal suggests that we're likely to see further outperformance by the QQQ in the coming days and weeks.
Sector/Industry Focus
Software ($DJUSSW, -0.43%) is underperforming today, but found buyers once again when it fell into its recent 3700-3800 support zone:
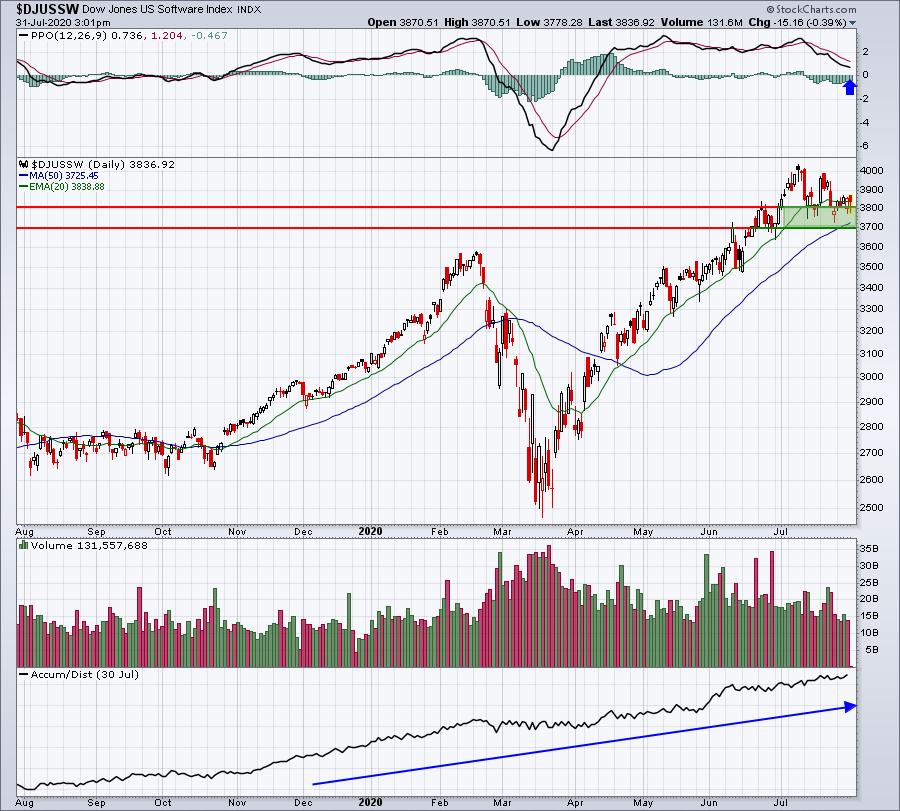
The blue arrow shows us that momentum (PPO) is nearing key centerline support. Also, in the bottom panel, note that the AD line continues climbing even though price action has shown more sideways to down action of late. When a group or a stock rallies off intraday lows and finishes in the top half of its trading range for that day, its AD line actually rises - even if it's down for the day. If you notice all those "tails" to the downside the past few weeks within that support zone, it highlights the fact that buyers are accumulating software shares on any move into this zone.
ChartLists
I reviewed the charts of companies that have recently reported and been added to our Strong Earnings ChartList, looking specifically for any that are testing key price or gap support or perhaps nearing a big breakout level. Here is one of each:
Support test - ZUO:
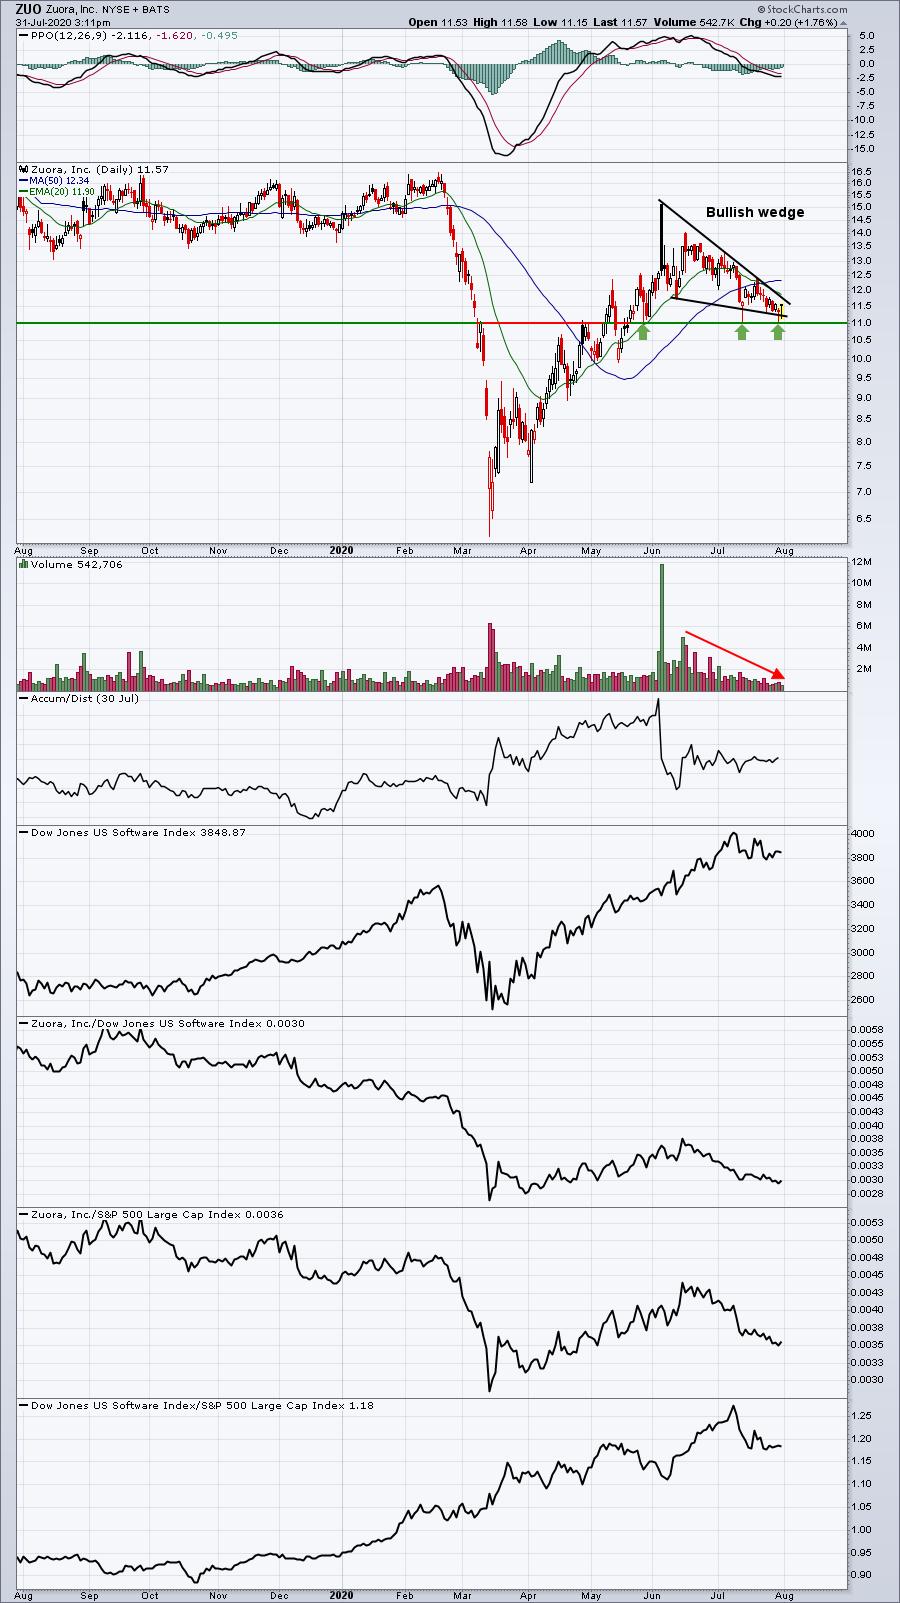
Watch for a potential break to the upside and out of the current bullish wedge pattern. Key price support resides near 11 and it was just tested again. A break below that level would be of concern. Otherwise, I'd be looking for a breakout here.
Awaiting Breakout - JBL:
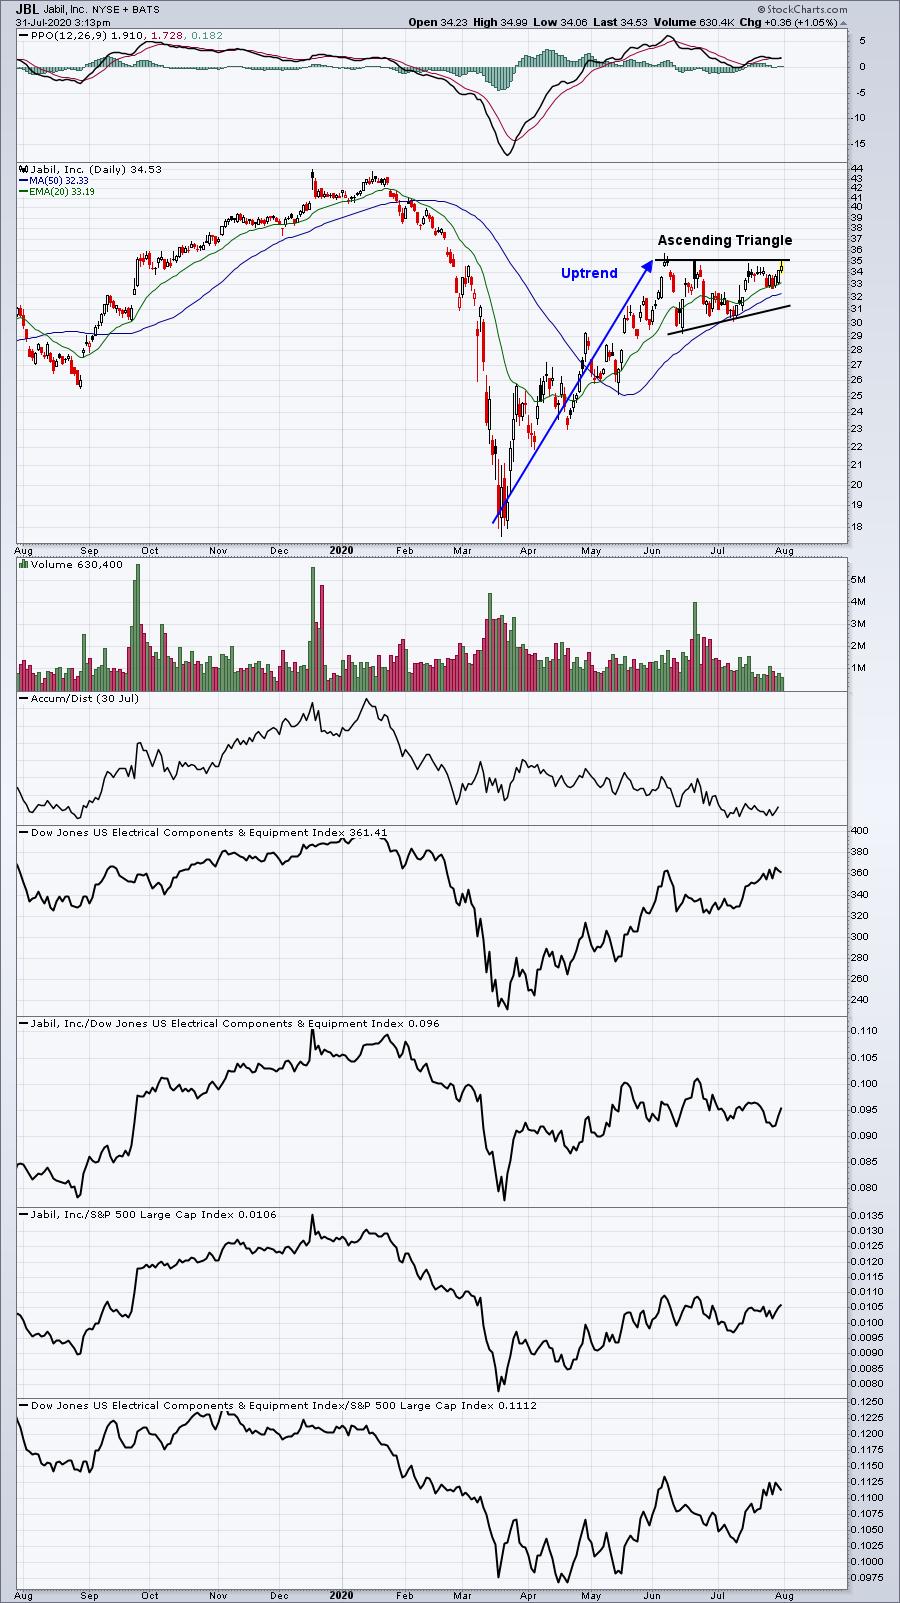
We could still see one more pullback to test the rising trendline, but this pattern looks very bullish to me. Today's test at 35 and failure is suggesting that we remain patient, but I'd be a buyer at either trendline support in the lower-30s or on a breakout above 35 with increasing volume. I'd want to see a close above 35 to confirm that breakout.
Earnings Reports
Here are the key earnings reports for today and tomorrow, featuring stocks with market caps of more than $10 billion. I also include a few select companies with market caps below $10 billion. Finally, any portfolio stocks (or active trade alerts) that will be reporting results are highlighted in BOLD. If you decide to hold a stock into earnings, please understand the significant short-term risk that you are taking. Please be sure to check for earnings dates for any companies you own or are considering owning:
Friday, July 31:
MRK, XOM, CVX, ABBV, CHTR, CAT, D, CL, ITW, TAK, AON, LHX, IDXX, ES, PSX, JCI, PEG, NOK, VFC, LYB, TU, CHD, FCAU, WY, PINS, CBRE, IMO, WPC, BAH, ASX, CBOE, SNA, NWL, UAA, ITT, GT, SPB
Monday, August 3:
ITUB, GPN, SBAC, RACE, KLAC, CLX, AIG, MPC, MCK, RNG, WMB, TSN, O, MPLX, CMS, TTWO, INVH, ESS, STE, IR, J, NBIX, EMN, CNA, CHGG, SEDG, TREX, FIVN, DLB, VNO, MOS, NBL, H, SPCE, TXRH, CRUS, VRNS, MIME, THC, NSP, LGND, RRC, CTB
Economic Reports
June personal income: -1.1% (actual) vs. -1.0% (estimate)
June personal spending: +5.6% (actual) vs. +5.6% (estimate)
July Chicago PMI: 51.9 (actual) vs. 42.8 (estimate)
July consumer sentiment: 72.5 (actual) vs. 73.2 (estimate)
Happy trading!
Tom