
EB Daily Market Report - Wednesday, August 31, 2022
Executive Market Summary
- Futures were solid overnight, similar to Tuesday, but there's once again been very little interest on the long side throughout the balance of the day
- On a more positive note, however, there hasn't been much selling interest either the past few days after 11:00am ET
- Crude oil ($WTIC, -0.69%) is down fractionally, but energy stocks (XLE, +0.59%) are showing a bit of leadership today
- Communication services (XLC,+0.98%) is the best-performing sector, due primarily to strength in internet ($DJUSNS, +0.75%) and entertainment ($DJUSBC, +0.70%)
- While materials (XLB, -0.72%) is the primary laggard, technology (XLK, -0.48%) remains under pressure; semiconductors ($DJUSSC, -1.83%) continue to struggle on both an absolute and relative basis
- Sentiment is growing more and more bearish, which, as a contrarian indicator, is actually bullish - more on this below
- The 10-year treasury yield ($TNX) is up 1 basis point to 3.12% after Cleveland Fed Reserve President Loretta Mester said to expect rates to rise above 4% by early next year
- Meta Platforms (META, +3.60%, and formerly Facebook) is today's best-performing S&P 500 stock, helping to lead internet stocks higher
Market Outlook
There's an old Wall Street adage that I'm sure many of you are well aware of. It's "don't fight the Fed", right? Well, there is certainly a lot of truth in that, but I want to show you a couple examples of how misleading this can be to blindly follow this adage:
Cyclical Bull Market, 2003-2007:
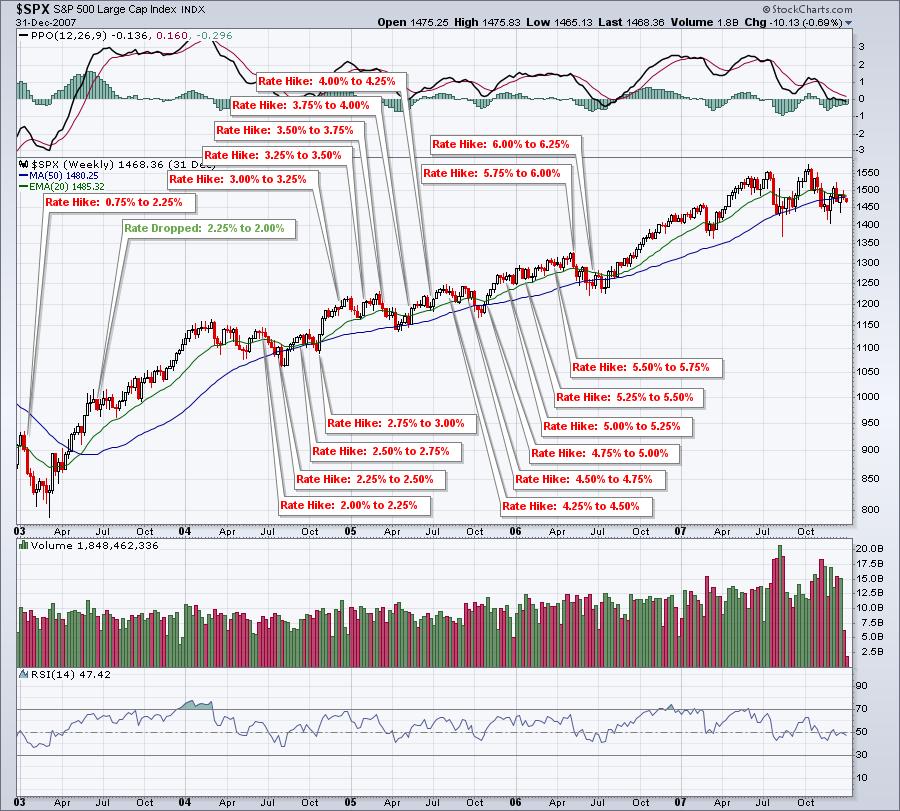
From June 2004 through June 2006, the Fed met 17 times and raised rates every single time. The S&P 500 during that period rose 11%-12%. This was during a cyclical bull market within the 12-year secular bear market that lasted from 2000-2012.
Secular Bull Market, 1960s:
I could not find the individual rates hikes during the 1960s, but here's a snapshot of the Fed Funds effective rate throughout the 1960s from the St. Louis Fed:
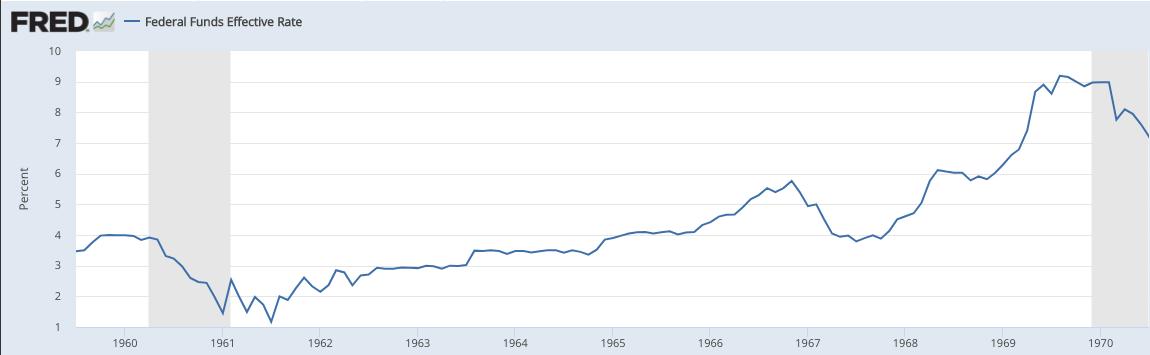
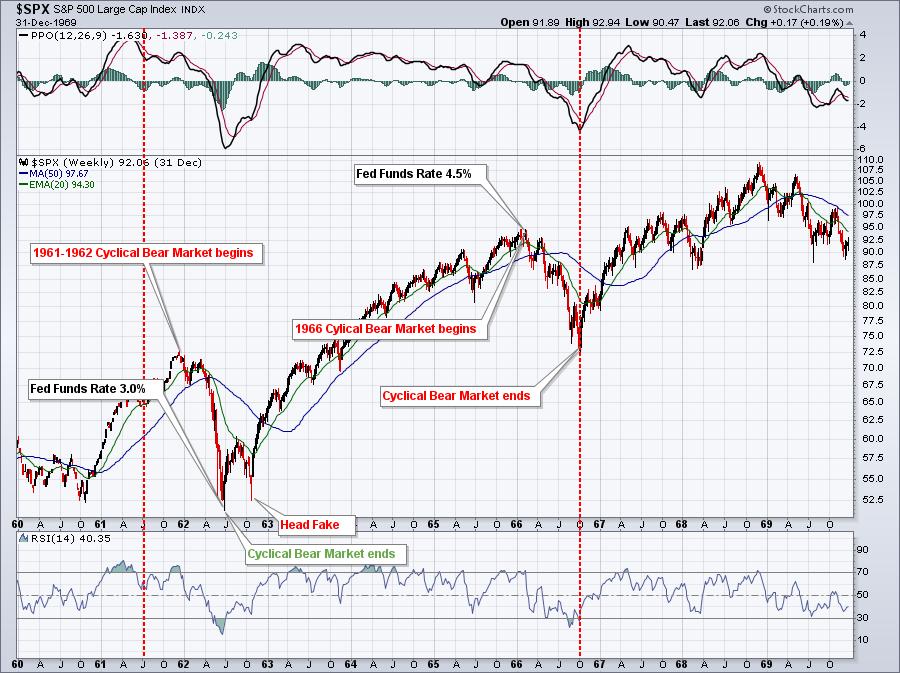
I want you to look from mid-1961 to early-1966. The fed funds rate was on the move higher throughout the period and what did the secular bull market of the 1960s do? It kept pushing higher and higher, rising roughly 80% during the 3 1/2 years of this hawkish cycle.
My point is not to discredit the "don't fight the Fed" adage. Instead, it's to recognize that interest rates are near historic lows - similar to where the rates were in both 1961 and 2004, before rate hiking campaigns began. Raising rates from historic lows is not the same as raising rates from much higher levels. Our economy will be able to withstand higher rates ahead and, because rates still remain incredibly low, other asset classes like bonds are still not appealing vs. equities. Investors are not going to leave U.S. equities - even if the Fed does continue raising rates to above the 4.0% threshold.
Sector/Industry Focus
Let's talk sentiment, because it has a very strong history of predicting short-term tops and bottoms. The following chart was a chart that I sent out in a mid-August Daily Market Report (DMR). I had indicated that when this 5-day moving average of the equity-only put-call ratio ($CPCE) bottomed (heavy call action), it would likely mark a short-term market top. The red-dotted vertical lines on the chart mark the significant bottoms in this 5-day moving average. Many marked significant short-term market tops:
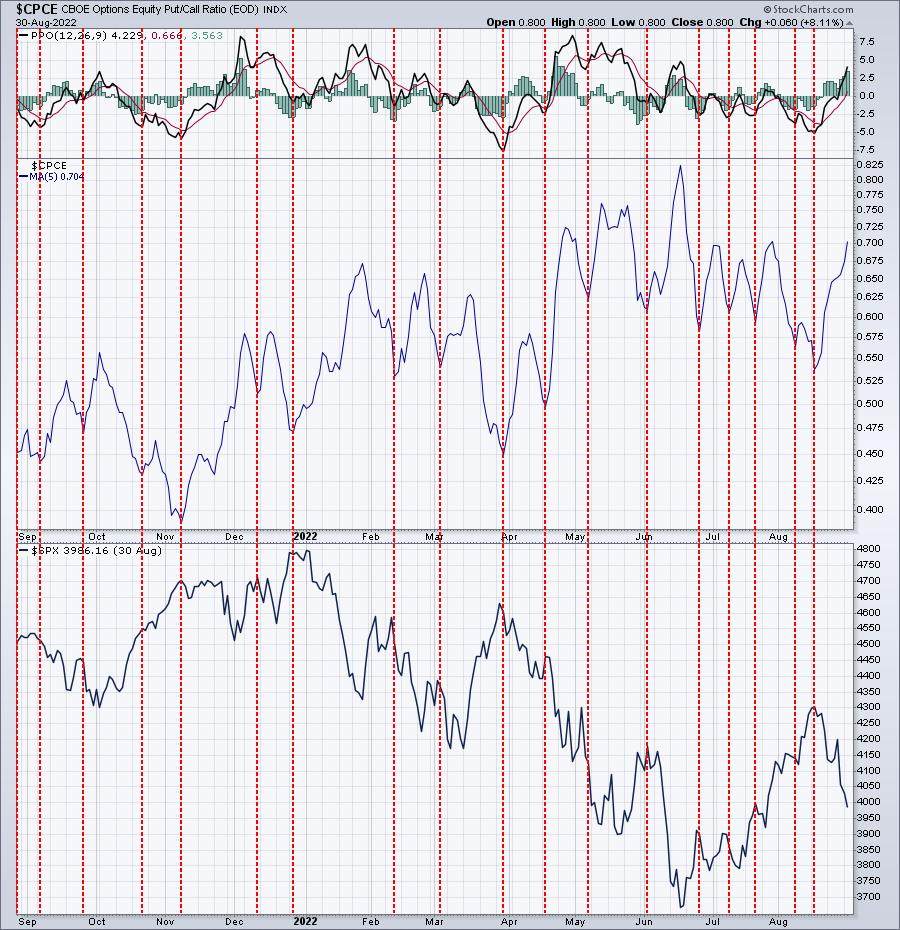
It can also effectively mark short-term market bottoms. As more and more options traders buy puts, which normally happens during selloffs like the one we're in now, we reach short-term tops in the 5-day moving average of the CPCE that tend to coincide with short-term market bottoms. Here's what that chart looks like:
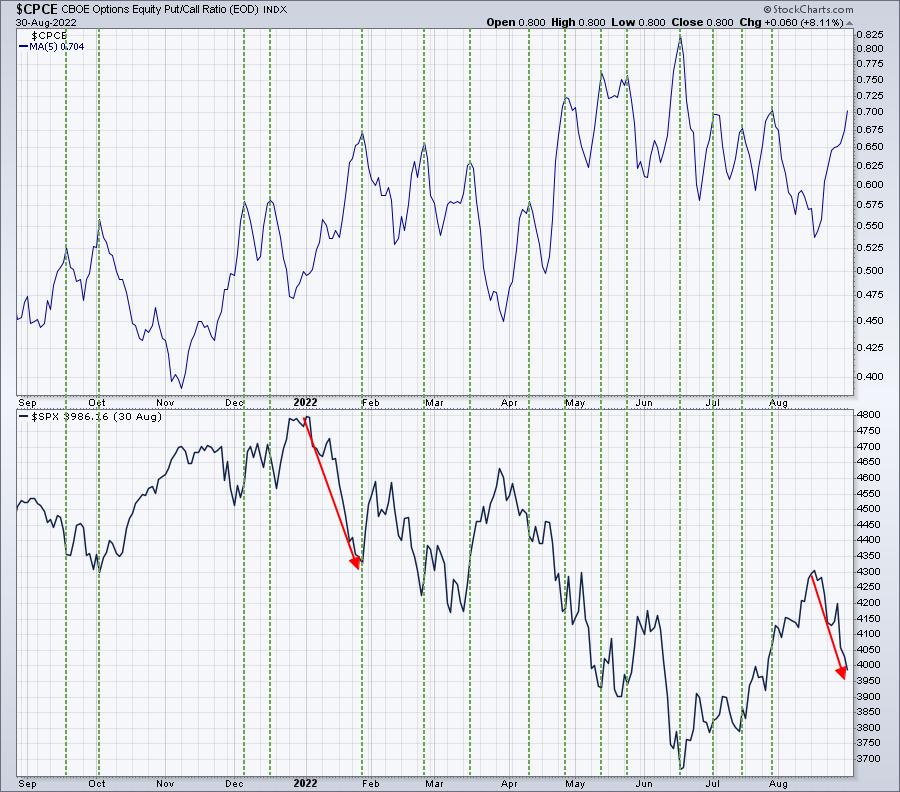
I certainly do not view this as any type of "slam dunk" that we're getting ready to reverse. But, if you look at (top) reversals in the 5-day moving average of the CPCE, they do tend to closely mark at least short-term market bottoms. The bearish sentiment continues to grow and, after looking at cboe.com a little bit ago, it's safe to say that this 5-day moving average will jump even further after today's close, marking the most bearish options sentiment since we hit the mid-June low.
I'd expect over the next day or two to hit a key short-term bottom and perhaps make a run back towards the 20-day EMA, currently at 4110 on the S&P 500. Personally, I would NOT use any kind of leverage or margin as risks are too high, but I'll be surprised if this selling continues unabated well into September without at least a bounce.
ChartLists/Strategies
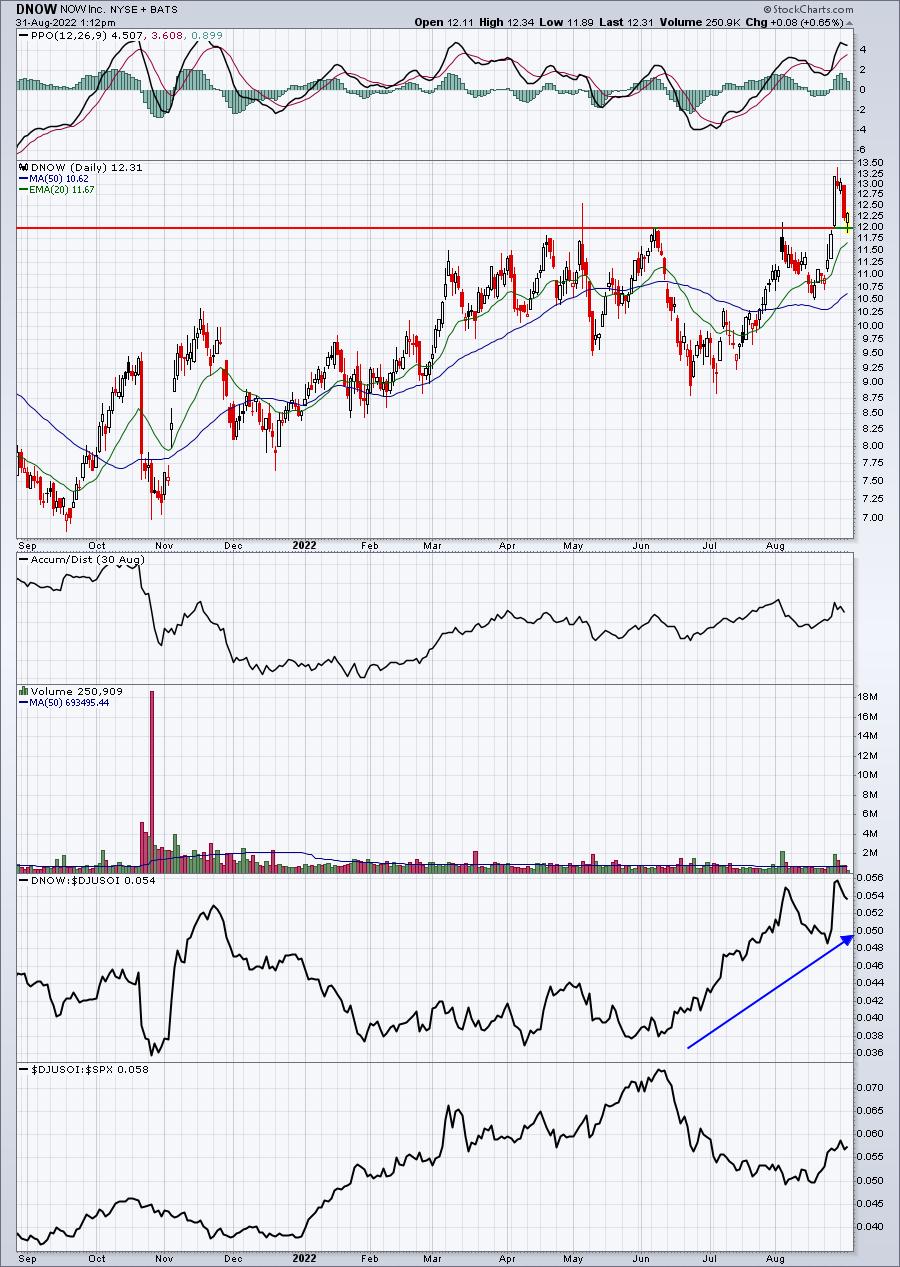
I've been pointing out stocks in our portfolios or on our Strong Earnings ChartList (SECL) that are seeing key technical tests, particularly 20-day EMA and/or price support tests. Here are two more:
DNOW:
FROG:
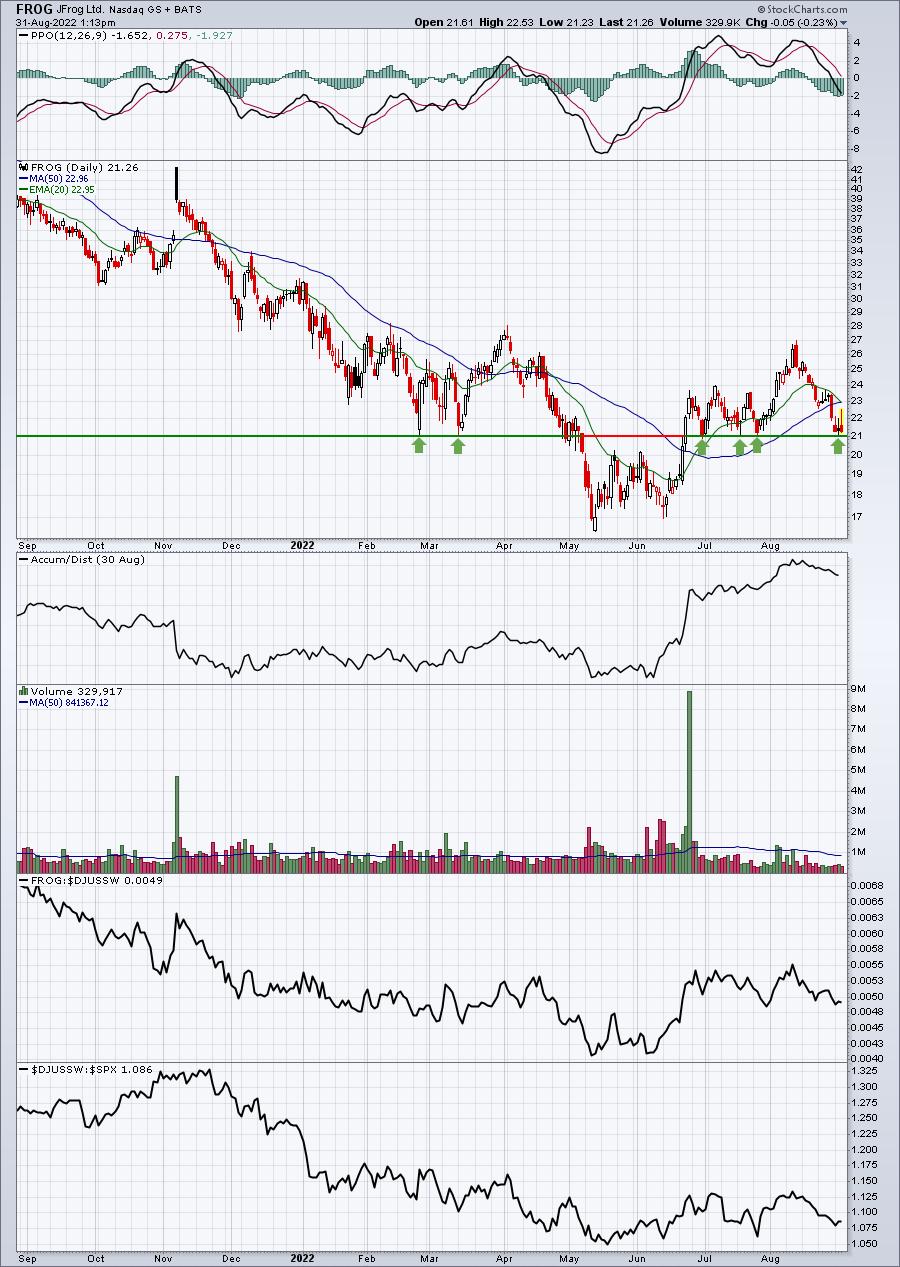
These two have both hit key support. DNOW is easily the stronger stock, trading in clearly-defined uptrend and leading its industry peers on a relative basis. While FROG doesn't look nearly as strong in that regard, it's fairly obvious to me that 21.00 marks critical price support. There is certainly no guarantee of a bounce from here, but as far as reward-to-risk goes, it doesn't get much better.
Earnings Reports
Here are the key earnings reports for the next two days, featuring stocks with market caps of more than $10 billion. I also include several companies with market caps below $10 billion. Finally, any portfolio stocks that will be reporting results are highlighted in BOLD. If you decide to hold a stock into earnings, please understand the significant short-term risk that you are taking. Please be sure to check for earnings dates for any companies you own or are considering owning.
Wednesday, August 31:
BF/B, VEEV, MDB, OKTA, COO, PSTG, IOT, S, FIVE, DCI, NTNX, GEF, SMTC, AI, CRDO, DBI, CHS
Thursday, September 1:
AVGO, LULU, HRL, CPB, TTC, CIEN, SAIC, WB, SMAR, OLLI, NCNO, SIG, PDCO
Economic Reports
August ADP employment report: 132,000 (actual) vs. 225,000 (estimate)
August Chicago PMI: 52.2 (actual) vs. 52.1 (estimate)
Happy trading!
Tom