
EB Daily Market Report - Thursday, September 30, 2021
Executive Market Summary
- Futures were higher overnight and our major indices opened higher
- We've seen intraday selling since, but the rotation today has been moving back towards growth stocks
- Communication services (XLC, +0.19%) and technology (XLK, -0.23%) have been the top-performing sectors
- Meanwhile, consumer staples (XLP, -1.33%) and two recent winners - industrials (XLI, -1.25%) and financials (XLF, -1.10%) - are lagging
- Energy (XLE, -0.41%) remains relatively strong as crude oil ($WTIC, +1.48%) moves toward $76 per barrel
- Cryptocurrencies are strong today as etherium ($ETHUSD) gains more than 6%
- Gold ($GOLD, +2.12%) is having a very strong day as it tests price support from August 9th
- CarMax (KMX, -10.20%), a specialty retailer ($DJUSRS), is today's worst S&P 500 performer after reporting surprisingly weak EPS, despite a huge beat in revenues
Market Outlook
We're seeing another day of potential distribution as our major indices have turned lower. The Dow Jones, small caps ($SML), and mid caps ($MID) are all down more than 1% at the time of this writing. One possible catalyst for at least a short-term reversal back to the upside is the time of the calendar month. The three most bullish days of the month historically are the last trading day, plus the first two trading days of the next month. That's Friday (tomorrow), Monday, and Tuesday. Thus far, in 2021, we've had 27 such days (9 months times 3 days each month). 17 have ended higher, 10 have ended lower, and the cumulative percentage gain of these 27 days is 5.77%. On an annualized basis, this would equate to 54.03% - clearly quite bullish.
The reason for this behavior is that new money comes into the stock market every month. Think 401(k) and IRAs. Many times, the money actually comes in on the first or the second of the month. The last trading day of the month is an opportunity for professionals to jump in ahead of the new money, a legal form of "front-running". I can't tell you that it will work as we move into October. Rather, I just provide you the unbiased information, so that you can make more informed trading decisions.
Sector/Industry Focus
I discussed the 2021 breakout in the U.S. Dollar ($USD) yesterday and one area of the market that moves inversely to the dollar (at least on a relative basis vs. the S&P 500) is materials (XLB). So given the renewed strength in the dollar, I'd be concerned if the following key price support is lost on the XLB:
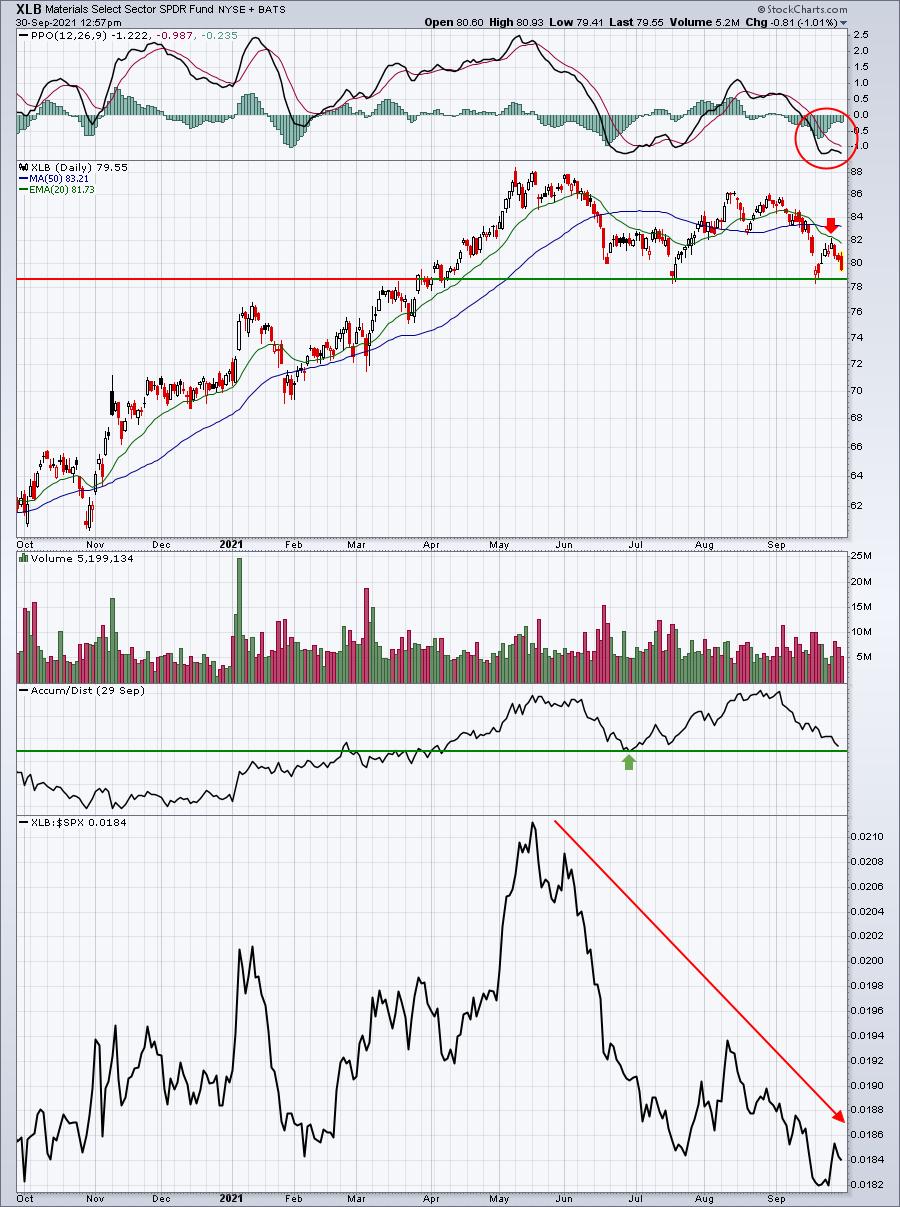
This is a very bearish-looking chart. The PPO barely budged higher on the recent rally to the 20-day EMA, which failed by the way. Relative strength of the XLB vs. the S&P 500 has been downtrending significantly since May, a fairly significant signal that inflation will be contained.
ChartLists/Strategies
Seasonally, financials (XLF) love October. As I'll be highlighting in the October Seasonality Report (hopefully will be out later tonight, but could be over the weekend), here is how the various financial industry groups perform relative to the S&P 500 over the past decade (average outperformance):
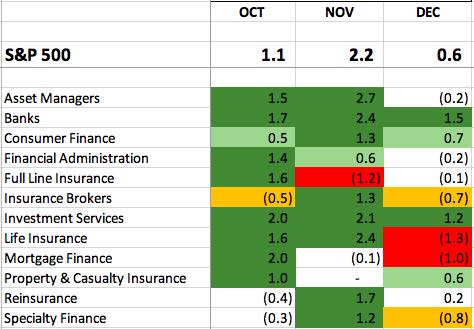
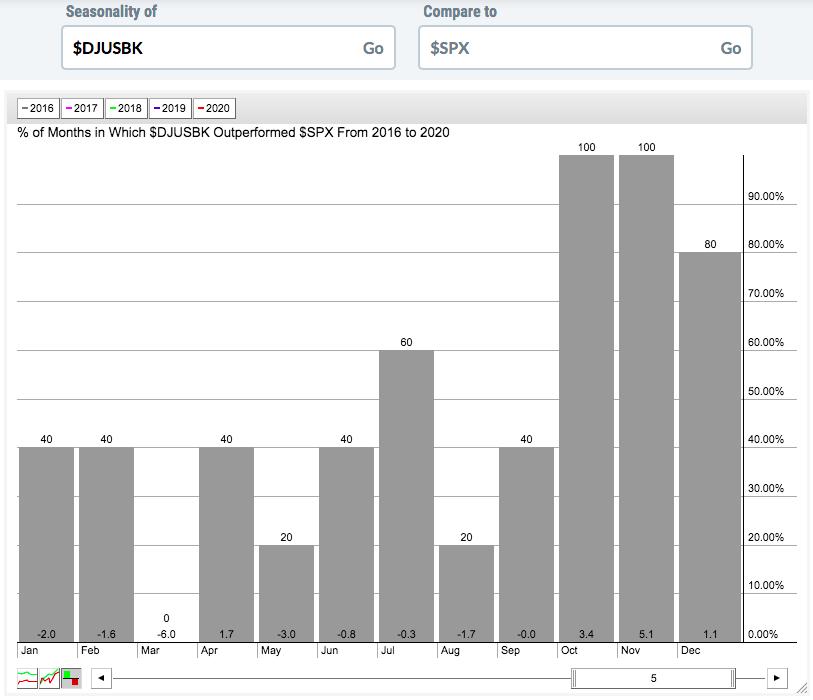
Banks ($DJUSBK) have been very strong in both October and November. In fact, if we look at just the past 6 years, banks have been dominant vs. the S&P 500. Check out this relative seasonality chart for banks over the past 6 years:
While I wouldn't do a whole lot of trading given the current market environment, here's a very short list of banks that have SCTRs above 70 (showing relative strength) and are included on our Strong Earnings ChartList (SECL) and Raised Guidance ChartList (RGCL):

I'm not saying I'd rush out and buy PNC today, but it too has a very strong track record during Q4:
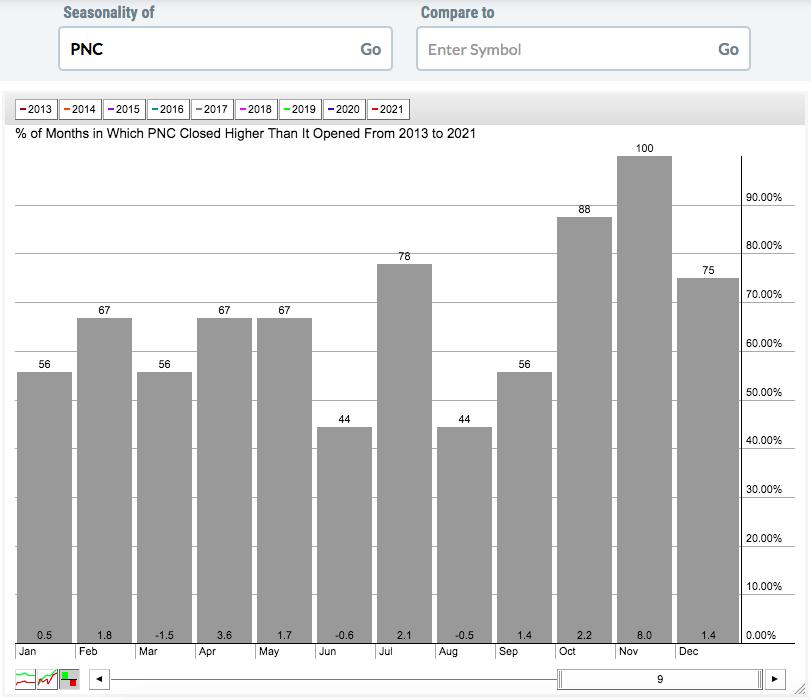
This is PNC's history since the 2013 breakout, which is when the secular bull market began, in my view. I'd say it's fairly obvious that PNC likes October through December. That would give me great confidence buying PNC on a pullback.
Earnings Reports
Here are the key earnings reports for the next two days, featuring stocks with market caps of more than $10 billion. I also include a few select companies with market caps below $10 billion. Finally, any portfolio stocks that will be reporting results are highlighted in BOLD. If you decide to hold a stock into earnings, please understand the significant short-term risk that you are taking. Please be sure to check for earnings dates for any companies you own or are considering owning.
Thursday, September 30:
PAYX, KMX, MKC, JEF, BBBY
Friday, October 1:
None
Economic Reports
Q2 GDP (Final): 6.7% (actual) vs. 6.7% (estimate)
Initial jobless claims: 362,000 (actual) vs. 335,000 (estimate)
September Chicago PMI: 64.7 (actual) vs. 65.3 (estimate)
Happy trading!
Tom