
EB Monthly Seasonality Report - September 2026
A Look Back At August Stocks:
Last month, we released our list of the top large, mid, and small cap stocks that had strong historical track records during the month of August. Here are how they performed in August 2026:
Large Caps
- WDAY: +23.99%
- CVNA: +16.50%
- NVDA: +8.98%
- DXCM: +8.50%
- PODD: -10.18%
Average Large Cap Return: +9.56%
S&P 500 (SPY) Return: +2.53%
NASDAQ 100 (QQQ) Return: +3.87%
Mid Caps
- APPF: +30.07%
- NTNX: +16.20%
- PCTY: +16.10%
- CPRI: -16.57%
Average Mid Cap Return: +11.45%
S&P 400 Mid Cap (MDY) Return: -0.03%
Small Caps
- TNDM: +12.56%
- XPEL: +10.73%
- PTGX: +6.54%
- BOOT: +1.62%
- PTCT: +1.43%
- GNW: +1.42%
- STAA: -6.03%
Average Small Cap Return: +4.04%
Russell 2000 Small Cap (IWM) Return: +0.69%
The percentages represent the returns from the July 31st close to the August 31st price at roughly 3:00pm ET. The average performance of our August seasonality stocks in each asset class - large cap, mid cap, and small cap - beat their benchmark index for the 2nd straight month, so I'd say it was another solid performance month for our seasonal stocks.
S&P 500 September Performance
The annualized performance of the S&P 500 (since 1950) during the month of September is -7.39%, which ranks dead last (12th) among all calendar months. September has risen 34 times and fallen 42 times since 1950, representing the only calendar month that loses ground more often than it gains. The annualized return in September on the NASDAQ is slightly worse, falling 8.42%. The small cap Russell 2000 (IWM) isn't much better, as September produces an annualized return of -5.21% since 1988.
Here's a breakdown of the historically strong and weak performance periods throughout September on the S&P 500 since 1950. The %'s shown are the ANNUALIZED returns for the period:
- September 1-3: +26.47%
- September 4-10: -13.93%
- September 11-19: +10.19%
- September 20-26: -42.72%
- September 27-28: +36.53%
- September 29-30: -52.94%
September can begin the month on solid footing as the annualized return for the first 3 days shows. After that, however, the bulls have some fairly slim pickings. The September 20-26 week is the 2nd worst week of the entire year historically, trailing only October 21-27.
Sector Performance
Last month, I again pointed out that technology (XLK) tended to lead during the month of August and here's the sector leaderboard for the past month:
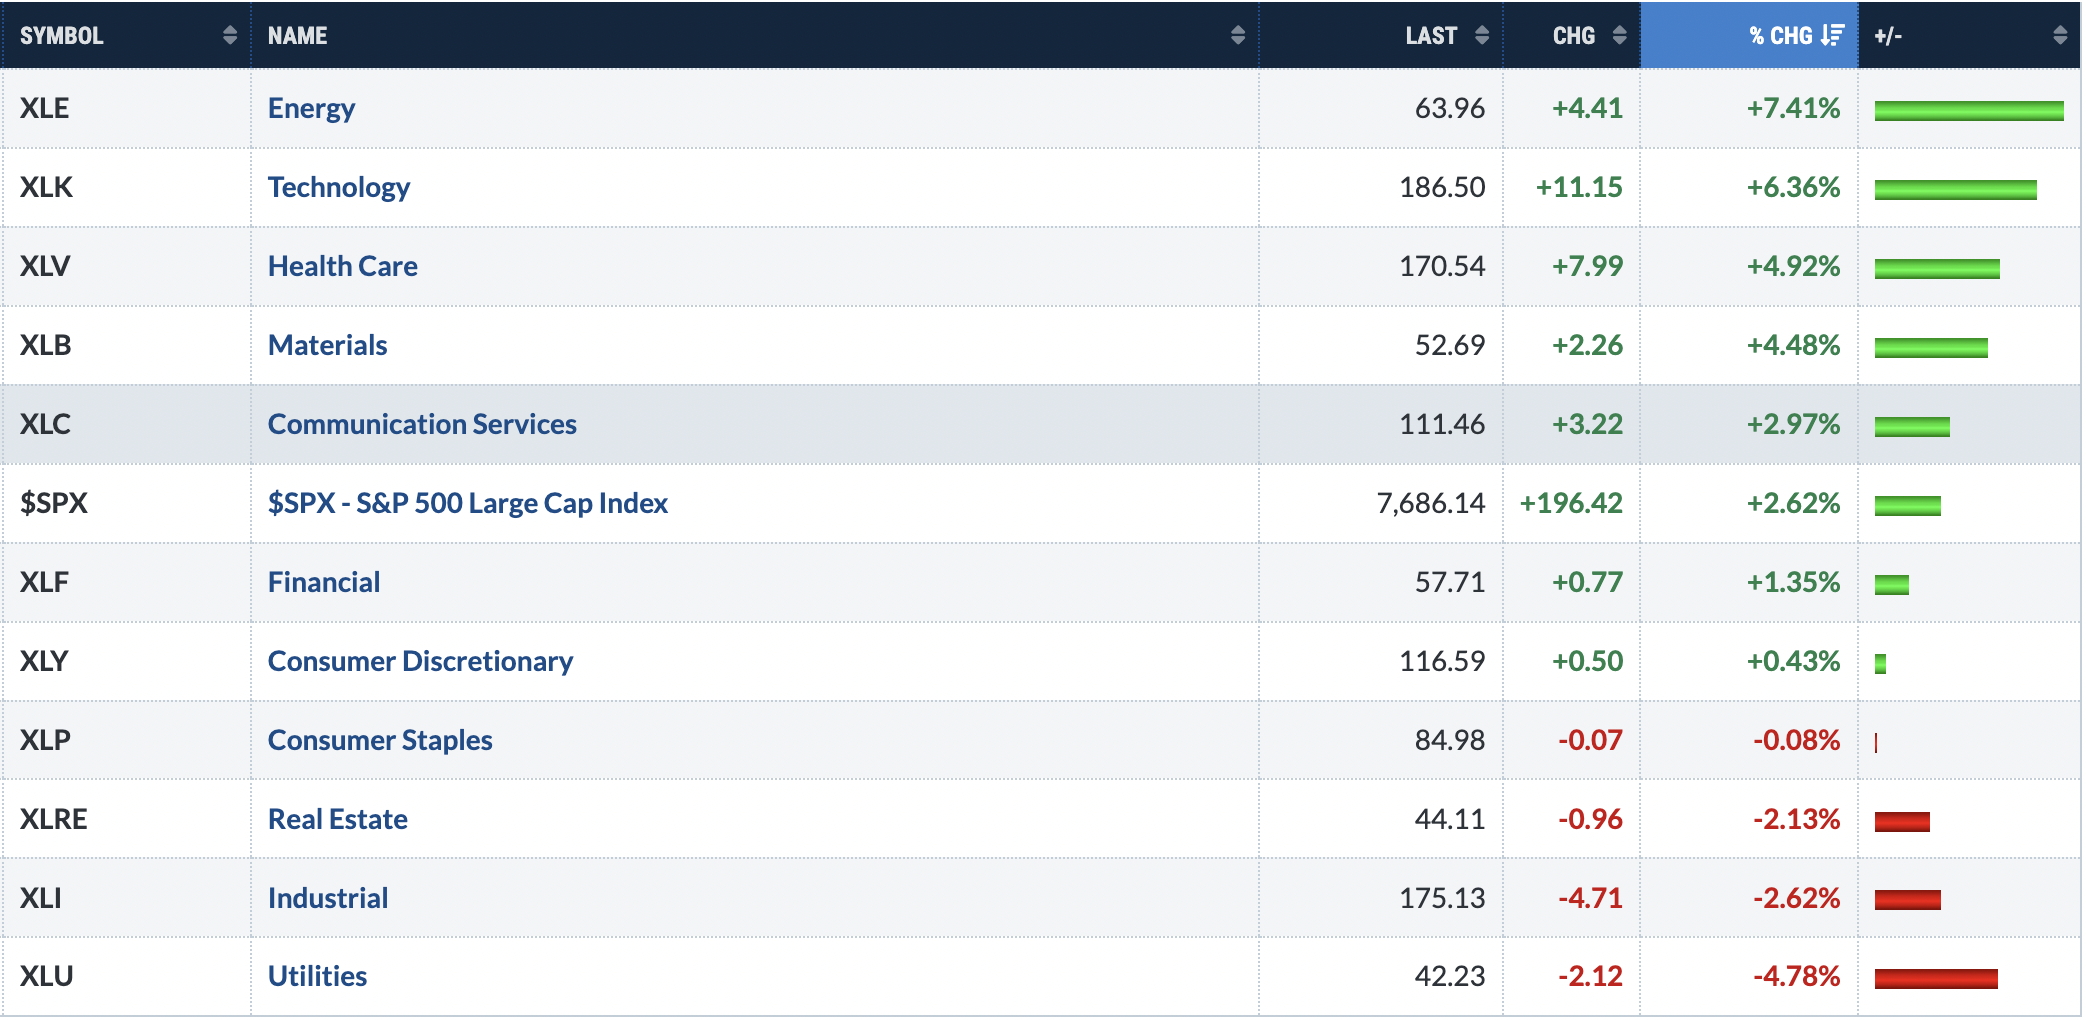
Only energy (XLE) outperformed technology over the past month as history held its form, at least with respect to the XLK.
As we look ahead to September, consumer discretionary (XLY) and industrials (XLI) have historically performed best, with the former outperforming the benchmark S&P 500 by an average of +0.9% during September since the confirmation of the secular bull market back in 2013. The current XLY chart, however, leaves something to be desired technically:
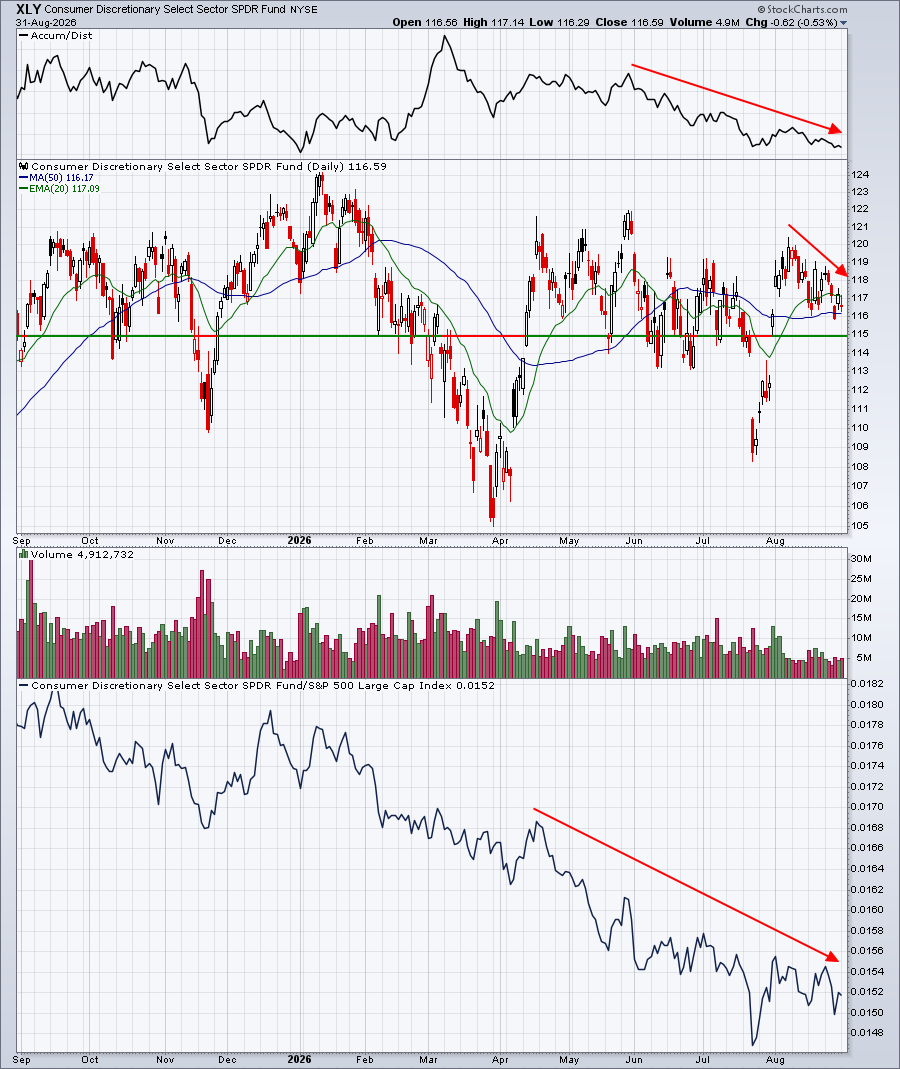
Relative strength has been awful for many months. Part of that is because technology has been so strong, but even on an absolute basis, there's not much to like about the XLY. The AD line isn't exactly showing that Wall Street is beaming with confidence either. So let's step into September possibly by dipping our toes in the water, not by diving in. Technically, the XLY picture grows worse if 115 support is lost.
Industry Performance
Automobiles ($DJUSAU) has been the group where we've seen the most September strength among discretionary stocks in the past. It's interesting, because DJUSAU has begun to show emerging signs of strength as we close out August:
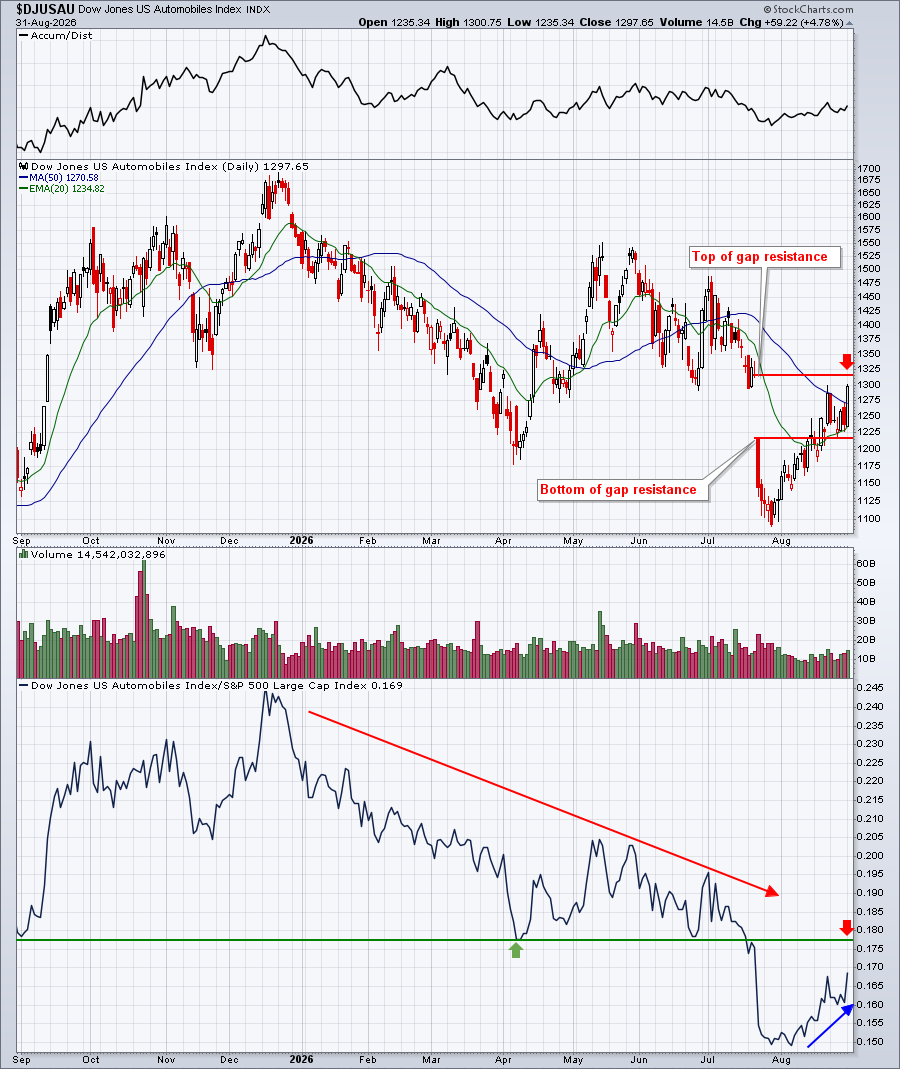
The upcoming gap resistance will likely be formidable, so whether the DJUSAU can clear this hurdle will likely answer the group's question about September 2026 strength.
Here are all industry groups that tend to perform much better than the benchmark S&P 500 during September, broken down by sector:
Technology (XLK):
- semiconductors, electronic equipment, computer services
Consumer Discretionary (XLY):
- automobiles, home improvement retailers, recreational products, footwear
Communication Services (XLC):
- fixed line communications
Industrials (XLI):
- heavy construction, defense, airlines, railroads, commercial vehicles & trucks
Financials (XLF):
- life insurance, insurance brokers
Health care (XLV):
- none
Consumer staples (XLP):
- brewers
Real estate (XLRE):
- none
Utilities (XLU):
- none
Energy (XLE):
- coal
Materials (XLB):
- none
Stocks for September
A "Seasonality - September 2026" ChartList (annotated with 1 or 2 support levels to watch) will be created tomorrow and should be available by end of day on our website.
You must be a StockCharts.com Extra or Pro member to download our ChartLists. Basic members and non-StockCharts.com members can view the charts one at a time.
Happy trading!
Tom