
EB Monthly Seasonality Report - July 2026
A Look Back At June Stocks:
Last month, we released our list of the top 30 large, mid, and small cap stocks that had strong historical track records during the month of June. Here are how they performed in June 2026, in order of best to worst performer:
- ACMR: +46.59%
- GKOS: +35.23%
- ELF: +32.14%
- VCYT: +26.74%
- PTGX: +23.12%
- KRYS: +20.27%
- MEDP: +18.45%
- LNTH: +11.72%
- RH: +10.94%
- WING: +10.48%
- TWLO: +8.23%
- ANET: +6.53%
- GNRC: +5.36%
- EW: +4.61%
- XYZ: +0.37%
- LITE: +0.36%
- APPF: -0.51%
- BOOT: -3.30%
- TSLA: -3.49%
- STAA: -4.01%
- WOR: -5.30%
- FOXF: -6.10%
- DXCM: -8.67%
- CVNA: -9.84%
- CELH: -11.99%
- FN: -14.08%
- AVGO: -15.45%
- RUN: -19.98%
- NOW: -20.17%
- AVAV: -20.35%
The percentages represent the returns from the May 31st close to the June 30th close. The average performance of the 12 large cap stocks (-3.85%) trailed the S&P 500 (-1.28%) and the NASDAQ 100 (QQQ, -0.26%). The average performance of the 18 mid and small cap stocks (+9.12%), however, crushed the small cap Russell 2000 (IWM, +3.45%) as well.
June was an excellent seasonality month for our small and mid cap stocks, but not so much for our large cap selections.
S&P 500 July Performance
The annualized performance of the S&P 500 (since 1950) during the month of July is +15.53%, which ranks 4th among all calendar months, trailing only November, December, and April. Over the past 14 years and since this secular bull market was confirmed in 2013, July has only trailed November in performance. And over the past 20 years, July has been the best calendar month in terms of annualized performance. July has risen 46 times and fallen 30 times since 1950.
Here's a breakdown of the historically strong and weak performance periods throughout July on the S&P 500 since 1950. The %'s shown are the ANNUALIZED returns for the period:
- July 1-17: +26.60%
- July 18-23: -15.64%
- July 24-31: +18.52%
Sector Performance
Last month, I pointed out that technology (XLK) and consumer discretionary (XLY) tend to lead during the month of June. Neither performed particularly well in June, although the XLY did outperform the XLK. Value stocks ended up performing best as health care (XLV), industrials (XLI), and financials (XLF) were the clear June winners.
For July, both technology (XLK) and consumer discretionary again typically perform best. Both the XLK and XLY are consolidating, but the XLK is in a symmetrical triangle, which is a bullish continuation pattern:
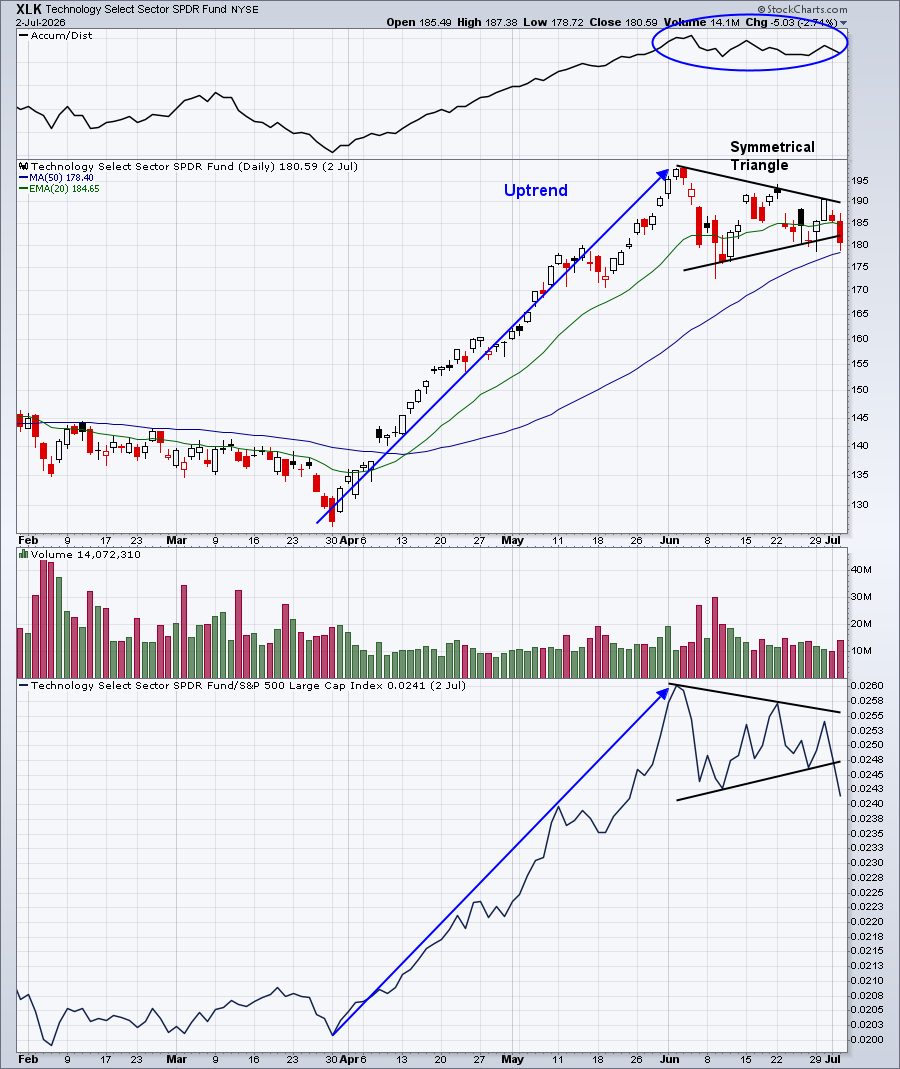
XLK's relative strength is also in a bullish symmetrical triangle pattern. Therefore, I'd continue to stick with the group as we approach another, what should be, strong earnings season.
Industry Performance
Last month, I pointed out software ($DJUSSW) has broken out and that the group loves the month of June. So naturally, I felt like we were about to see an even bigger rally in the space. I was wrong, plain and simple. The group does like June, but it didn't like June 2026, although strength did return at the end of the month. Perhaps that will continue into July and ahead of a better-than-expected earnings season? Time will tell.
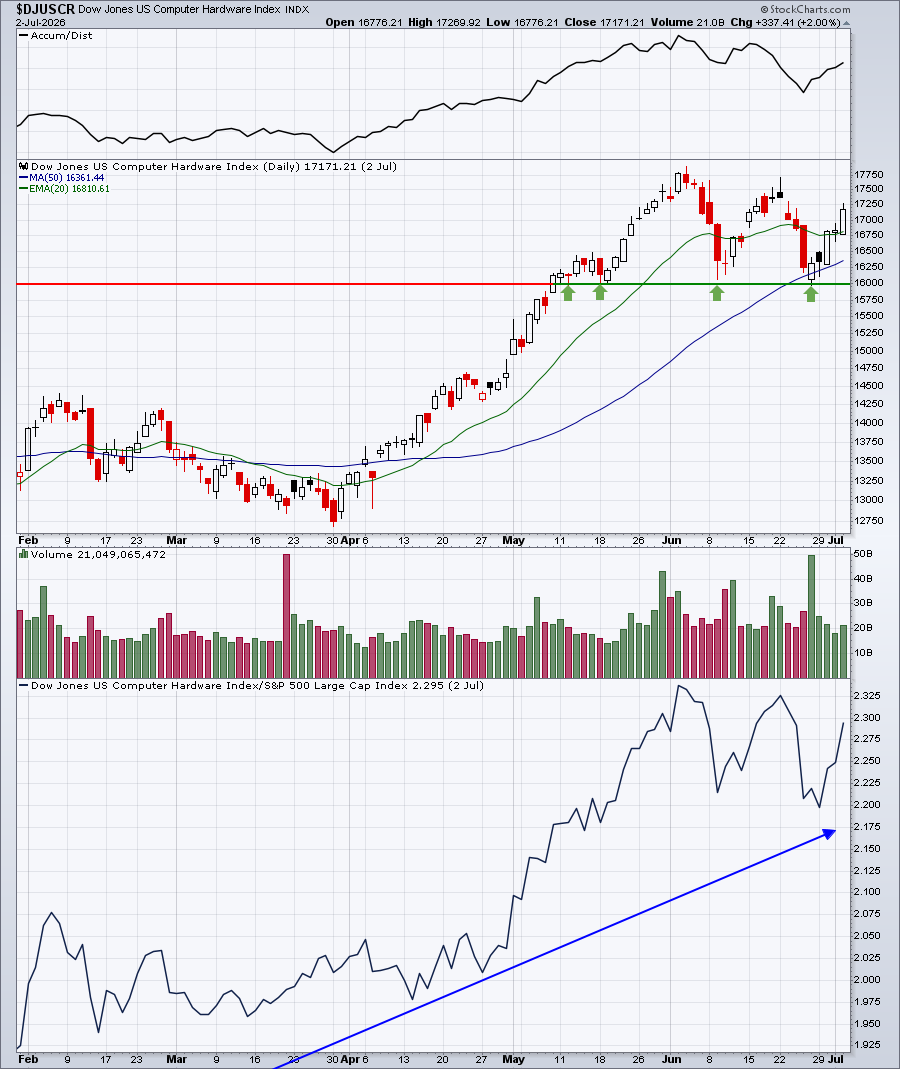
For July, should the bullish symmetrical triangle pattern lead to higher prices in the XLK, renewable energy ($DWCREE) and computer hardware ($DJUSCR) both have solid seasonal records in July. I like both heading into July, but the DJUSCR is just now bouncing off a 50-day SMA test, so I think I prefer this group:
Here are all industry groups that tend to perform much better than the benchmark S&P 500 during July, broken down by sector:
Technology (XLK):
- renewable energy, computer hardware, electrical components & equipment
Consumer Discretionary (XLY):
- recreational services, automobiles, broadline retailers, home construction, business training & employment agencies, home improvement retailers
Communication Services (XLC):
- internet
Industrials (XLI):
- trucking, building materials & fixtures
Financials (XLF):
- specialty finance, mortgage finance, financial administration, asset managers, investment services
Health care (XLV):
- biotechnology
Consumer staples (XLP):
- none
Real estate (XLRE):
- real estate services, industrial & office REITs
Utilities (XLU):
- water
Energy (XLE):
- coal
Materials (XLB):
- steel, paper
Stocks for July
A "Seasonality - July 2026" ChartList (annotated with 1 or 2 support levels to watch) will be created later today or tomorrow and should be available by tomorrow on our website.
You must be a StockCharts.com Extra or Pro member to download our ChartLists. Basic members and non-StockCharts.com members can view the charts one at a time.
Happy trading!
Tom