
EB Weekly Portfolio Report - Sunday, September 22, 2019
Portfolio Rules and Objectives
Here are the common traits and objectives of each portfolio:
- There are 10 leading stocks from 10 leading industries in each portfolio
- They are held for an entire 90 day period, with no stops in place
- Every stock will be held through ONE earnings report
- The expectation is that relative winners will carry the portfolio to outperformance
- They are all entered into as of the 19th close in February, May, August, and November (these dates are used as we are generally past the majority of earnings reports by these dates)
- Primary objective is outperform the benchmark S&P 500
Here are several considerations for EB members:
- I would expect the Aggressive portfolio to be the riskiest, followed by the Model portfolio, and then the Income portfolio
- The Income portfolio stocks will all pay dividends, with the expected average dividend yield to be at least 1.5%
- Drawdowns (losses) should be much milder on the Income portfolio, with much more volatility on the other two
- You should own or trade these stocks in whatever manner is most comfortable to you; while we buy all 10 stocks as of the dates identified above, feel free to trade certain stocks or wait for pullbacks if the stocks are overbought
- We have no idea what risk each member is willing or able to take. We are not registered investment advisors so be sure you understand the risk you take.
- EarningsBeats.com shareholders/employees may own all or some of the portfolio stocks from time to time.
Weekly Summary
Benchmark S&P 500:
I compare performance to the S&P 500 so it's always a good idea to see what this benchmark index did before we gauge performance of our portfolios.
The S&P 500 lost 0.51% last week as the all-time record closing high of 3025 was approached (SPX hit 3021 before selling off). It's not unusual to see selling kick in near such an important milestone and it's worth noting that quad witching options expiration was Friday, September 20th. Quad witching occurs every quarter on the 3rd Friday of March, June, September, and December. Also, the September 20-26 week is one of the worst weeks of the year historically. The S&P 500 has produced annualized returns of -38.88% during this week since 1950. So don't be shocked if we see lower prices in the week ahead. Here's the current weekly view:
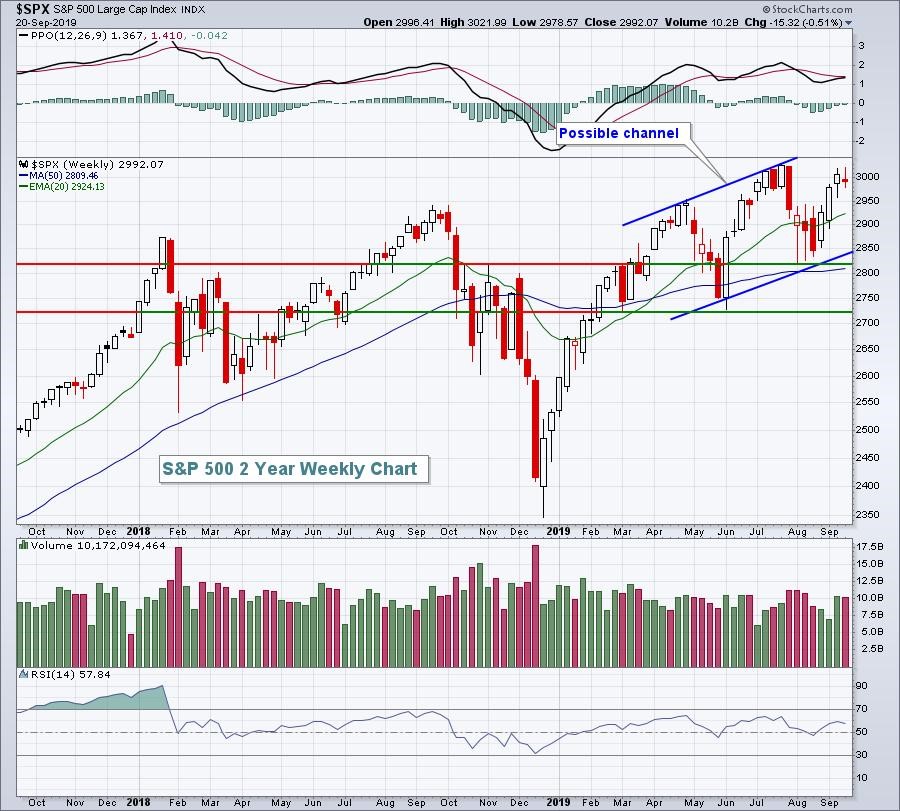
Weekly RSI remains well above 40, suggesting the current uptrend is alive and well. Potential channel support is close to 2850 with key price support levels at 2820 and 2725. I believe the S&P 500 is poised to break out heading into Q4 earnings season as that is typically the case for equity prices approaching earnings season.
Model Portfolio:
The strength in this portfolio was masked last week due to a horrible showing by Roku, Inc. (ROKU), which plunged roughly 27% after sellers bombarded the stock following reports of increased competition and a SELL rating issued by one financial firm and a target price of $60. While that type of drop is always unsettling, let's keep in mind that ROKU, prior to its last blowout earnings report, was trading at just under $100. Friday's close was $108. It was a truly bad week for the stock, but technically-speaking we should never rule out a gap support test. Therefore, keep an eye on ROKU's gap support as follows:
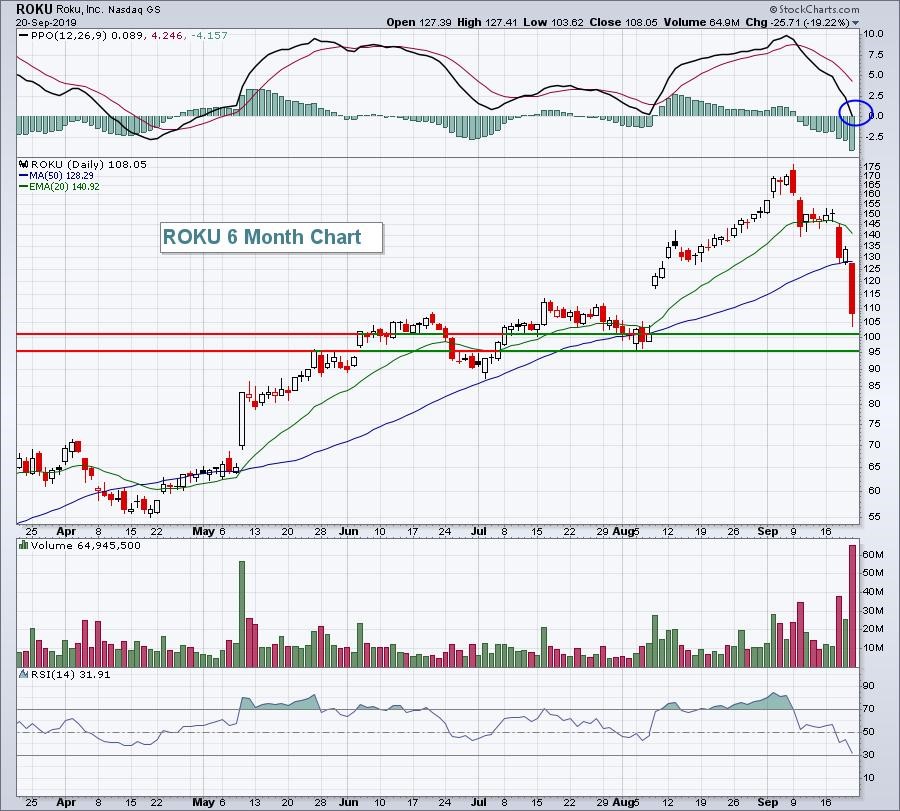
There was a lot of panic selling last week and, personally, I believe it was way overdone. Everything in the market moves to extremes. Two weeks ago, ROKU was poised to take over its industry. Now it can't find a buyer. I look for the stock to find a support level this week in the range provided above and start to rebound. We'll see.
But as I mentioned above, the Model portfolio actually had a solid week. Here were the weekly results:
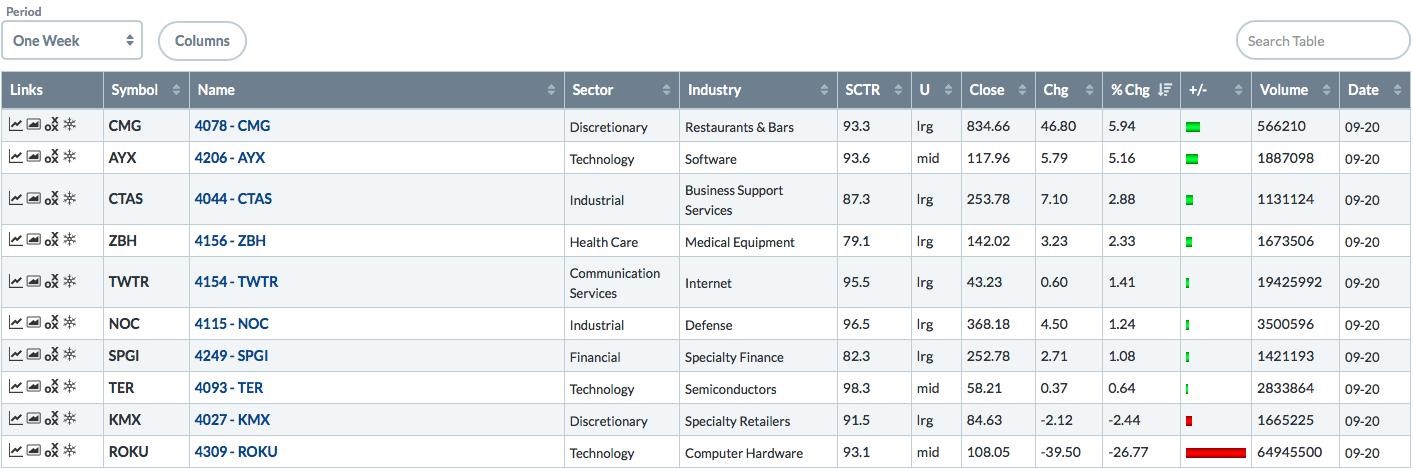
Given the S&P 500's 0.51% drop, the Model portfolio having 8 stocks in positive territory is a very good sign. Obviously, we need to see a strengthening ROKU to help right the ship here. In my Saturday webinar where I discussed the market's reaction to the Fed's latest policy statement, Model portfolio stocks performed extremely well from Wednesday's post-Fed low to Thursday's morning intraday high. 9 of 10 Model stocks outperformed the S&P 500 during that stretch and I believe that bodes well for future performance heading into earnings season.
Aggressive Portfolio:
Let's start with that weekly performance chart for all Aggressive portfolio stocks:
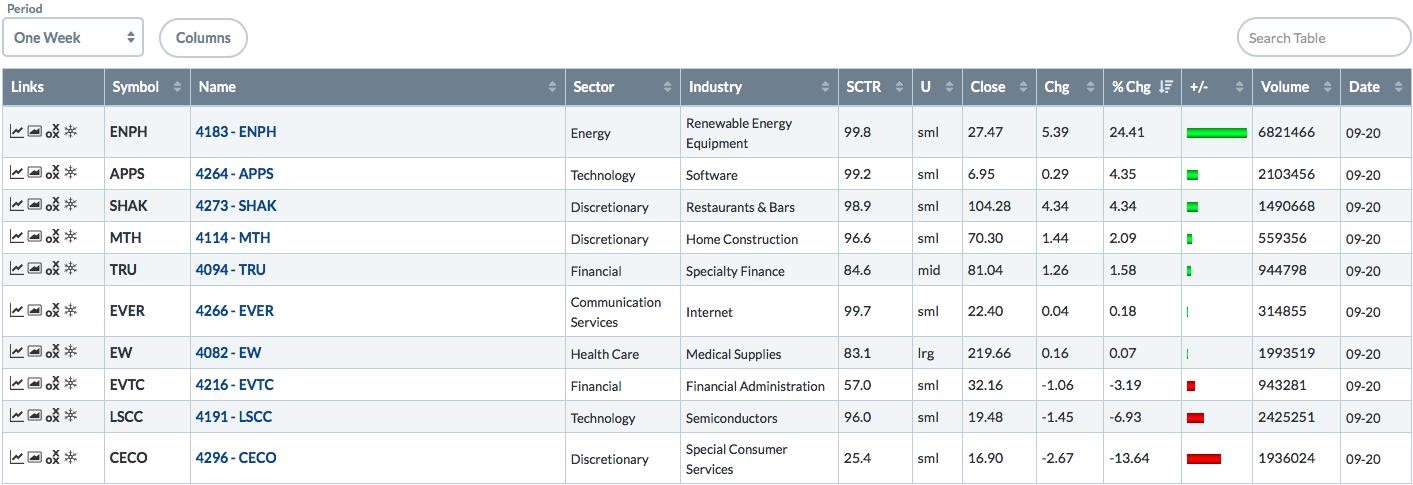
A few points here:
(1) Note the rebound in ENPH shares. I've had members write to me and ask about ENPH as it had been dropping rapidly in recent weeks. While we never want to see any selling in any of our portfolio stocks, it's not unusual to see stocks revert to gap support, as painful as it can be. I wrote then that I thought ENPH, once it broke the top of gap support had an increased chance of testing its lower gap support. Both are shown in the chart below:
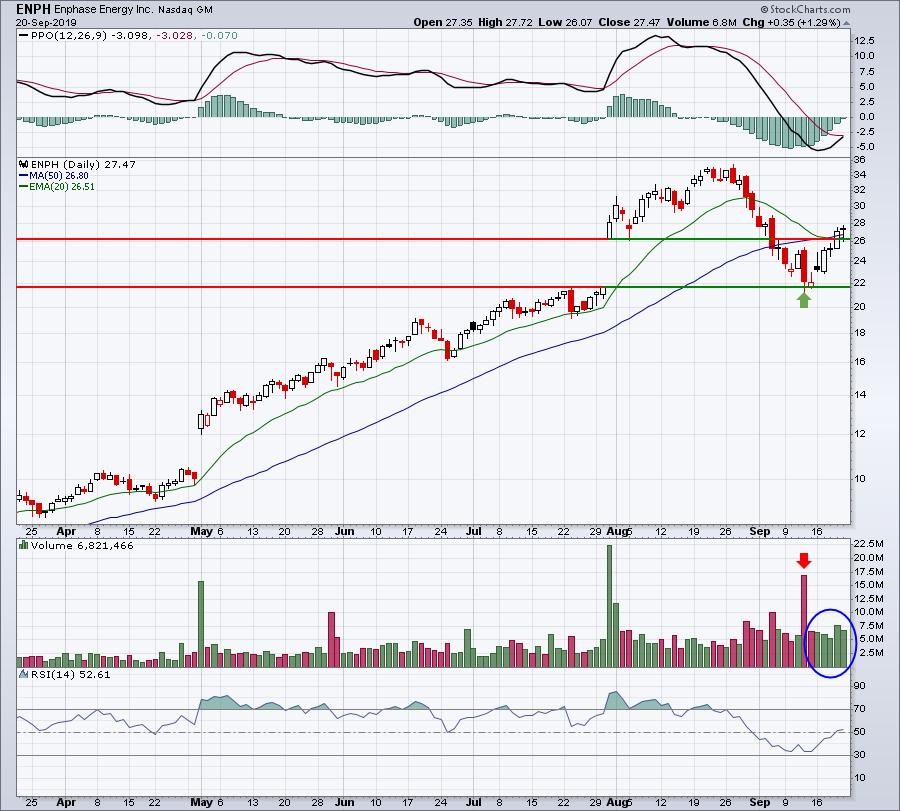
We could be in for more consolidation with ENPH, although the best scenario would include a continuing trend higher with rising 20 day EMA holding as support.
(2) Like the Model portfolio, most of the Aggressive portfolio stocks rose last week (7 of 10) with 7 outperforming the S&P 500.
(3) Of those losing ground, I'm concerned about CECO. In fact, it's the only one in all three portfolios that I believe has become technically-bearish. Yes, ROKU has had two awful weeks, but it's still above its earnings-related gap support. CECO seems to have lost all important support levels, along with relative support. We plan to hold all of our stocks through November 19, when we unveil our new lists. But if I were to sell one, CECO would probably be the one. Watch for a test of its declining 20 day EMA. That would be a solid place to reduce losses a bit and exit. But again, for purposes of our portfolio performance, WE WILL NOT SELL CECO OR ANY OTHER PORTFOLIO STOCKS.
Here's the updated chart and my current analysis on CECO:
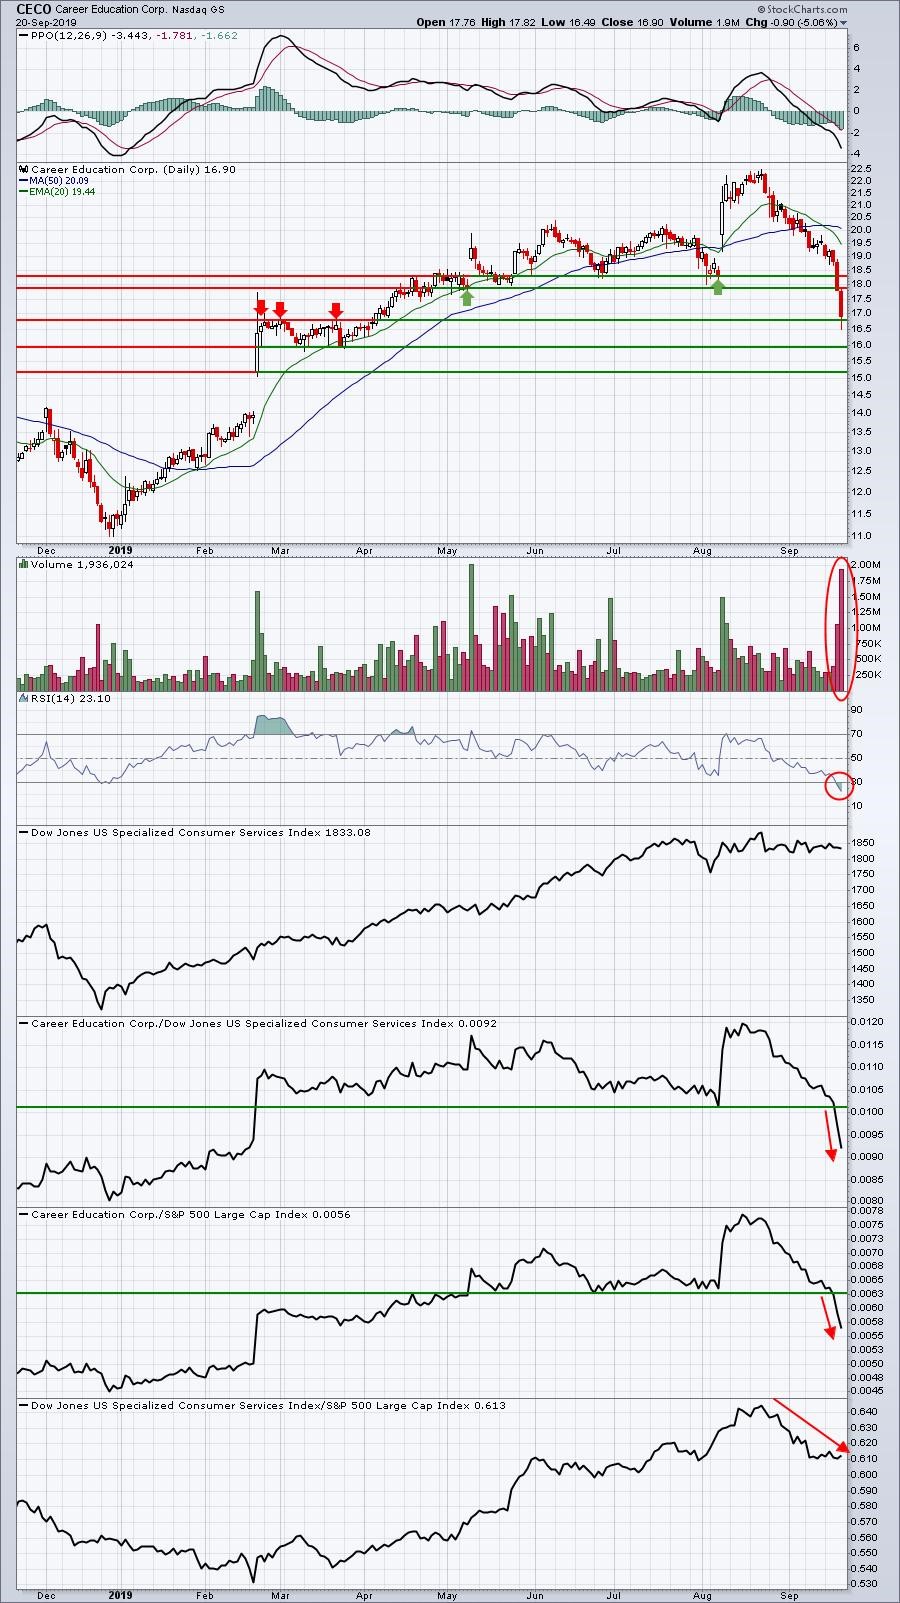
Those top two support lines are key gap support levels from prior earnings reports. Both were lost lat week on extremely heavy volume. CECO's industry group, $DJUSCS, hasn't been that bad on an absolute basis, although it has lost some relative strength. Still, CECO should not be acting like this. Breaking to 9 month relative lows is not what we want from our portfolio stocks. Also, uptrending stocks typically hold RSI support in the 40-50 range. CECO hit an RSI reading of 23 at Friday's close. Finally, CECO's SCTR score fell to 25, well below its other Aggressive portfolio peers. Like I said, this is the one stock that's not looking very good technically. An oversold bounce could be used to exit. It may run into overhead supply issues in the 18.00-18.50 area, should it get there.
Aggressive Portfolio:
Here's a look at last week's performance:
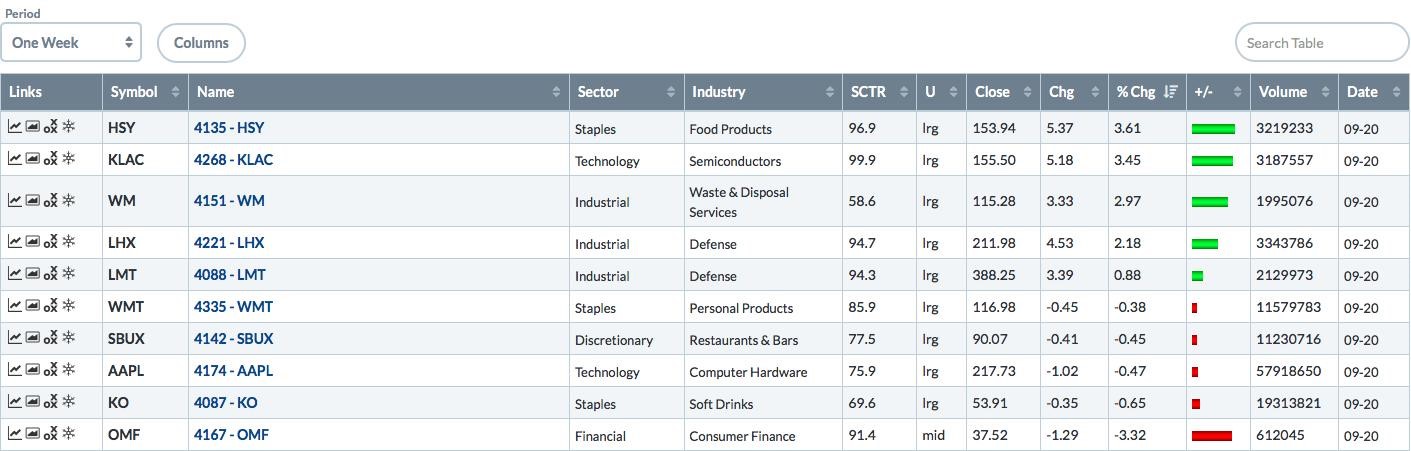
It wasn't a bad week for the Income portfolio with only one stock, OMF, significantly underperforming the benchmark S&P 500. Fortunately, OMF's underperformance was nothing like ROKU or CECO in the other two portfolios. 8 Income portfolio stocks outperformed the S&P 500, while 5 finished in positive territory.
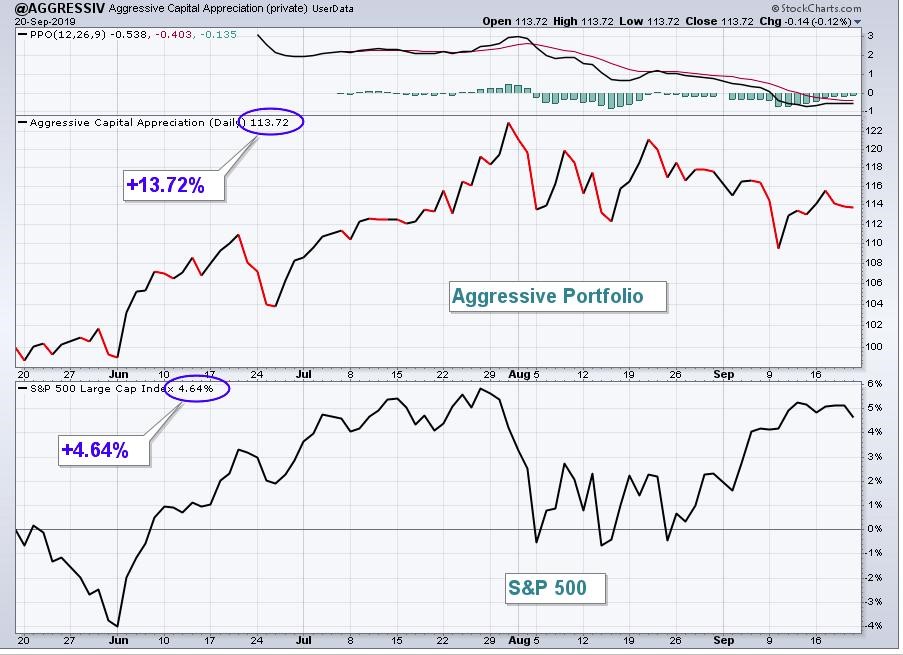
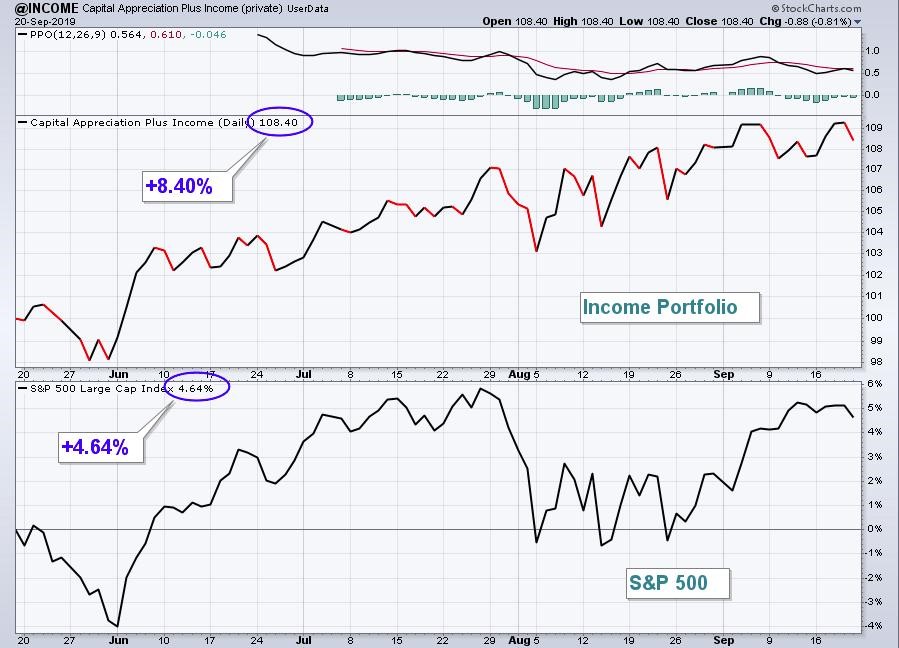
Performance Since Inception:
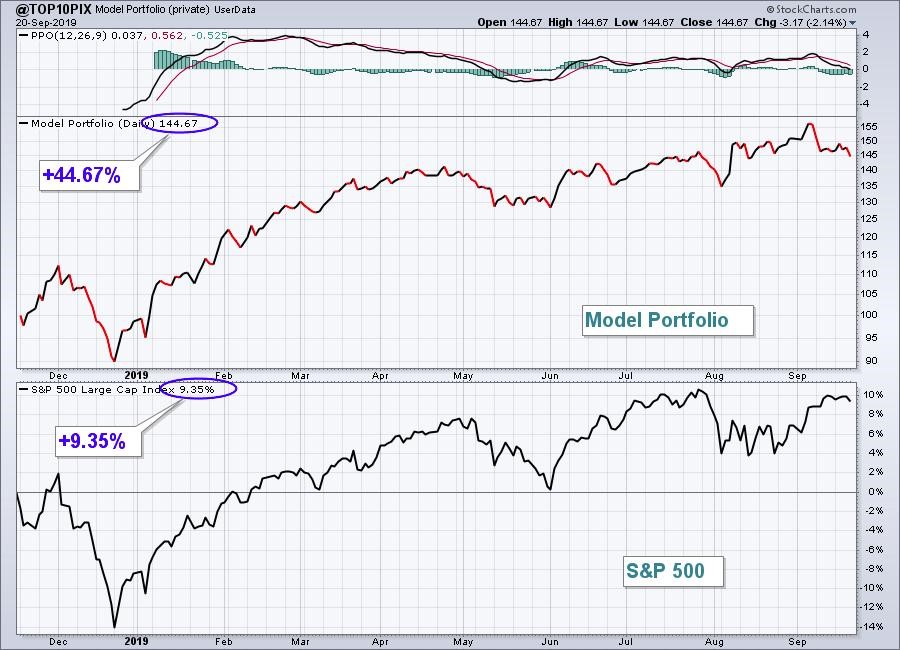
Model Portfolio:
Aggressive Portfolio:
Income Portfolio:
Summary
I think you can get a real sense of the volatility and risk associated with each portfolio by reviewing the performance history on the various charts above. Please, please, please make sure you are comfortable with the risks that you are taking in your investing/trading strategies.
I wish everyone a great week ahead!
Tom Bowley, Chief Market Strategist
EarningsBeats.com
"Better timing. Better trades."