
EB Weekly Portfolio Report - September 29, 2019
Portfolio Rules and Objectives
Here are the common traits and objectives of each portfolio:
- There are 10 leading stocks from 10 leading industries in each portfolio (at the time of selection)
- They are held for an entire 90 day period, with no stops in place
- Every stock will be held through ONE earnings report
- The expectation is that relative winners will carry the portfolio to outperformance
- They are all entered into as of February 19, May 19, August 19, and November 19 (these dates are used as we are generally past the majority of earnings reports by these dates)
- Primary objective is outperform the benchmark S&P 500
Here are several considerations for EB members:
- I would expect the Aggressive portfolio to be the riskiest, followed by the Model portfolio, and then the Income portfolio
- The Income portfolio stocks will all pay dividends, with the expected average dividend yield to be at least 1.5%
- Drawdowns (losses) should be much milder on the Income portfolio, with much more volatility on the other two
- You should own or trade these stocks in whatever manner is most comfortable to you; while we buy all 10 stocks as of the dates identified above, feel free to trade certain stocks or wait for pullbacks if the stocks are overbought
- We have no idea what risk each member is willing or able to take. We are not registered investment advisors so be sure you understand the risk you take.
- EarningsBeats.com shareholders/employees may own all or some of the portfolio stocks from time to time.
Weekly Summary
Benchmark S&P 500:
I compare performance to the S&P 500 so it's always a good idea to see what this benchmark index did before we gauge performance of our portfolios.
The S&P 500 lost 1.01% last week after nearly reaching the all-time record closing high of 3025 during the prior week. The September 20-26 week is one of the worst weeks of the year historically. The S&P 500 had produced annualized returns of -38.88% during this week since 1950 heading into this year. I mentioned last week that we shouldn't be shocked that if we finished lower last week. That's exactly what happened. Throughout the week in the EB Daily Market Report, I commented I was watching 2940-2960 in the short-term and thus far we've held that level. Here's the current weekly view:
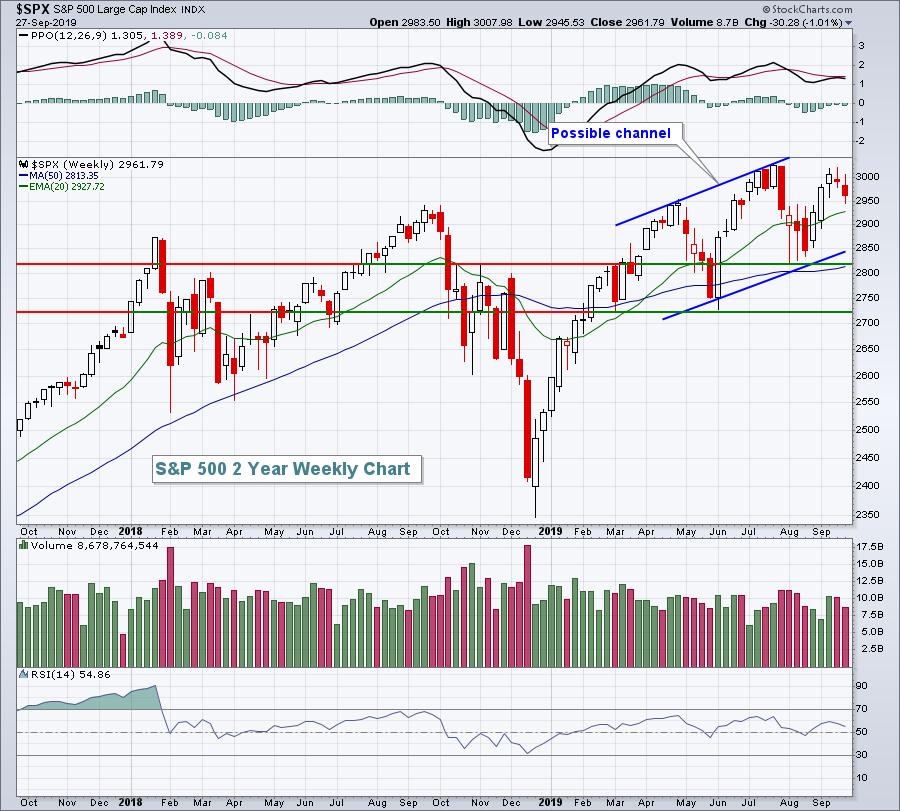
Weekly RSI remains healthy, above the key 40-50 support zone. While short-term selling is never fun, there was no damage to the weekly technical picture. While the S&P 500 could move in either direction this week, the tendency is to see strength as we end September and begin to move towards earnings season in October.
The opening week in October tends to be strong. Since 1950, the S&P 500 has produced annualized returns of +36.82% from October 1 through October 5 (covers Tuesday through Friday of the upcoming week). That's more than 4 times the normal 9% annual returns that we've enjoyed over those 70 years.
Model Portfolio:
The Model Portfolio fell 2.30% last week, underperforming the benchmark S&P 500. It added to prior underperformance from the current quarter, although there are most definitely pockets of strength. Before I get into individual performance, let's look at the Model Portfolio's chart since inception:
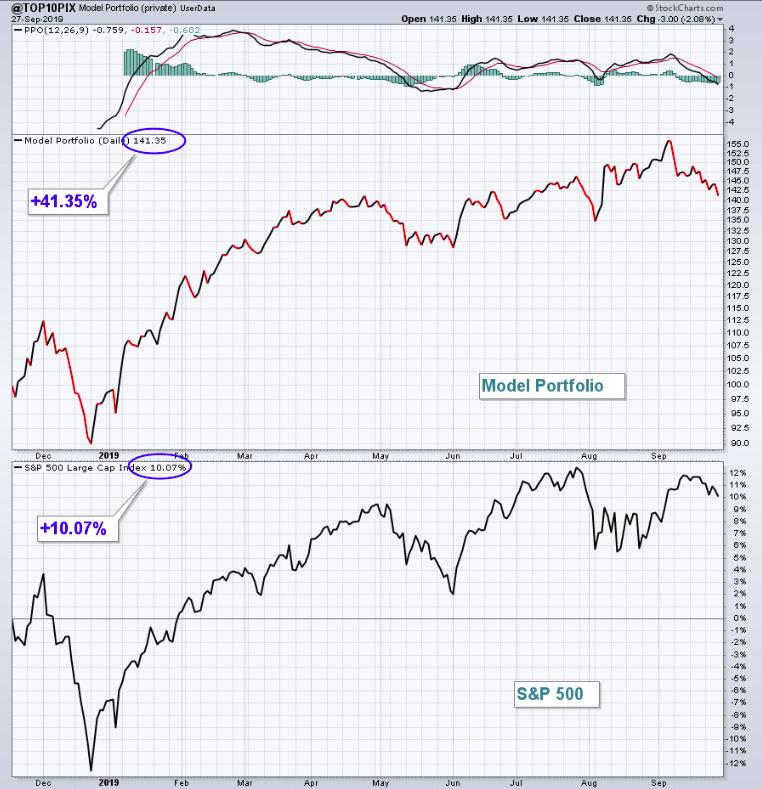
It's been a rough September for many growth stocks and our Model Portfolio offered few exceptions. Looking at individual stocks, here is how they performed last week:
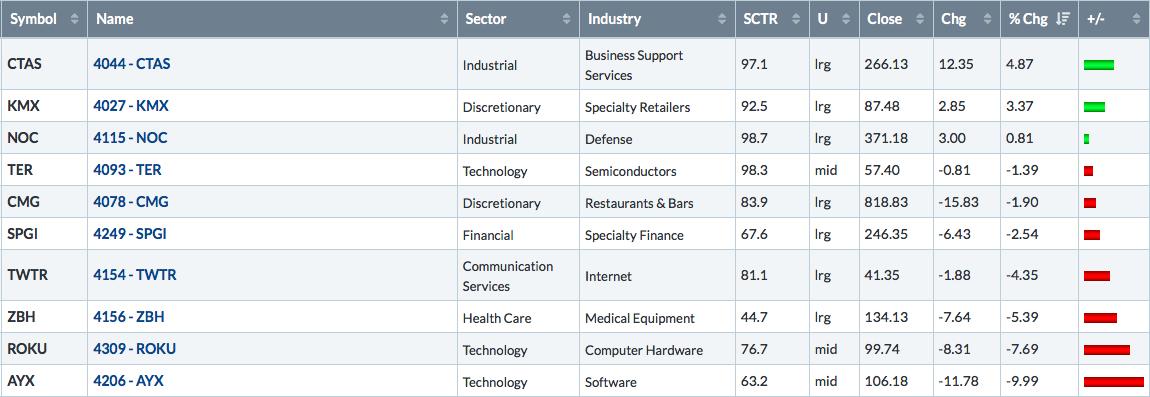
The good news is that the top two performers last week reported earnings. They were the first two stocks in our three portfolios to report this quarter and both beat revenue and EPS consensus estimates. Also, they clearly outperformed the S&P 500. Unfortunately, that's about where the outperformance ended. Alteryx, Inc. (AYX), a software stock, and Roku, Inc. (ROKU), a computer hardware stock, had very rough weeks and were mostly responsible for the Model Portfolio's underperformance last week.
AYX is being hurt by two factors - (1) underperformance of growth stocks and (2) underperformance by software stocks. The daily chart is definitely broken technically, but the weekly chart offers up hope as we move toward its earnings report on November 6th:
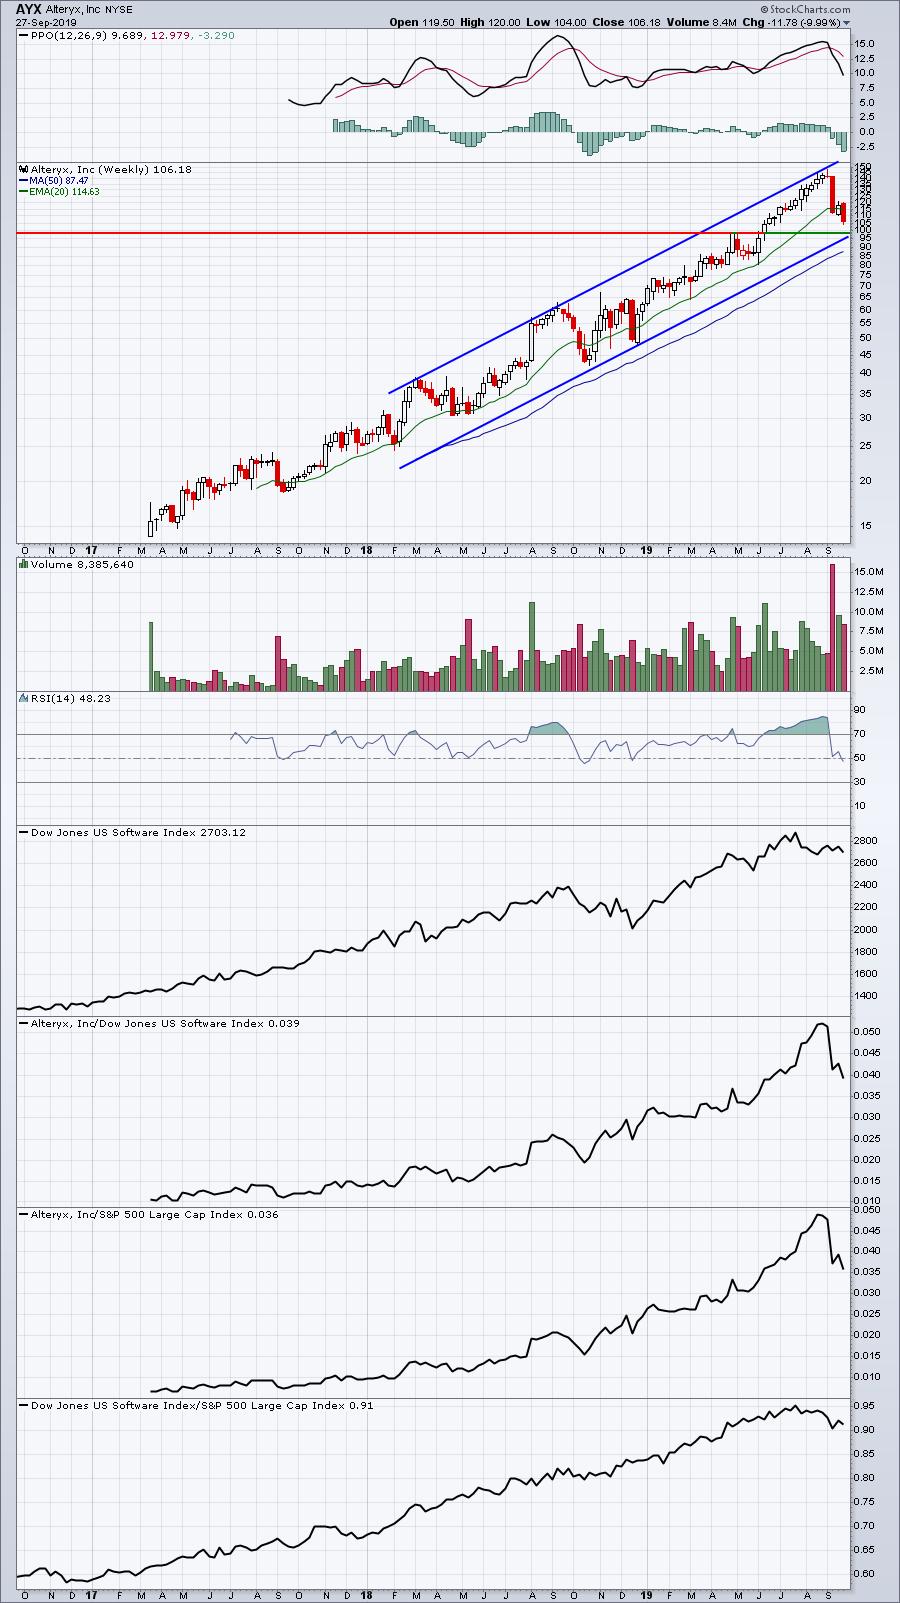
If I connect the recent highs and then drag that same sloped line down to connect the major low in December 2018, the lower channel line currently intersects just beneath 100, which also coincides with a significant price breakout near 98-99. That suggests if the market for growth stocks remains weak, AYX could see another 7-8% downside before hitting major channel support.
Aggressive Portfolio:
The Aggressive Portfolio saw a lot of selling last week with nearly every stock in the group selling off hard. That resulted in much of its "outperformance since inception" reversing. I know the group is extremely volatile, which is what we should expect, but downward price action/volatility is much tougher than the other way around. Here's the Aggressive Portfolio's chart since inception:
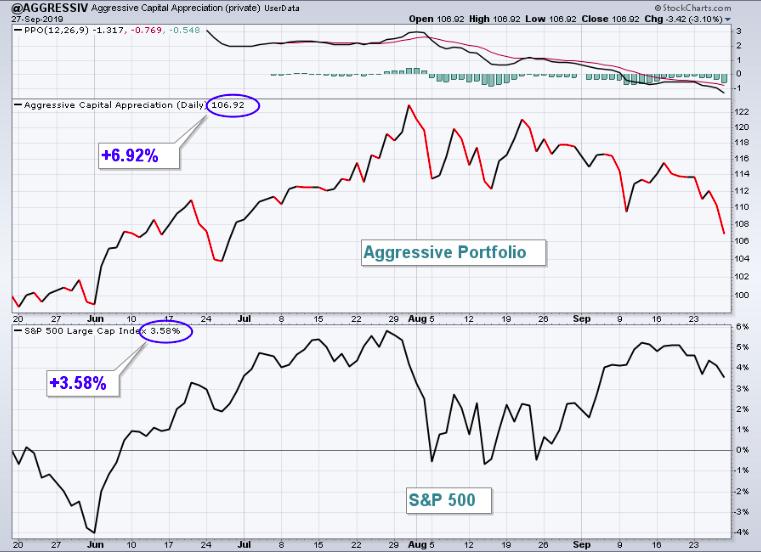
If you notice, much of that portfolio selling began in late-August. The best explanation I can give for it is that the overall market's appetite for growth stocks relative to value stocks has done an "about face", which is illustrated on this IWF:IWD chart:
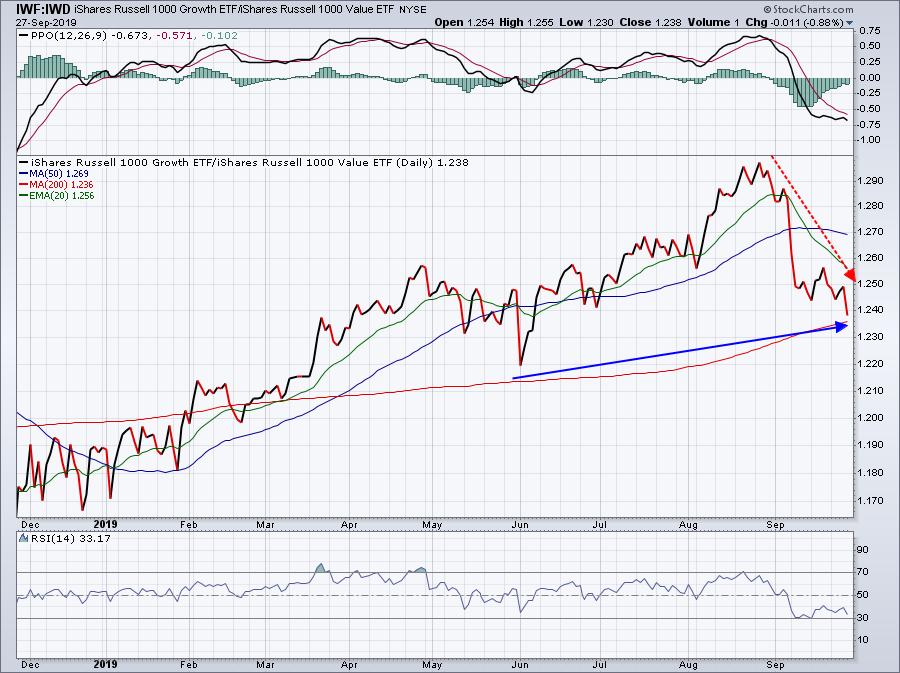
The last four weeks have erased the prior 3 months of relative gains, which is very similar to what we've experienced in the Aggressive Portfolio. I'm not ready to throw up the white flag to surrender, but last week was very painful as the following one week performance chart shows for each of our Aggressive portfolio stocks:
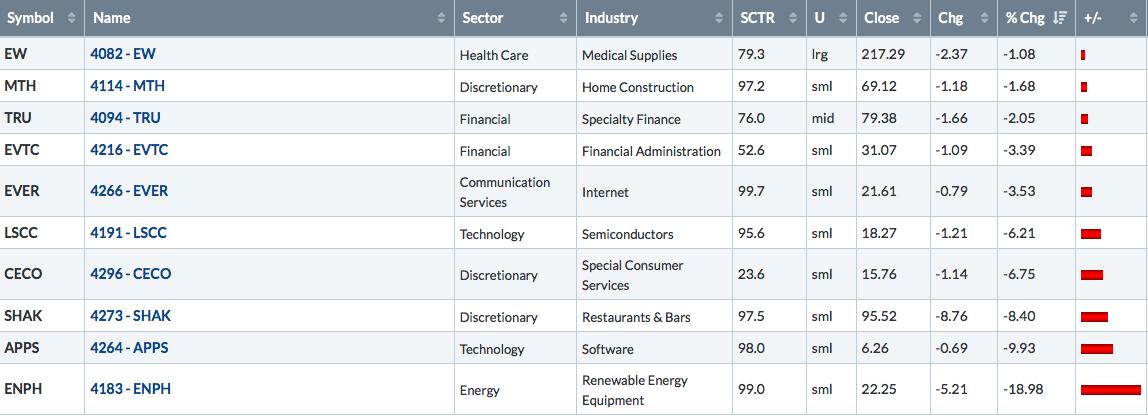
ENPH was the worst performer, returning close to key support highlighted last week at 21.65. So today, let me just show you key price support on APPS, which tumbled on Friday:
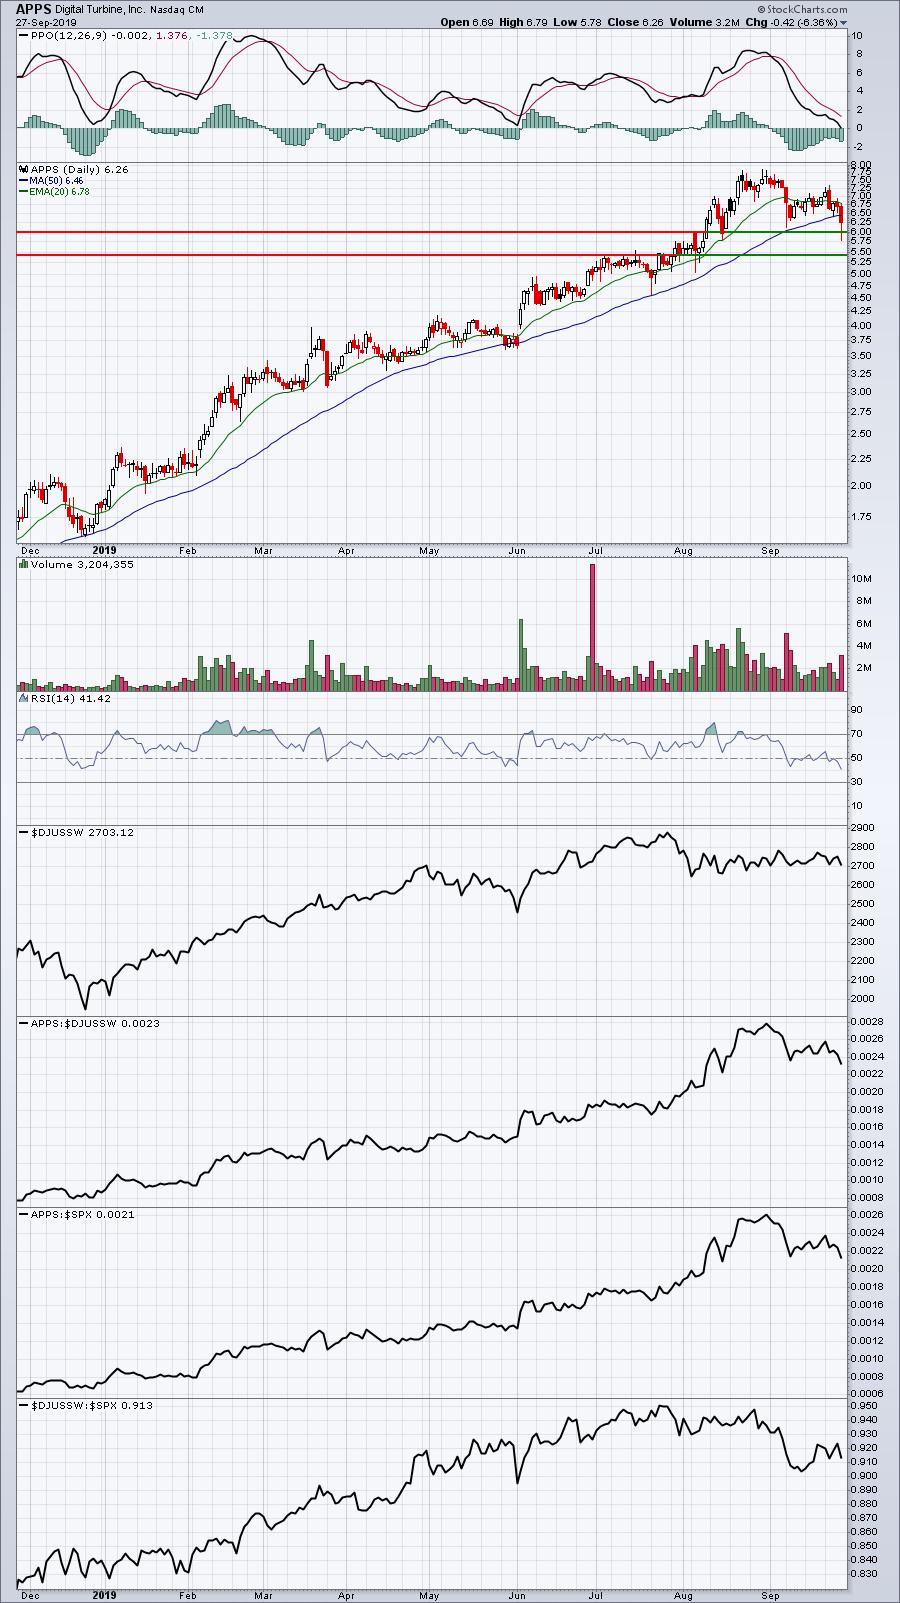
APPS had been a tremendous relative performer in software and it's extremely volatile. It managed to hold above 6.00 on Friday's close, even though it had a scary fall intraday beneath 5.80. RSI is now back close to 40 and the PPO is near centerline support. This is where we've seen APPS rally from in prior months, so perhaps we'll see a rebound as we open up October.
Income Portfolio:
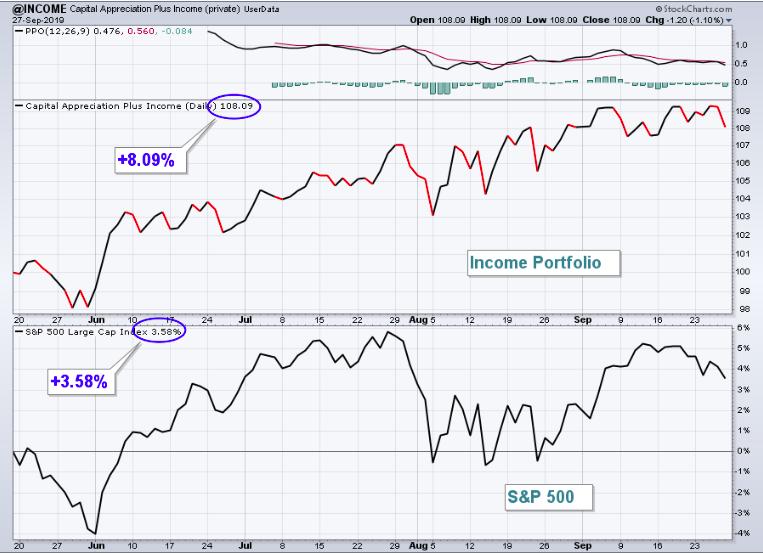
This portfolio is comprised of much larger companies that show relative strength, but not as dependent on capital appreciation as the other two portfolios. They all sport nice dividend yields and have been somewhat insulated from the deep selling in growth stocks that we've seen in recent weeks. Not too surprisingly, the Income Portfolio has easily been the best performing portfolio in August and September, and it even outperformed the benchmark S&P 500 last week. Here's the portfolio chart since its May inception:
As for individual performance, you can see from the chart below that there was not nearly the selloff in these mostly "household names" compared to what we saw in the Model and especially the Aggressive portfolio:
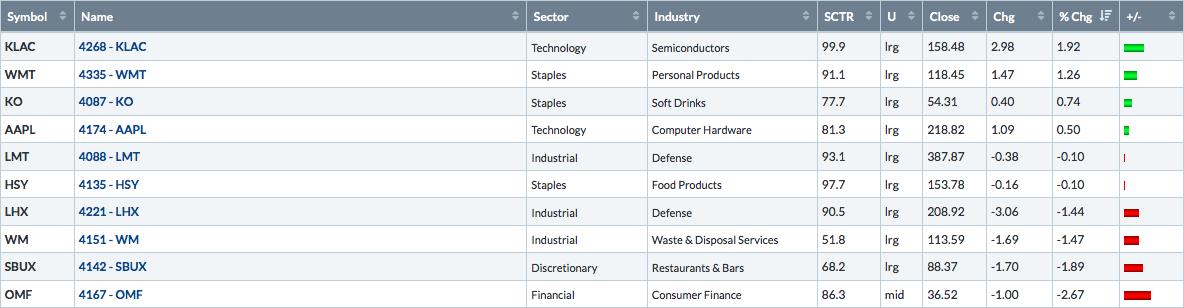
Overall, it really wasn't a bad week for this more conservative portfolio. KLAC continues to perform well as it's become one of the best semiconductor stocks to own. The weakest stock is clearly Starbucks (SBUX), which needs to close back above its 20 day EMA to begin to resume its prior uptrend:
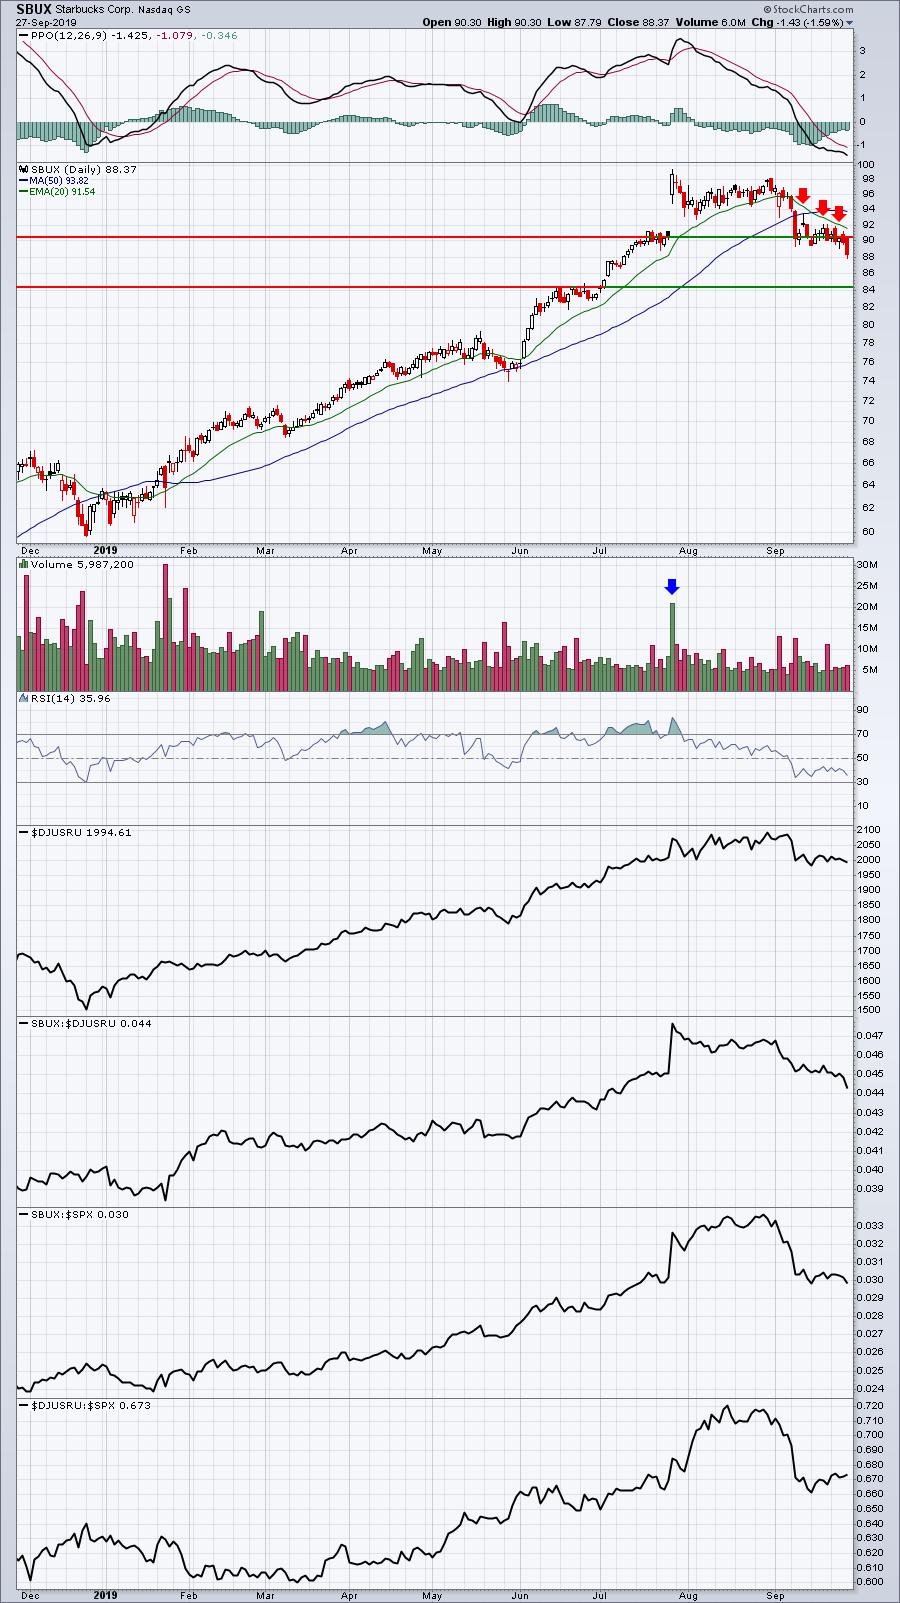
SBUX has been hit by its own profit warning, plus a restaurant & bar group that also is trading beneath its 20 day EMA. We'd like to see that reversal take place in the industry and for it to regain its 20 day EMA. Until that happens, SBUX is likely to continue to underperform.
Summary
The volatility over the past few weeks has certainly done damage in our portfolios. There's no sugar-coating that. Market participants have been gravitating towards value stocks and more defensive stocks over their growth and aggressive counterparts. I believe that's more of a seasonal trend as August and September can be difficult months for U.S. equities. The next several weeks will provide us very important information about what we might expect heading into Q4 earnings season and beyond. There are times when financials (XLF) and industrials (XLI) lead the market higher. That has not been the case in 2018 and 2019, but it definitely was the case in 2017 during the stock market's last major rise.
For now, we're looking for portfolio stocks, which had been leaders for months, to regain their footing and show strength heading into earnings season. That starts in just 2-3 weeks!
I wish everyone a great week ahead!
Tom Bowley, Chief Market Strategist
EarningsBeats.com
"Better timing. Better trades."