
EB Weekly Portfolio Report - November 3, 2019
Portfolio Rules and Objectives
Here are the common traits and objectives of each portfolio:
- There are 10 leading stocks from 10 leading industries in each portfolio (at the time of selection)
- They are held for an entire 90 day period, with no stops in place
- Every stock will be held through ONE earnings report
- The expectation is that relative winners will carry the portfolio to outperformance
- They are all entered into as of February 19, May 19, August 19, and November 19 (these dates are used as we are generally past the majority of earnings reports by these dates)
- Primary objective is to outperform the benchmark S&P 500
Here are several considerations for EB members:
- I would expect the Aggressive portfolio to be the riskiest, followed by the Model portfolio, and then the Income portfolio
- The Income portfolio stocks will all pay dividends, with the expected average dividend yield to be at least 1.5%
- Drawdowns (losses) should be much milder on the Income portfolio, with much more volatility on the other two
- You should own or trade these stocks in whatever manner is most comfortable for you; while we buy all 10 stocks as of the dates identified above, feel free to trade certain stocks or wait for pullbacks if the stocks are overbought
- We have no idea what risk each member is willing or able to take. We are not registered investment advisors so be sure you understand the risk you take.
- EarningsBeats.com shareholders/employees may own all or some of the portfolio stocks from time to time.
Weekly Summary
Benchmark S&P 500:
The Nervous Nellies on CNBC are likely wondering where to turn next. The S&P 500 closed at a record high 3 times last week, including Friday's finish at 3066.91. Overall, the S&P 500 gained 1.47% for the week. I see blue skies ahead and have been very bullish, despite all the nonsense coming from the talking heads. Please understand one thing. CNBC's mandate is to sell ads. They need ratings. How do they get ratings? By constantly scaring their viewers with negativity. They'll continue to parade their "experts" on who'll tell you that another bear market is right around the corner, one that'll top 2007 to 2009.
Hogwash.
We're in a secular bull market. Don't fret over the Fed, trade war, presidential election, healthcare, income taxes, etc. We're going higher, so stay the course. Those controversies will help to fuel the nervousness and uncertainty that we periodically see in the U.S. stock market. That part won't change. But forget 2007 to 2009, it's literally history and, in my opinion, the next decade in global equities will look nothing like the 2000-2009 decade.
For those who haven't seen it, let me show you the Big Picture for the S&P 500 :
100 year monthly S&P 500 chart:
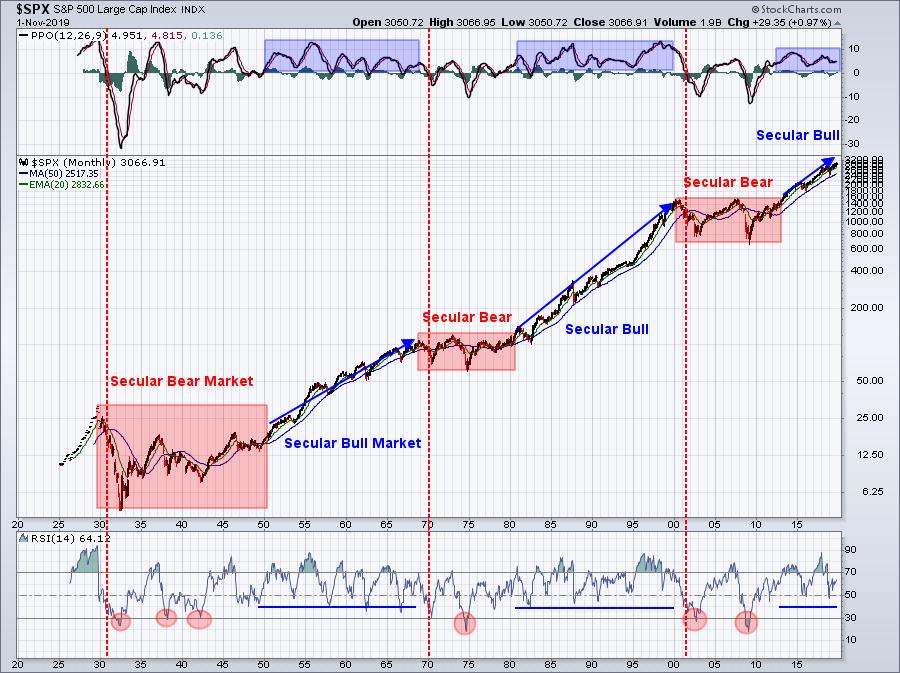
History repeats itself. In its simplest form, the stock market should be driven by growth and inflation. During secular bear markets, there is overall growth despite multiple recessions and there's certainly plenty of inflation. Yet the stock market goes almost nowhere during lengthy 12-13 year periods. Secular bull markets represent "catch up" periods where stock market returns crush GDP and inflation. I believe we're in such a period now and will continue to be for the 2020s. We'll have a cyclical bear market (20% drop over relatively short 3-6 month period) or two, but the overall market direction will be higher. Again, this is my opinion. Feel free to disagree.
Here is a recap of S&P 500 performance by sector:
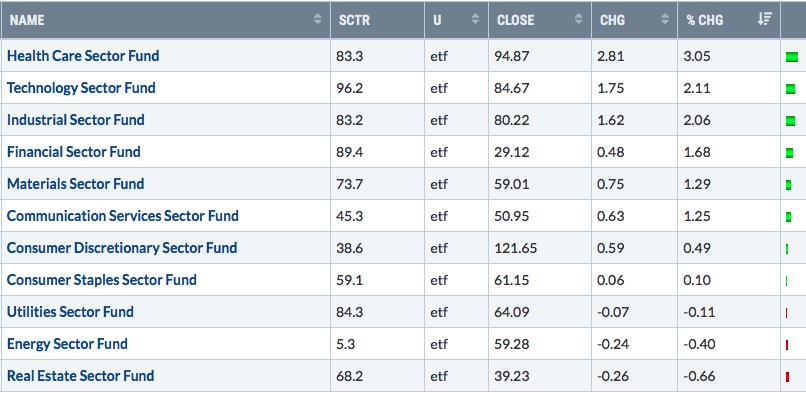
The strength in technology (XLK) and industrials (XLI) was a positive for our portfolios this week, but several of our consumer discretionary (XLY) names have struggled and last week was no exception.
Model Portfolio:
The Model portfolio gained 1.66% last week and is currently down 2.90% since August 19th, the date of the last selection process. Strength last week came from Roku (ROKU), Alteryx (AYX), and S&P Global (SPGI). Here is a current look at the Model portfolio's user-defined index that I track daily:
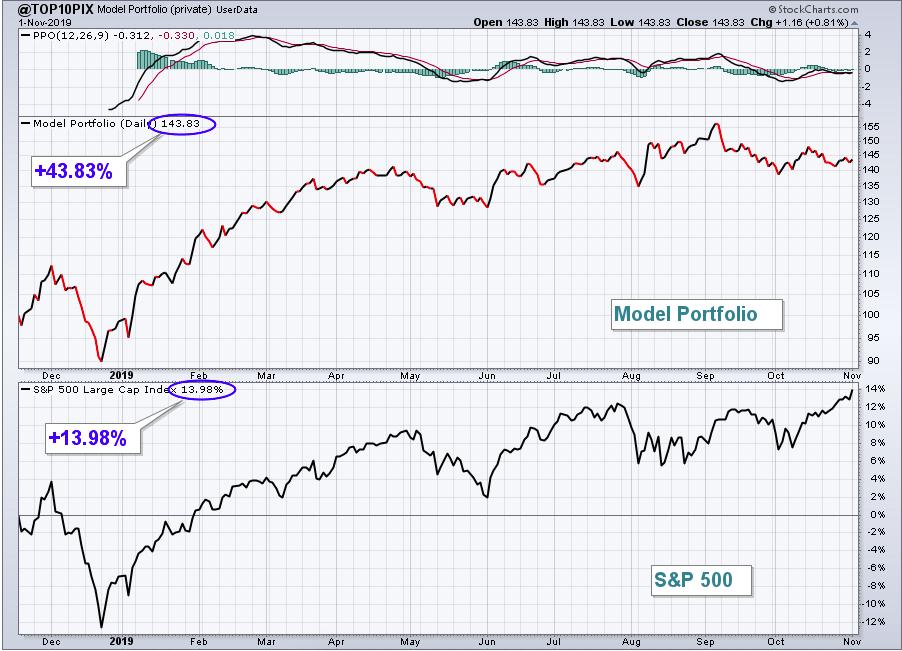
While the current quarter remains challenging, the inception-to-date results remain quite strong.
Strength last week came from Roku (ROKU), Alteryx (AYX), and S&P Global (SPGI).
Here's a recap how each stock in the Model portfolio performed last week:
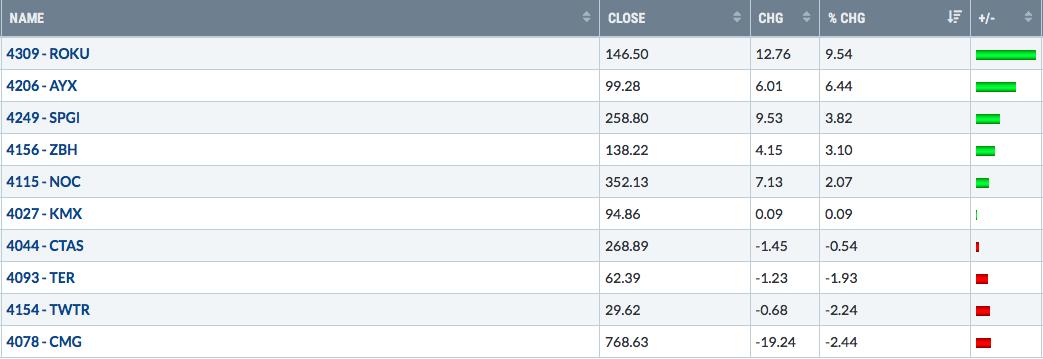
TWTR is a broken stock and will likely continue to underperform based on its fresh 52 week relative lows. AYX was able to recover after posting its latest quarterly results last week. After initially trading down on Friday, following its results, AYX stormed higher and gained close to 17% in under an hour. The continuing improvement in the AYX chart could play a big role in the Model portfolio's performance over the last two weeks before a new batch of stocks replaces the current one. SPGI also reported quarterly results and saw a positive reaction as well, breaking out to a multi-month high. Here's how AYX and SPGI currently look technically:
AYX:
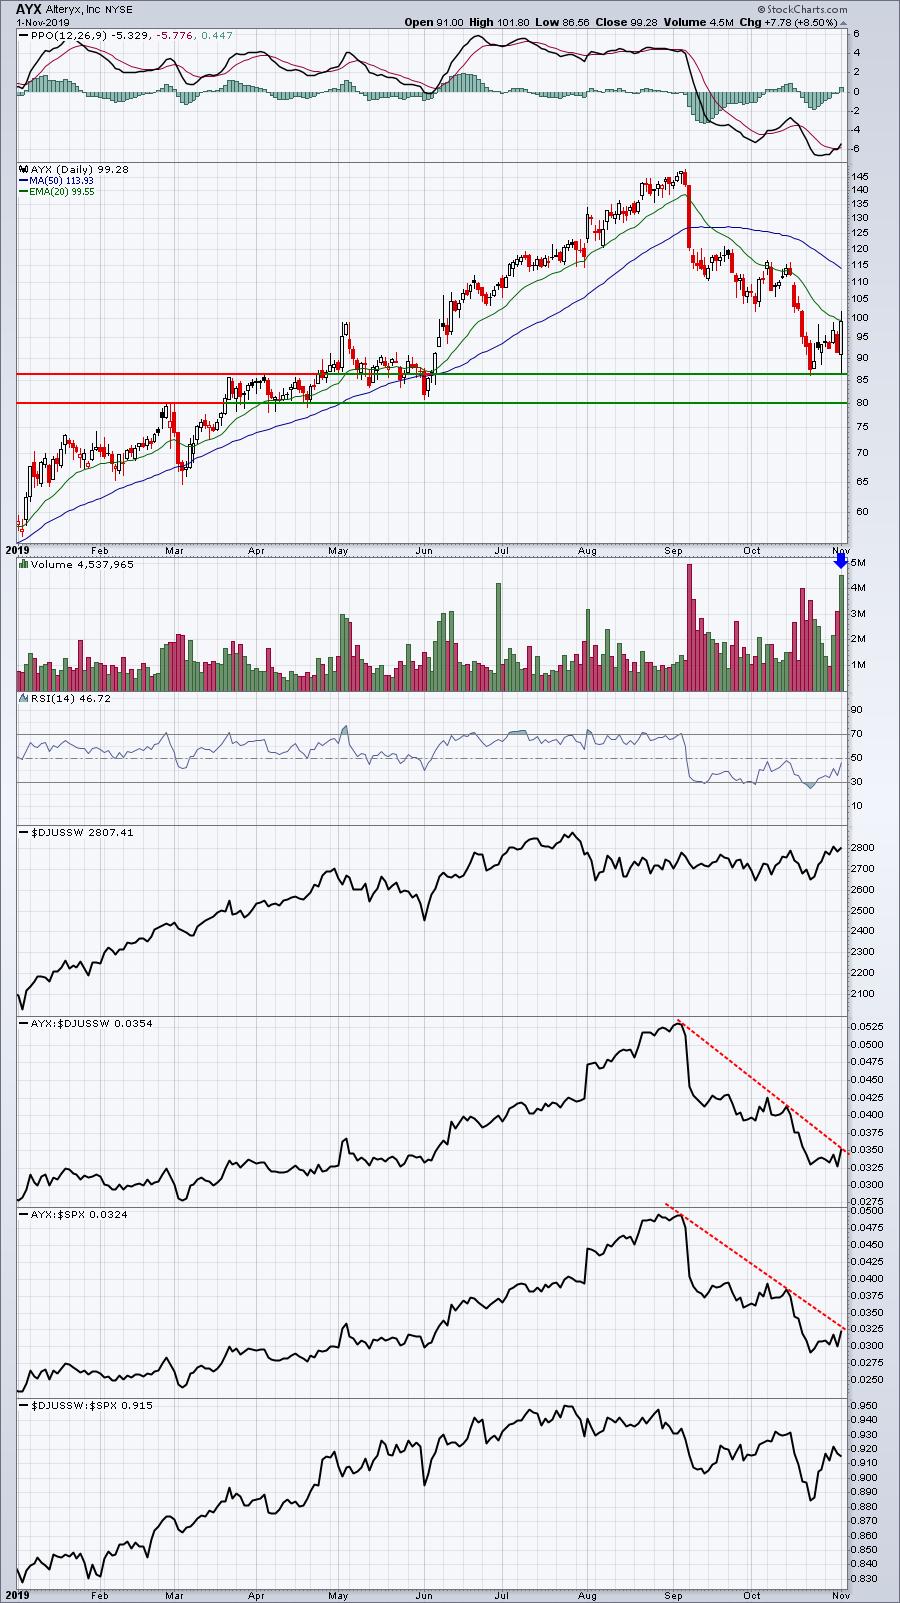
A move through 103 would increase the short-term odds of an upcoming 50 day SMA test.
SPGI:
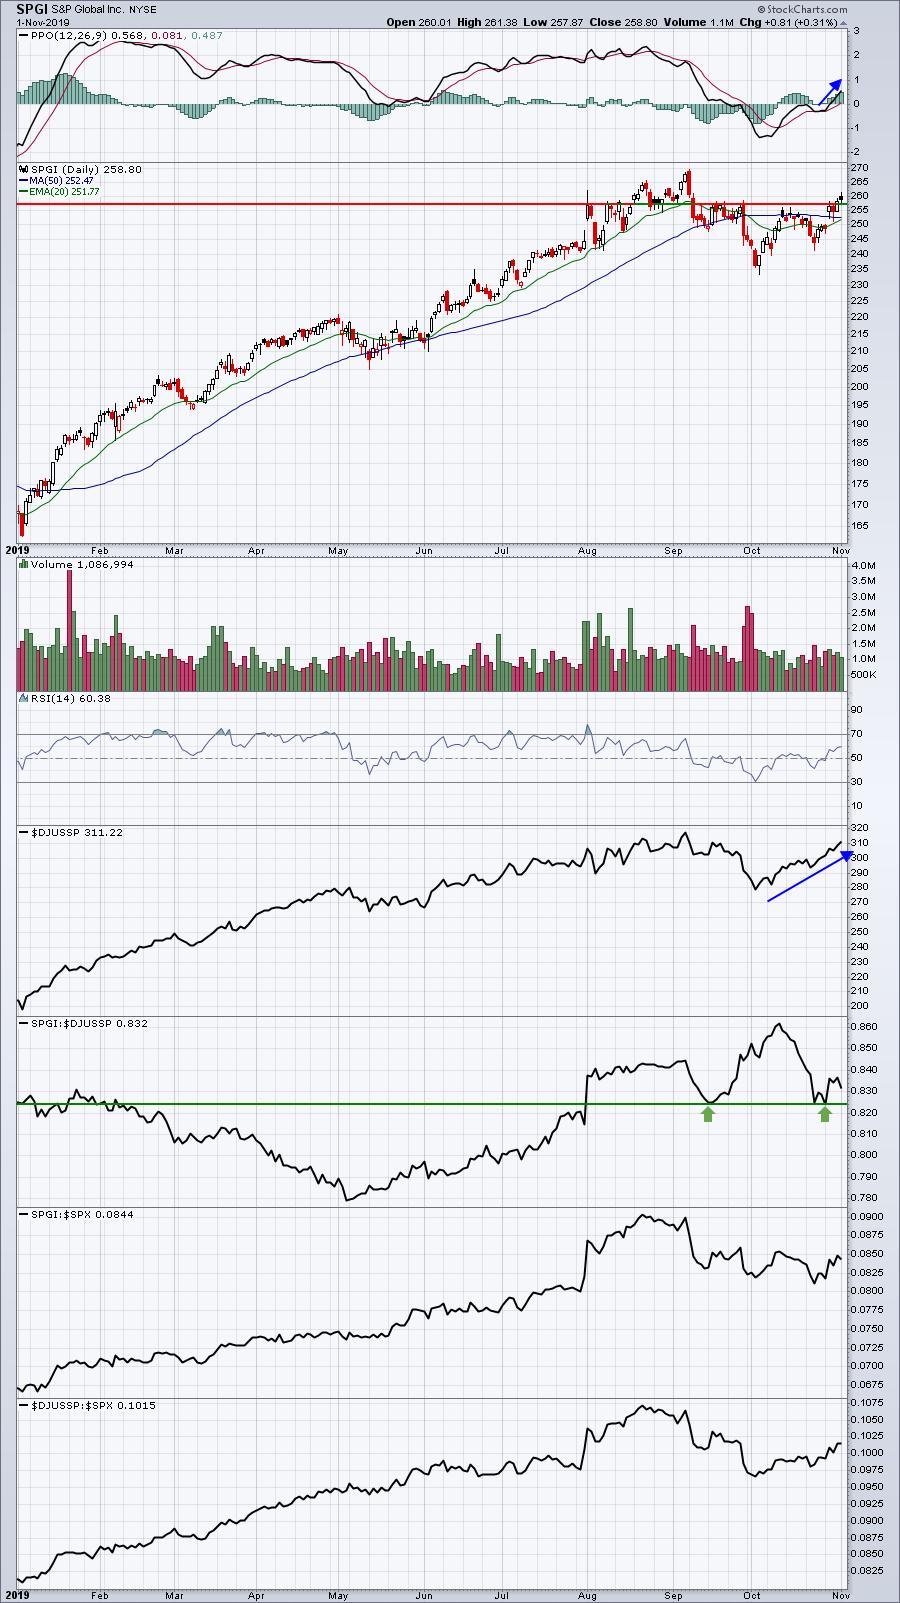
SPGI has improved considerably this week, but I'd still watch that relative strength double bottom vs. its specialty finance peers.
Aggressive Portfolio:
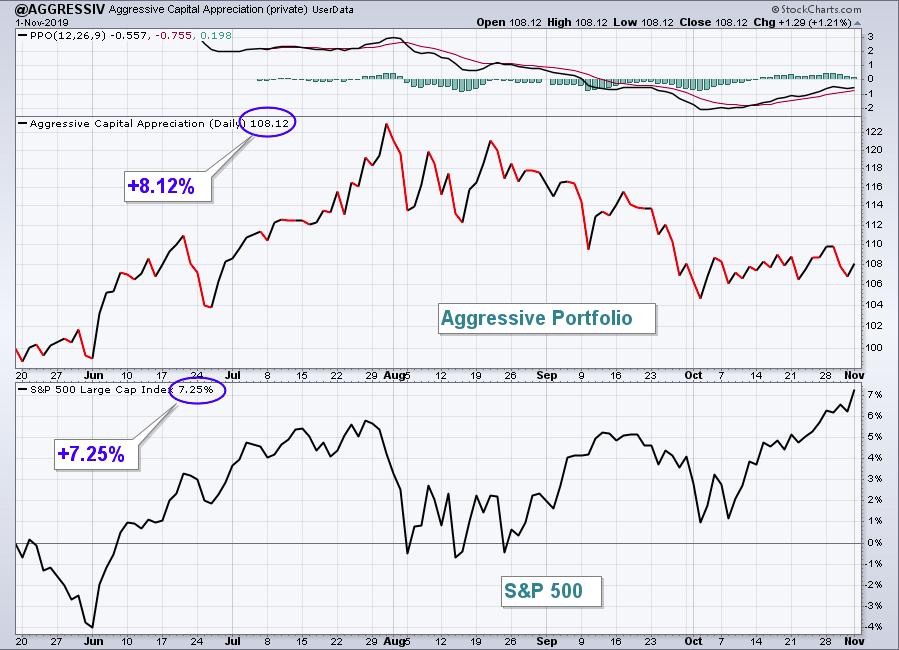
The Aggressive portfolio had another losing week, dropping 0.52% last week, and trailed the S&P 500's 1.47% gain by a wide margin. This portfolio has been hurt more than the others by the market's shift from growth stocks to value stocks. Also, one huge loss after an earnings report really impacted an otherwise productive week. Here's the portfolio's chart since inception:
The high volatility associated with the Aggressive portfolio has been apparent just about every week, but this may have been the wildest week based on the following individual performances:
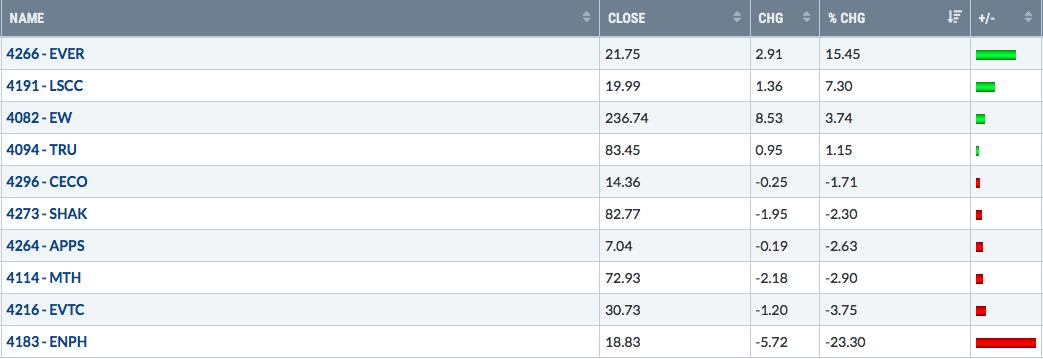
Easily the most disappointing part of the week was the reaction to ENPH's earnings report. They beat revenue and EPS consensus estimates, and then even raised their forecast. Wall Street couldn't have cared less:
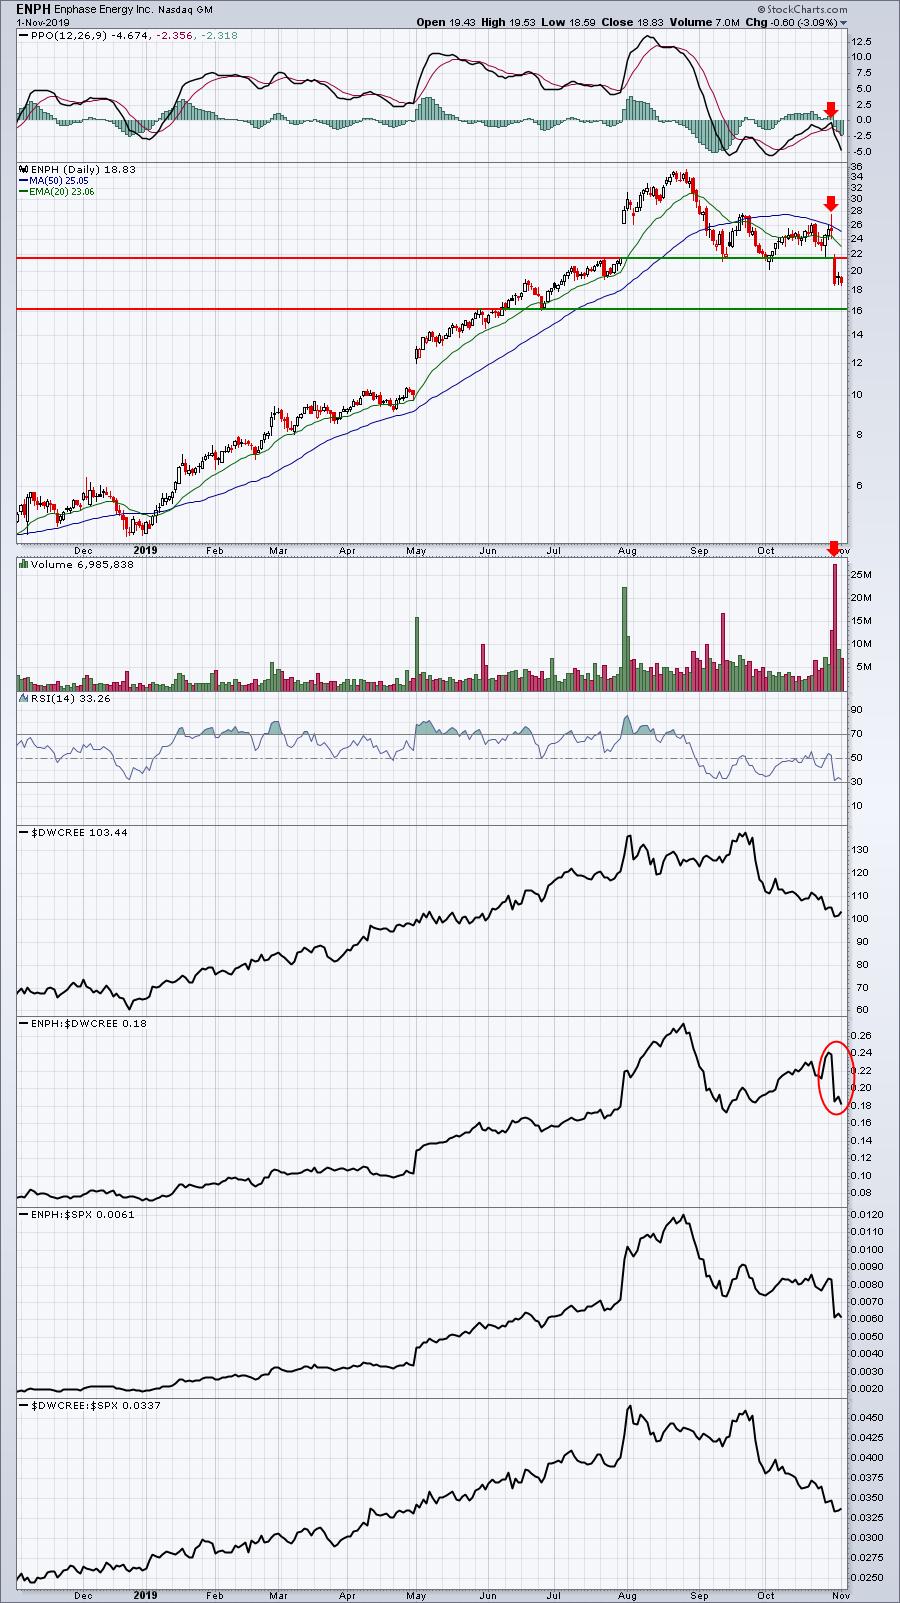
It seems crazy that a company that beats estimates and raises its guidance could lose one-third of its market value from 2pm one afternoon to 10am the next, but that's what happened to ENPH. A couple analysts cut their price target by a couple dollars, which may have caused some nervousness, but still the selling seemed to be very overdone. I always follow the charts, however, and the above chart has to give us reason for pause. It's hard to sweep a price breakdown on 28 million shares under the rug.
As bad as the ENPH drop was, however, we saw renewed strength in both EVER and LSCC to offset it. EVER, in particular looks to be recovering into its upcoming earnings report on Tuesday, November 5th:
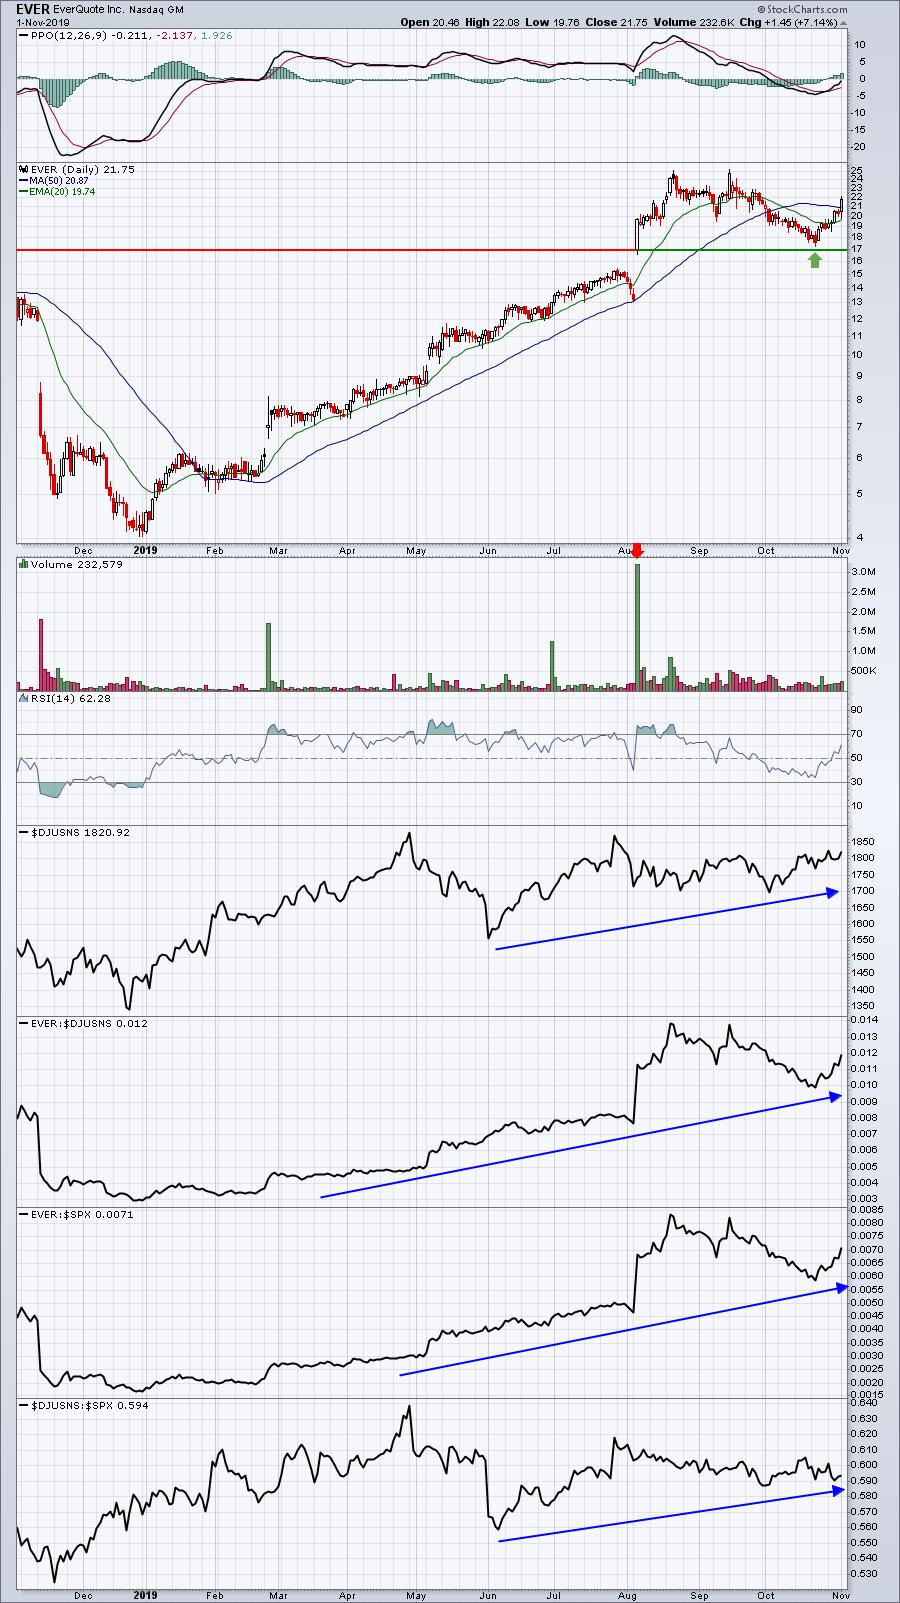
I know it's been a crazy ride with EVER, but I'd still argue the absolute and relative strength suggests a solid chance of a big earnings report. We'll find out on Tuesday.
Income Portfolio:
The Income portfolio had a very nice week and gained 1.88%, stretching its since-inception lead over the S&P 500. It also closed at its highest level on Friday. Here's a chart of the Income portfolio since its May inception:
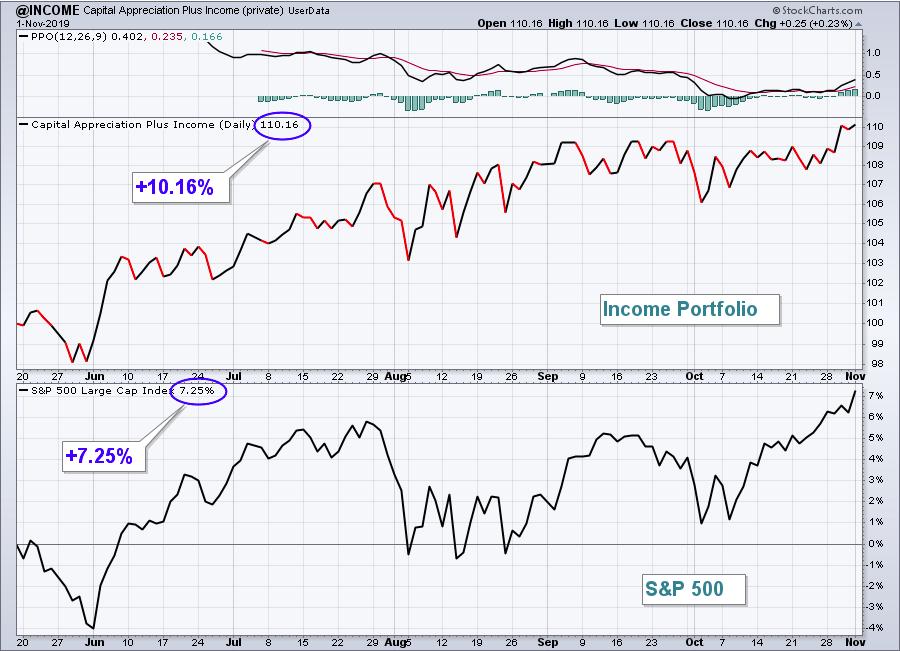
Heading into this latest quarter, I had argued that the Income portfolio's relative performance may have been the most impressive - not because of huge gains, but because it's made up of many household names that I'd expect to outperform during down markets and maybe just "go along for the ride" during up markets. But last week's gain outperformed the benchmark S&P 500 and now the Income portfolio's gain is nearly 3 percentage points higher than the S&P 500 - in an up market. One final consideration is that the Income portfolio's gain does not include dividends and the group, as a whole, averages a dividend yield close to 2%.
Here's how the individual stocks in the Income portfolio performed last week:
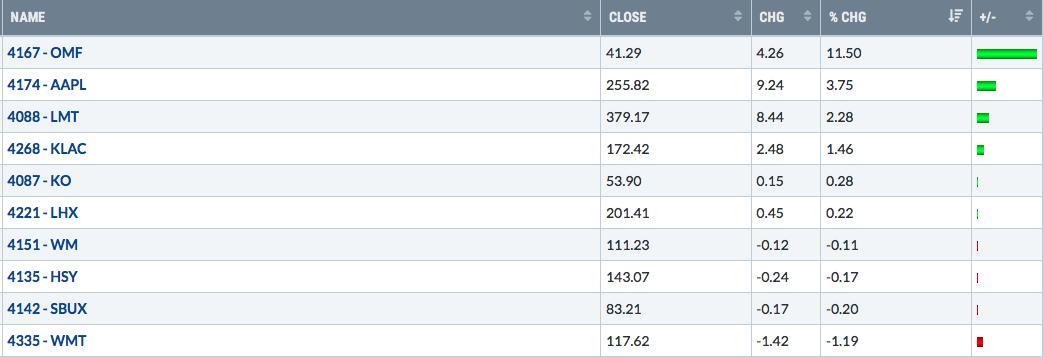
I'd say the three worst looking charts right now in this portfolio - from a technical perspective - are WM, HSY and SBUX. I'm not surprised that they lagged this past week. SBUX has a positive divergence (lower price, higher PPO) so it's probably getting close to a push higher to test its 50 day SMA. Another move lower beneath 82.50 could result in an even stronger divergence:
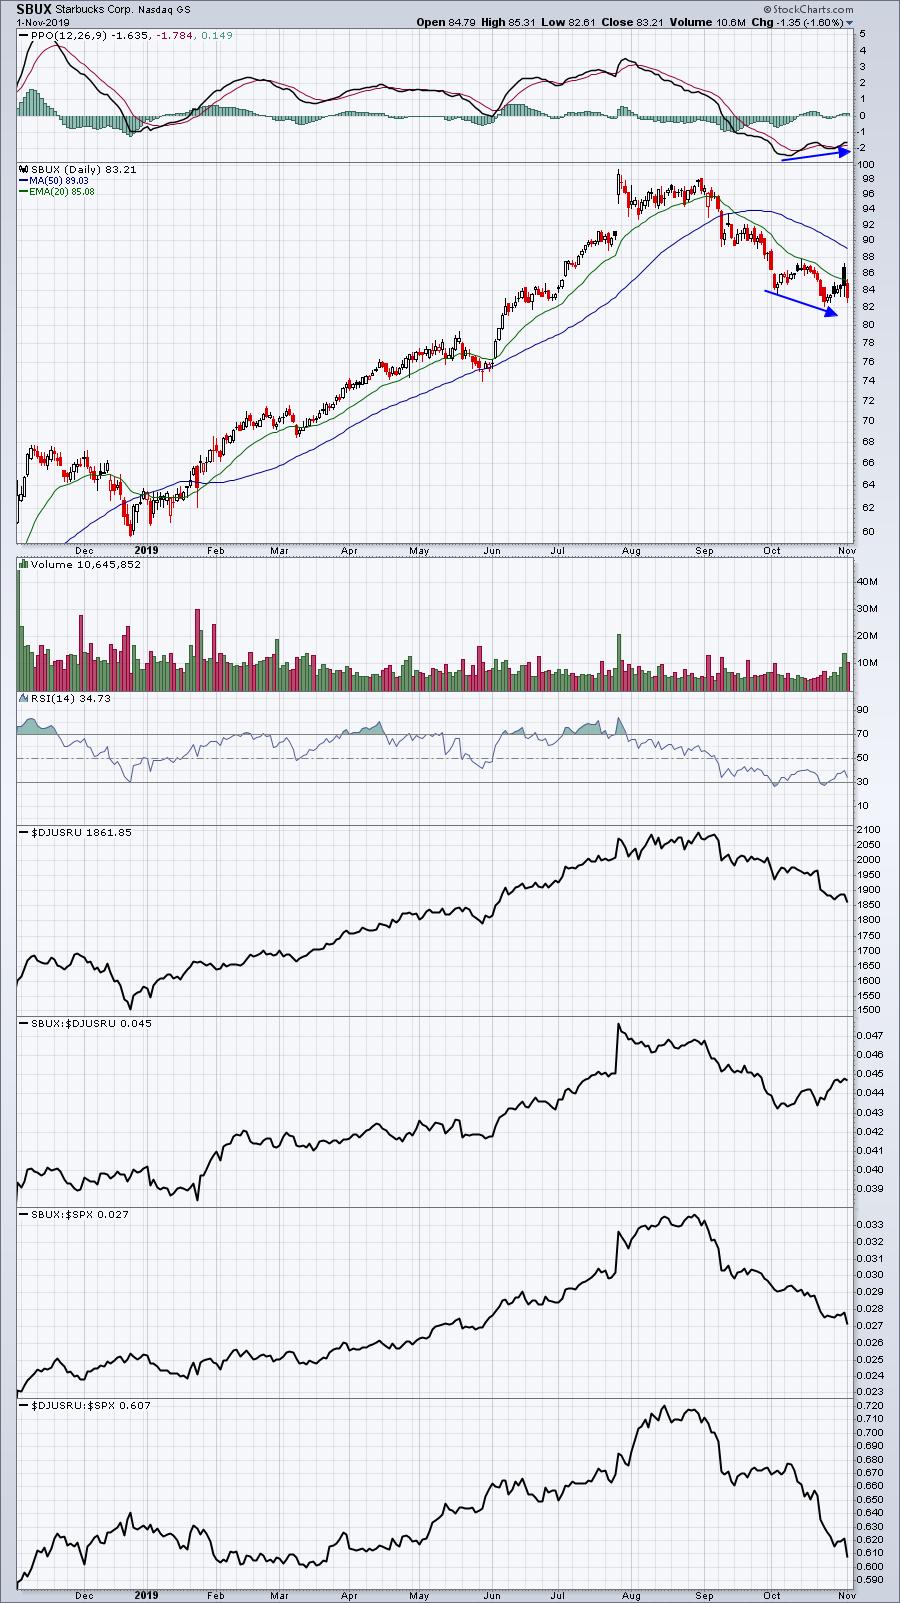
If SBUX were to drop into the upper 70s, I'd expect a very strong move higher from there. If 82.50 price support holds, another move back to 87-88 is what I'd look for.
OMF was the obvious reason why the Income portfolio outperformed last week as OMF traded strongly following a revenue and earnings beat to start the week:
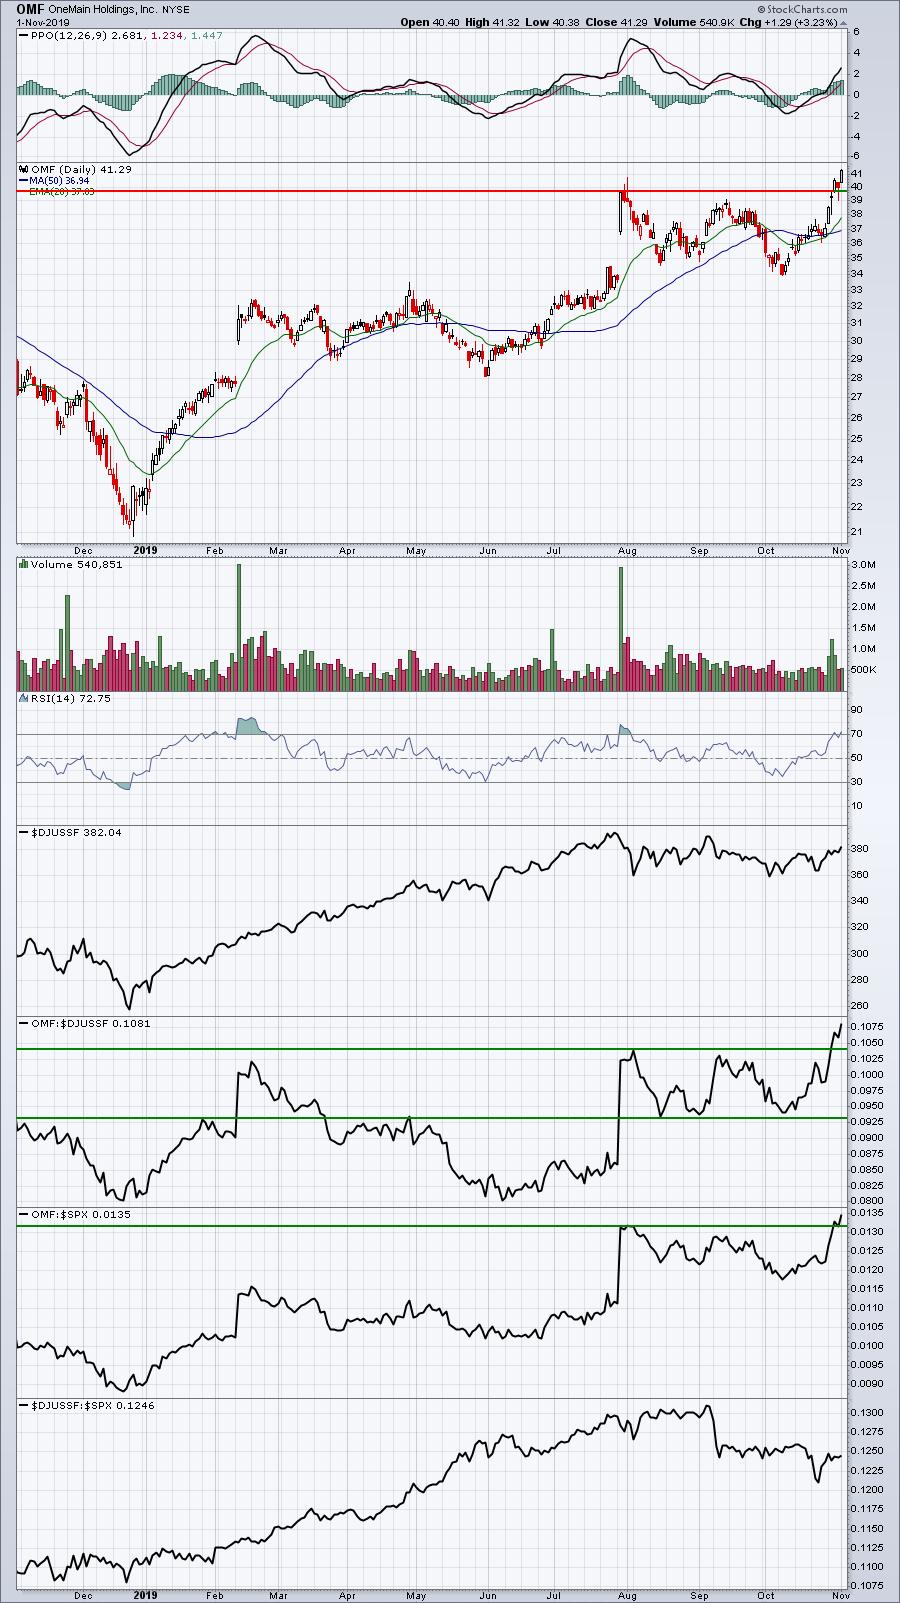
OMF broke out on both an absolute and relative basis and certainly appears to be poised for further price appreciation. Its 2.47% dividend yield doesn't hurt.
Summary
From an overall market perspective, I feel vindicated now that the S&P 500 has pushed to another all-time high. I've remained steadfastly bullish through all the media rhetoric and it's paying dividends. The shift from aggressive growth stocks to value stocks has caused some consternation on my part for sure, but I remain squarely focused on the bigger picture, which in my view suggests "we ain't seen nothing yet". Stay the course, stay bullish.
I wish everyone a great week ahead!
Happy trading!
Tom Bowley, Chief Market Strategist
EarningsBeats.com
"Better timing. Better trades."