
EB Weekly Portfolio Report - Sunday, November 10, 2019
Portfolio Rules and Objectives
Here are the common traits and objectives of each portfolio:
- There are 10 leading stocks from 10 leading industries in each portfolio (at the time of selection)
- They are held for an entire 90 day period, with no stops in place
- Every stock will be held through ONE earnings report
- The expectation is that relative winners will carry the portfolio to outperformance
- They are all entered into as of February 19, May 19, August 19, and November 19 (these dates are used as we are generally past the majority of earnings reports by these dates)
- Primary objective is to outperform the benchmark S&P 500
Here are several considerations for EB members:
- I would expect the Aggressive portfolio to be the riskiest, followed by the Model portfolio, and then the Income portfolio
- The Income portfolio stocks will all pay dividends, with the expected average dividend yield to be at least 1.5%
- Drawdowns (losses) should be much milder on the Income portfolio, with much more volatility on the other two
- You should own or trade these stocks in whatever manner is most comfortable for you; while we buy all 10 stocks as of the dates identified above, feel free to trade certain stocks or wait for pullbacks if the stocks are overbought
- We have no idea what risk each member is willing or able to take. We are not registered investment advisors so be sure you understand the risk you take.
- EarningsBeats.com shareholders/employees may own all or some of the portfolio stocks from time to time.
Weekly Summary
Benchmark S&P 500:
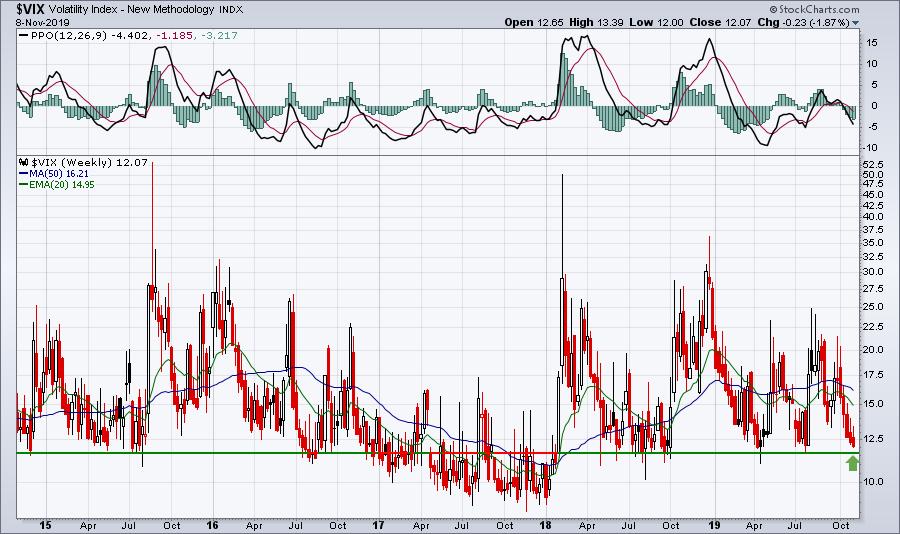
Volatility ($VIX) continues to slowly vanish from the market and that is very bad news for the bears. High VIX levels are akin to fearful markets and markets under attack, while VIX readings below the teens are synonymous with bull market advances. Currently, the VIX resides at 12.07 and is threatening 2 year lows:
As fear subsides, the stock market gets more and more boring. Boring is great if you're bullish. And it continues to lead to an S&P 500 that's climbing further and further into record territory. The S&P 500 gained 0.85% last week. While I wouldn't be surprised to see some short-term profit taking (there's a 60 minute negative divergence that I wrote about this past week in the Daily Market Report), the weekly and daily charts are both suggesting higher prices ahead. Here's the weekly view:
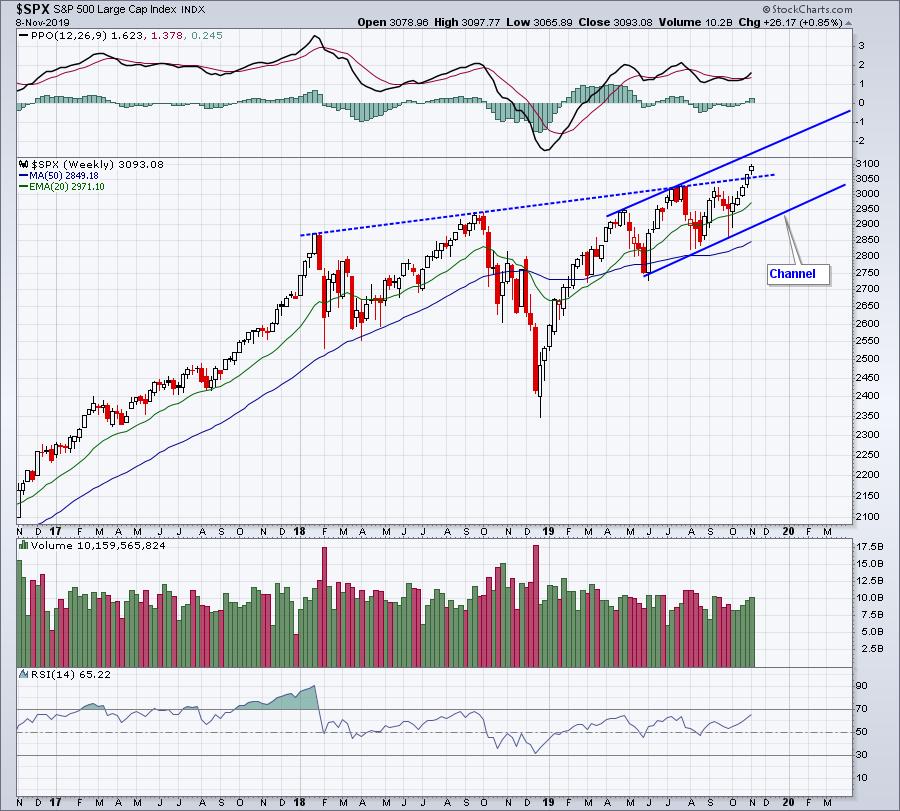
I've been clear about my belief that we're going much, much higher and the breakout above the 2 year blue-dotted trendline suggest we continue to follow the shorter-term channel. I think there's a good chance that we ride along the upper channel line for several months with pullbacks only reaching the rising 20 week EMA. During solid bull market advances, the weekly PPO will many times top out near 4. We're currently at 1.62, so this momentum is likely just getting started.
Here is a recap of S&P 500 performance last week by sector:
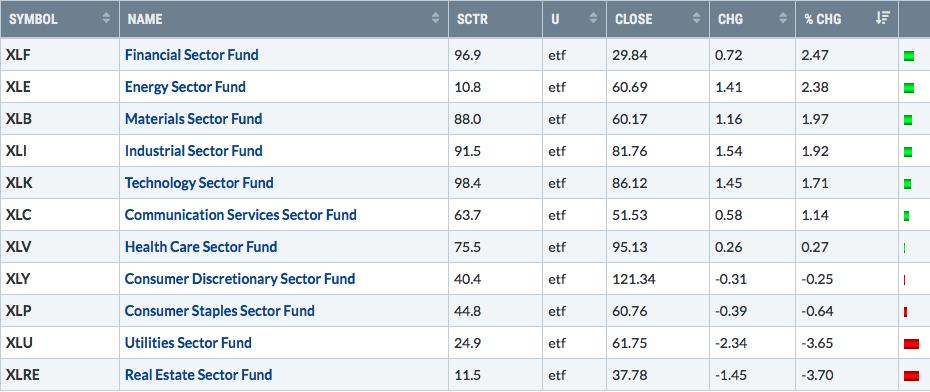
Economically-sensitive areas of the market continue to benefit from the last two month's thematic change. The good news is that breakouts in transportation ($TRAN) and the 10 year treasury yield ($TNX) are likely to help fuel a major stock market advance for the foreseeable future. The S&P 600 Small Cap Index ($SML) is on the verge of breaking out as well. I'm looking forward to more of a mix of growth and more economically-sensitive stocks when the new portfolio stocks are disclosed on Tuesday, November 19th.
Last week, however, the continuing push into these economically-sensitive areas did our portfolios no favors.
Model Portfolio:
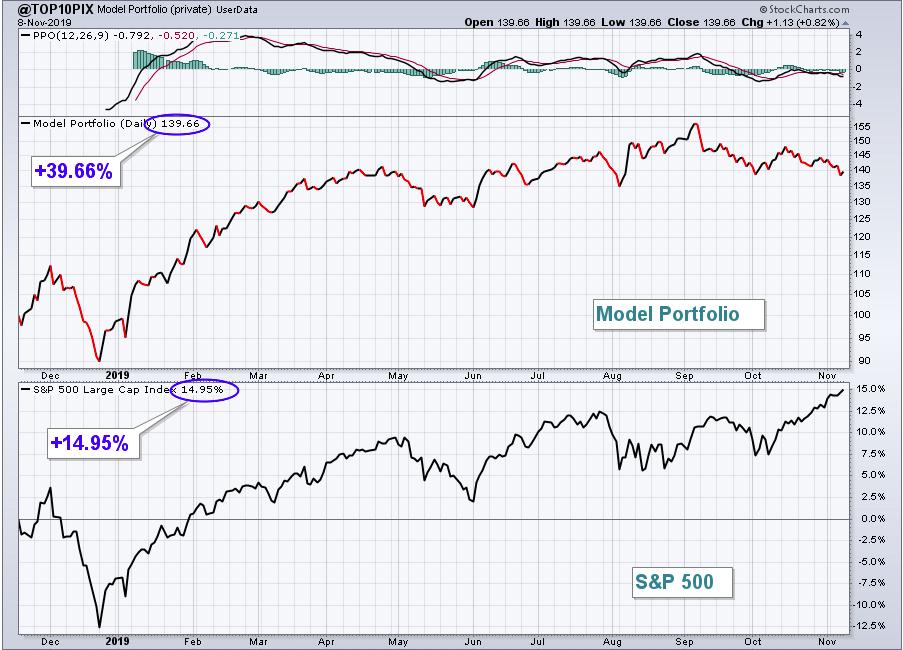
The Model portfolio lost 2.90% last week and is now down 5.72% since August 19th, the date of the last selection process. This has trimmed the portfolio's "lead since inception vs. the S&P 500" to roughly 25 percentage points (+40% vs. +15%), a far cry from where it was before the shift from aggressive growth stocks to value stocks began in late-August. Here is a current look at the Model portfolio's user-defined index that I track daily:
It was a very bad week for the Model portfolio as several stocks fell considerably. Here's a recap of how each stock in the Model portfolio performed last week:
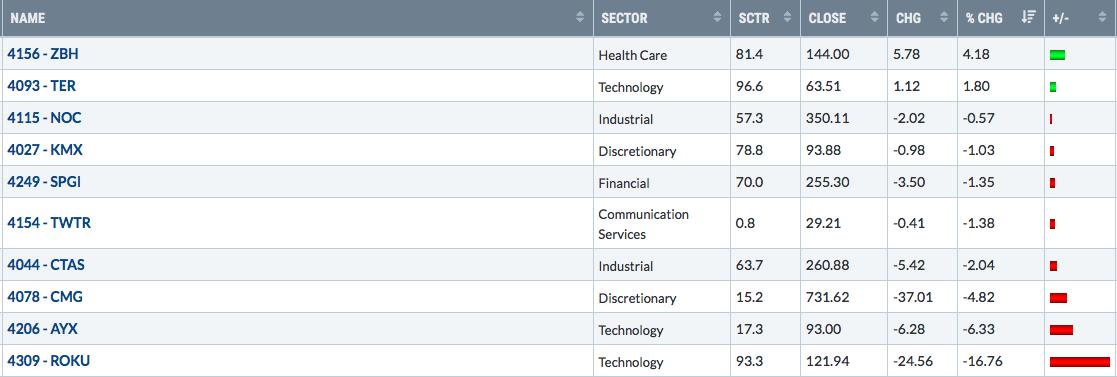
ZBH performed well and broke out to fresh highs after reporting better than expected results.
ZBH:
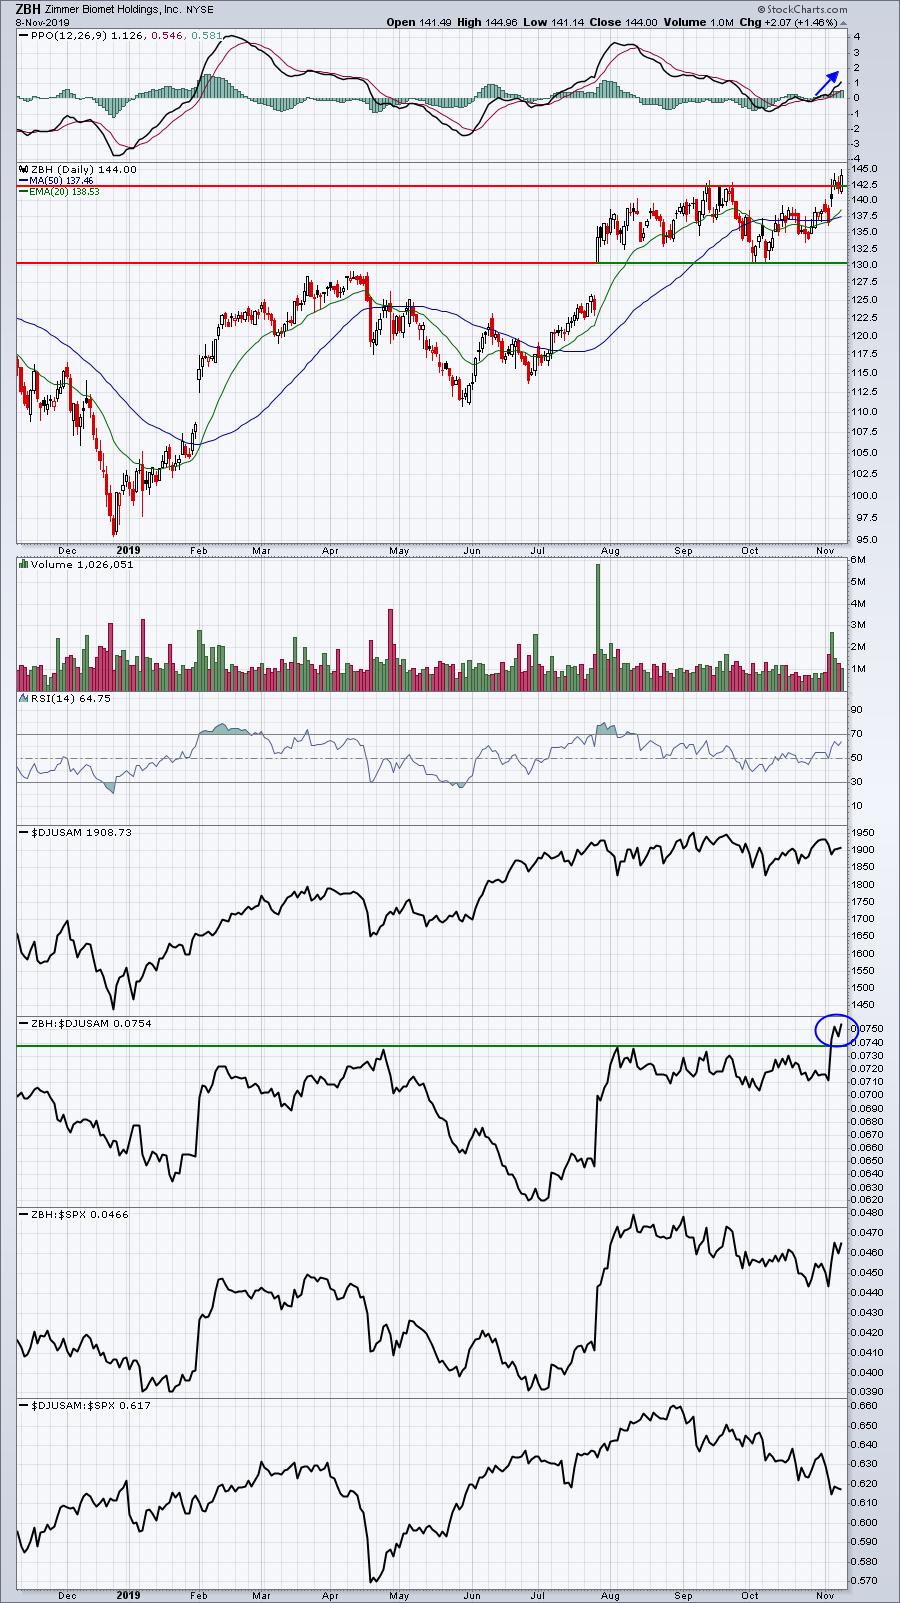
ZBH looks solid and poised for further gains after breaking out on both an absolute basis, as well as a relative basis. Unfortunately, that's where the positive earnings reactions ended. ROKU posted revenues and EPS that surpassed Wall Street estimates, but saw a very negative reaction nonetheless:
ROKU:
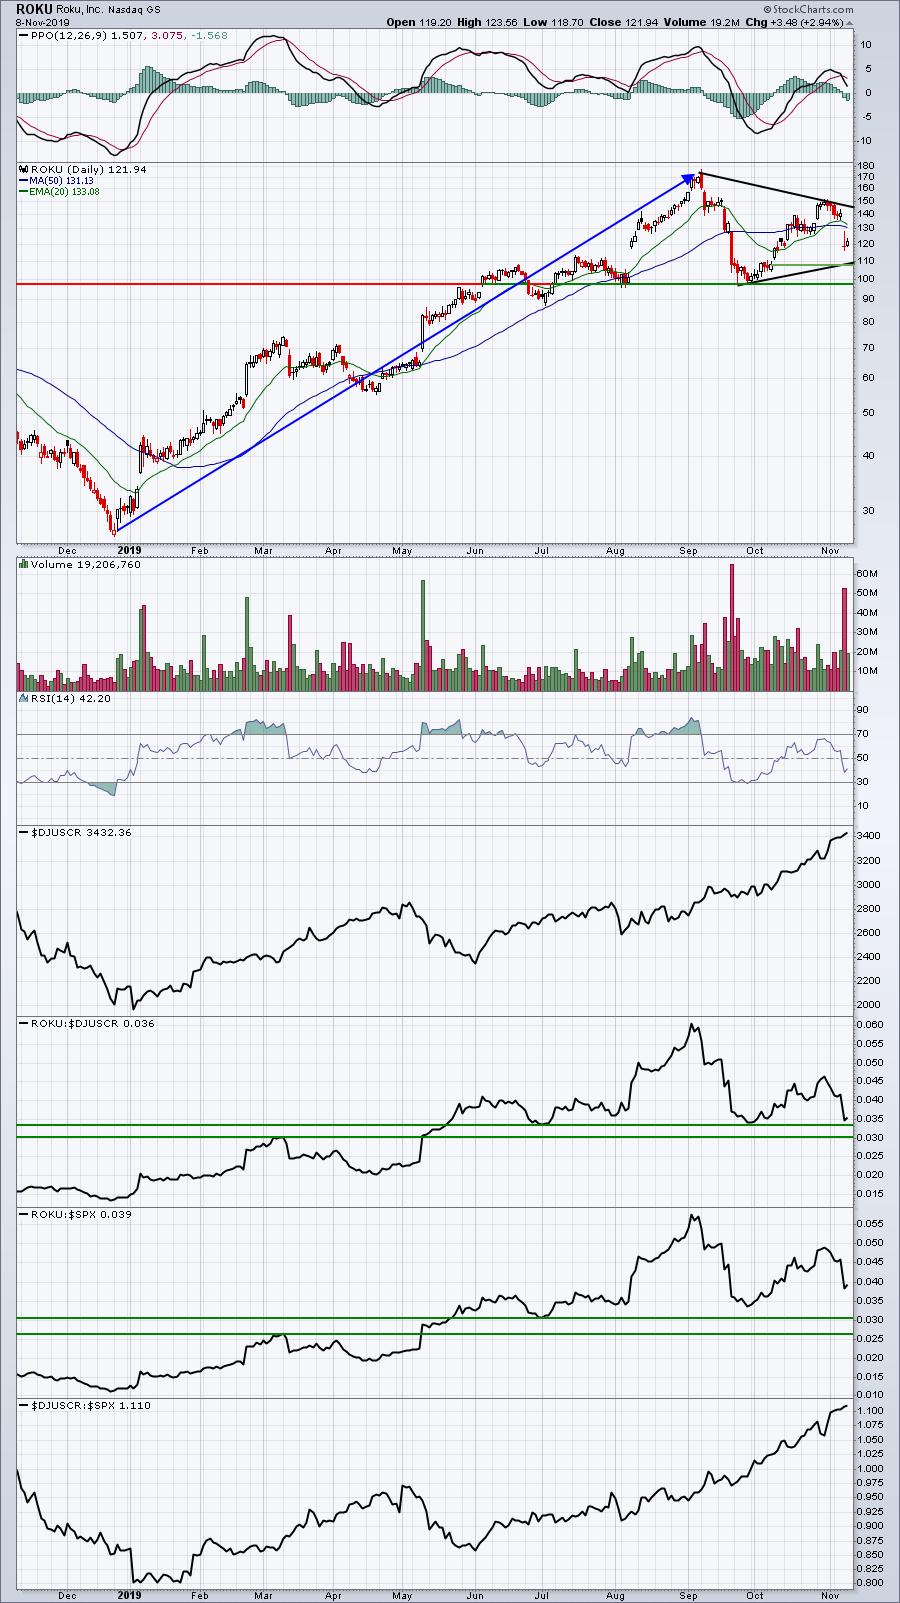
There's a ton of volatility on many Model portfolio stocks and they've definitely had a rough quarter as a group, but I do still like all of the stocks. ROKU, in my opinion, is consolidating after a huge push to the upside. I've drawn a large symmetrical triangle above as we could see this pattern take place in the coming weeks. I'd grow much more concerned with ROKU if the initial price support just below 100 is lost. I would not at all be shocked to see a return to all-time highs later this year or in 2020.
AYX also had a rough week as it potentially retests its earlier low. It's important to know that AYX also beat Wall Street consensus estimates as to both revenues and EPS. The problem here is two-fold. First, many high growth software stocks like AYX have been sold over the past two months as the rotation to value stocks has unfolded. Second, and more importantly, AYX is technically-broken right now. Fundamentalists aren't buying it and technicians aren't buying it. But the numbers aren't bad at all. In fact, if AYX remains on track to beat its numbers in the next quarter, I wouldn't be surprised to see a big rally here similar to ROKU. Check out the longer-term weekly chart:
AYX:
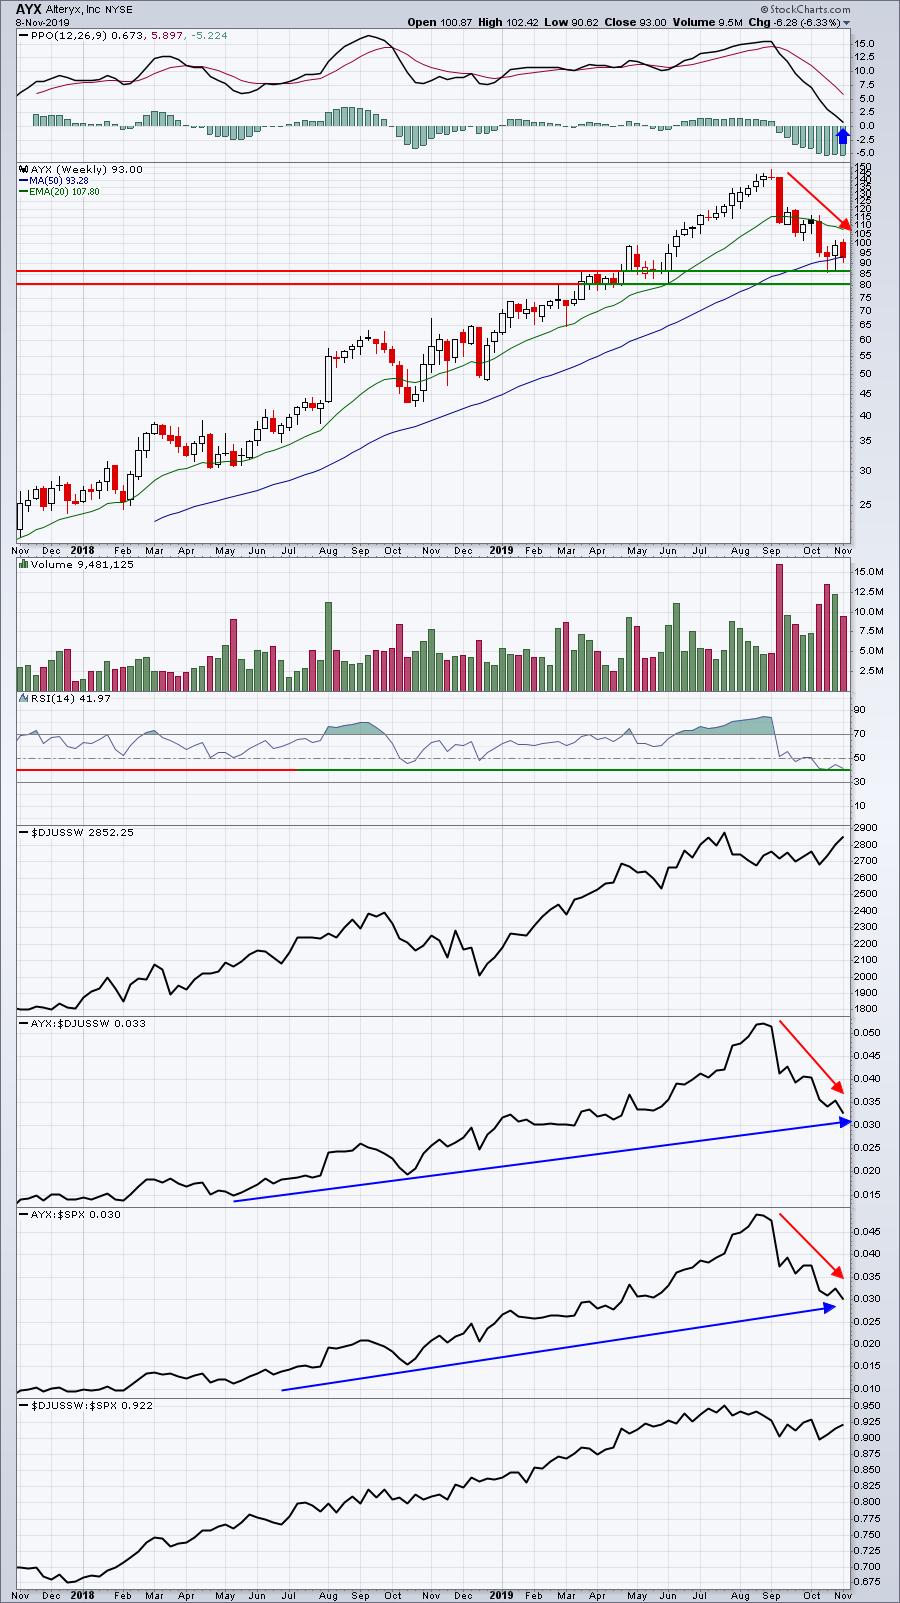
In last week's Portfolio Report, I provided a daily chart of AYX and pointed out an area of price support between 80-87. The above is a weekly chart, which I think provides a big picture look at why AYX could be poised for a rally. An uptrending stock typically holds support at RSI 40. I know it's difficult to consider AYX as an uptrending stock given its performance over the past 60 days. But taking a step back and looking at a longer-term weekly chart likely gives you a different perspective. AYX was one of the hottest "growth" stocks on Wall Street. When the theme changed from growth to value, stocks like AYX were ambushed. As long as the growth story remains, AYX will recover when money rotates back into growth stocks in general.
Aggressive Portfolio:
The Aggressive portfolio rallied and topped the S&P 500 performance last week, gaining 1.08%. This portfolio has also been hurt by the market's shift from growth stocks to value stocks. If it weren't for one excellent quarterly report and huge positive response, the Aggressive portfolio would have underperformed once again. Here's the Aggressive portfolio's chart since inception:
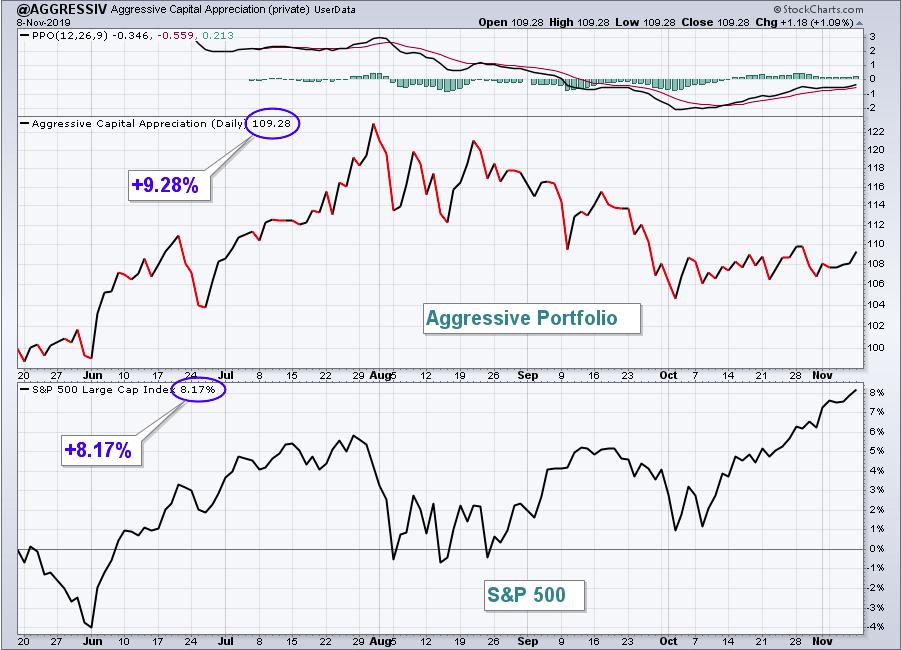
EverQuote (EVER) has strung together two huge weeks, rising from 17 to above 30. That has helped to keep the Aggressive portfolio afloat of late. Here is how each Aggressive portfolio stock performed last week:
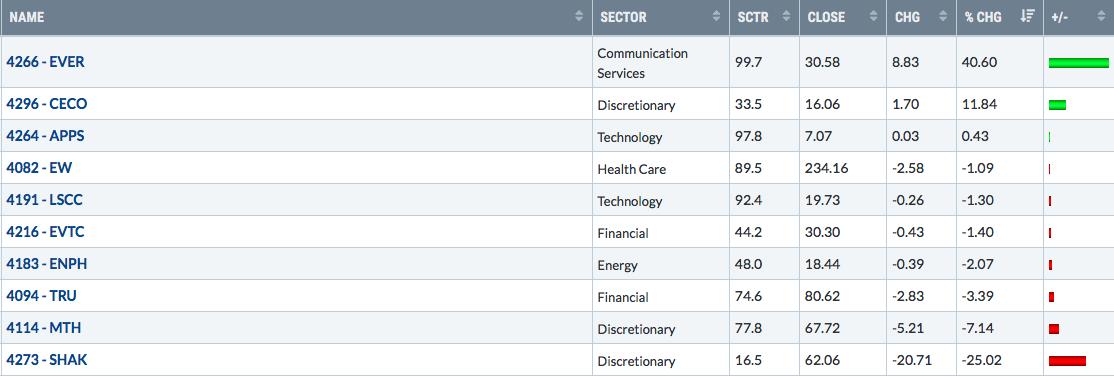
The huge week in EVER helped to offset the growing losses in Shake Shack (SHAK), which is part of the plummeting restaurant group ($DJUSRU). Earnings were a big part of last week's movers. Both EVER and CECO rallied on earnings, while SHAK tumbled after missing their numbers. MTH has fallen in lock step with home construction stocks ($DJUSHB), which have found lots of sellers as 10 year treasury yields ($TNX) rise. The TNX closed at 1.93% on Friday, its highest close since late-July.
Last week, I suggested the absolute and relative strength of EVER suggested we could be setting up for a big earnings report. EVER delivered as you can see below:
EVER:
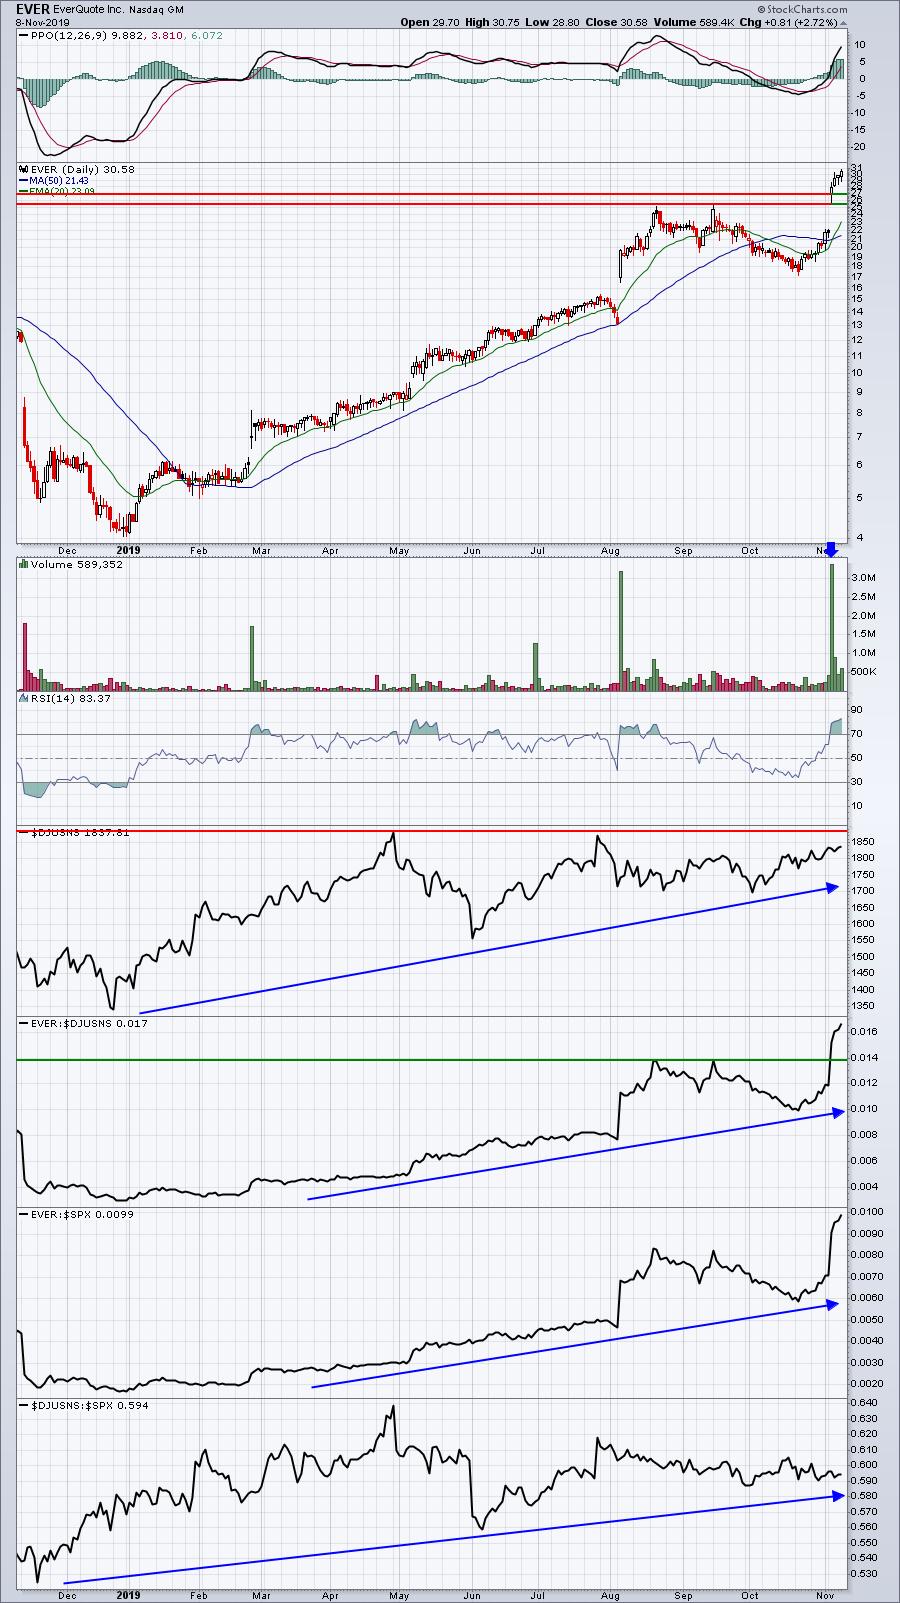
There should be excellent support for EVER in the 25-27 range if selling kicks in over the next few weeks. EVER is very overbought in the near-term, but its earnings report and its reaction could lead to another 3 month stay in the Aggressive portfolio.
Income Portfolio:
The Income portfolio fell slightly last week, dropping 0.19%, but is still maintaining its "since-inception" lead over the S&P 500, despite dividends-to-date not being included in the Income portfolio's performance results. Here's a chart of the Income portfolio since its May inception:
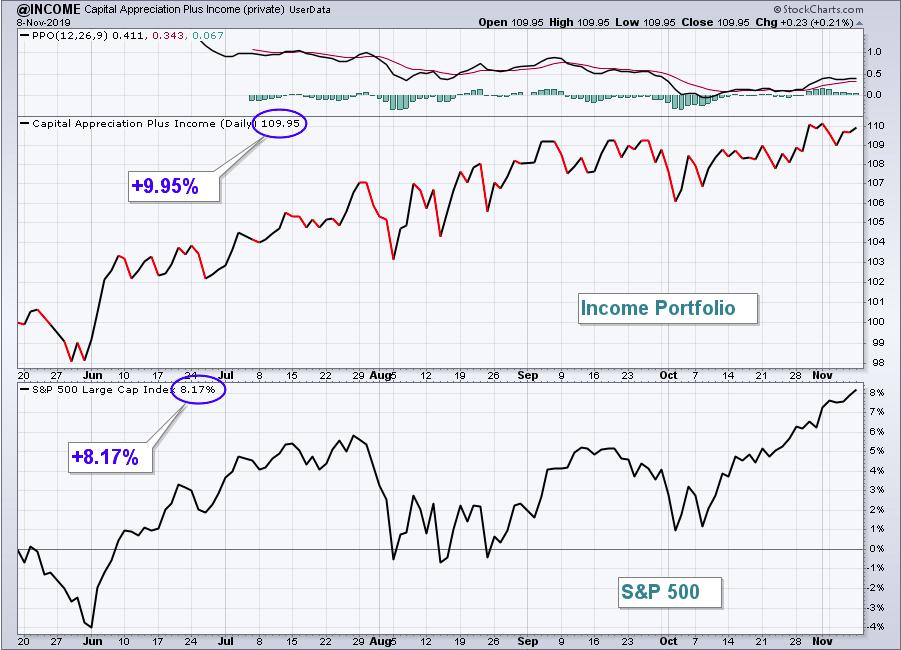
One of the most important things to note about the Income portfolio is that it's history of volatility is much, much less than both the Model and Aggressive portfolios. That should be an important consideration for those of you that have much lower risk tolerance levels. The drawdowns in the Income portfolio haven't been nearly as large as they've been in the other two portfolios, but it also hasn't performed as well during good periods.
Here's how the individual stocks in the Income portfolio performed last week:
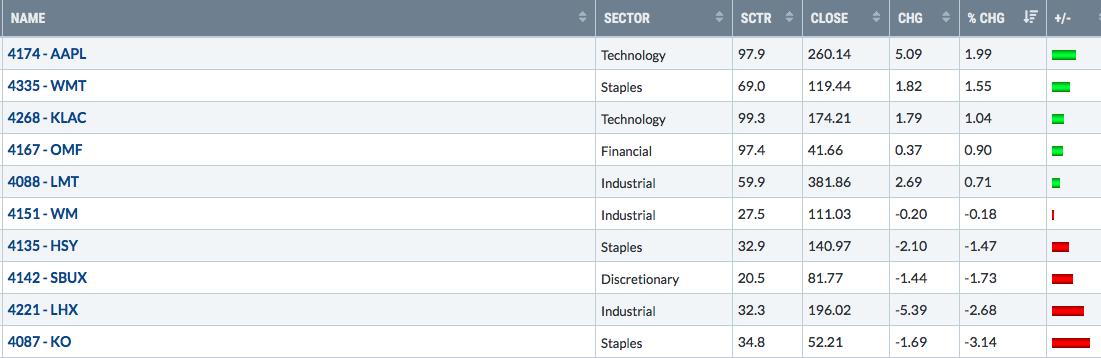
In evaluating which of these stocks is currently in the worst shape, I'd give a lot of consideration to how the company is performing relative to its peers. For instance, AAPL and WMT are both solid relative performers. I'll highlight WMT because its personal products group ($DJUSCM) has been struggling, but WMT is maintaining its status as a leader:
WMT:
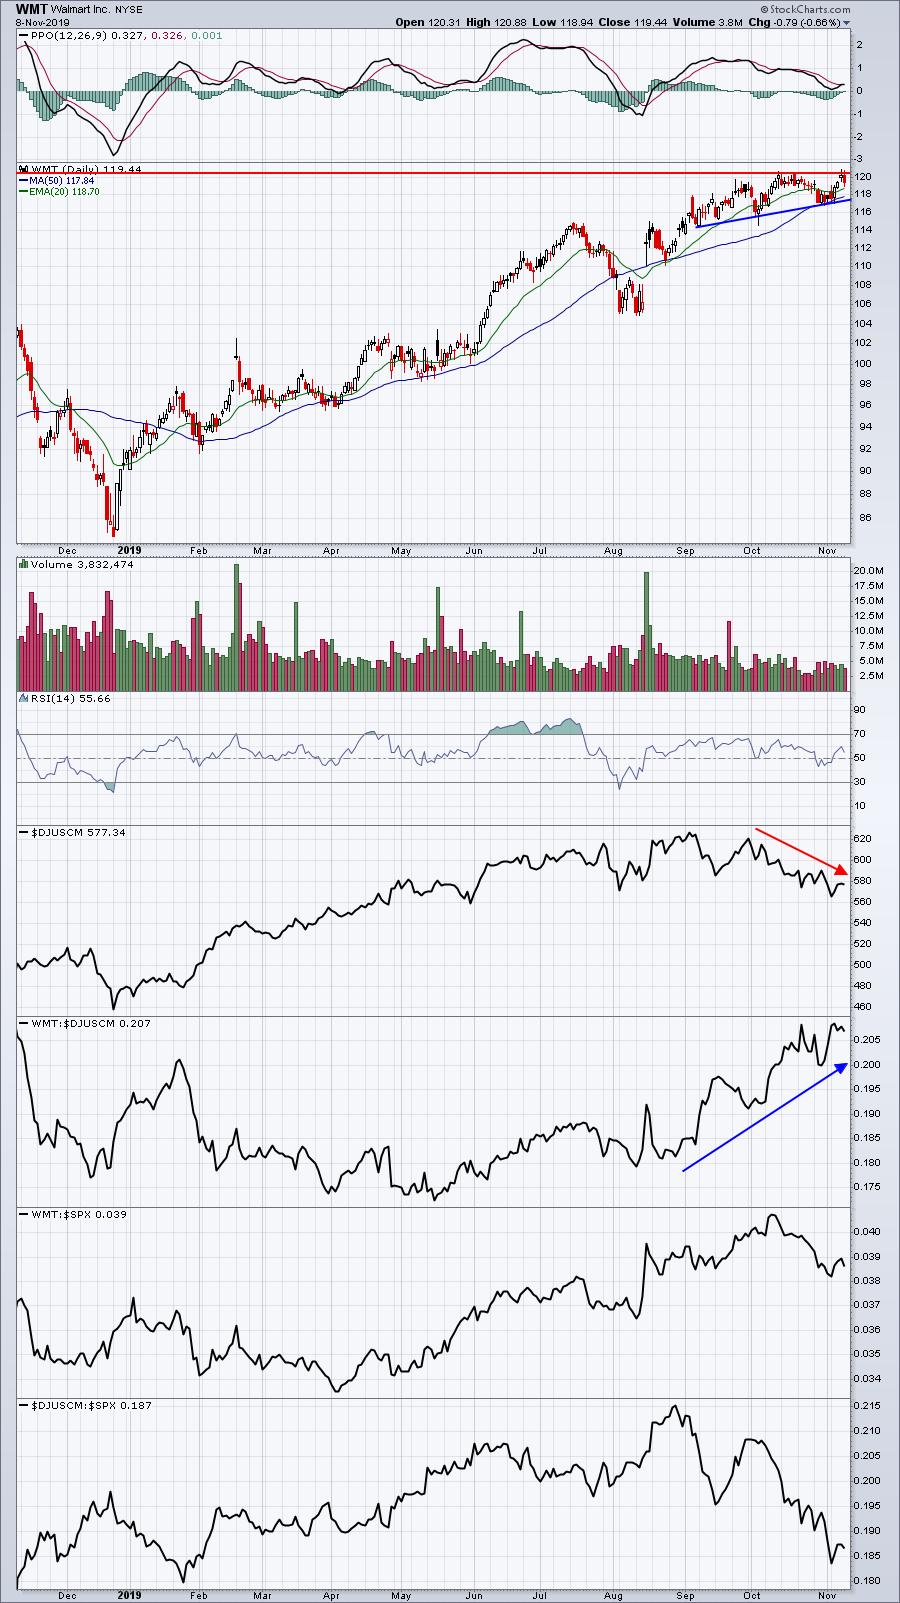
WMT hasn't broken out, but it's rather commendable that it's on the verge of breaking out while its peer group has been falling for 5 weeks. I love that relative strength.
In the meantime, WM has me much more concerned as its industry, waste & disposal services ($DJUSPC), has been holding support, while WM drops more significantly:
WM:
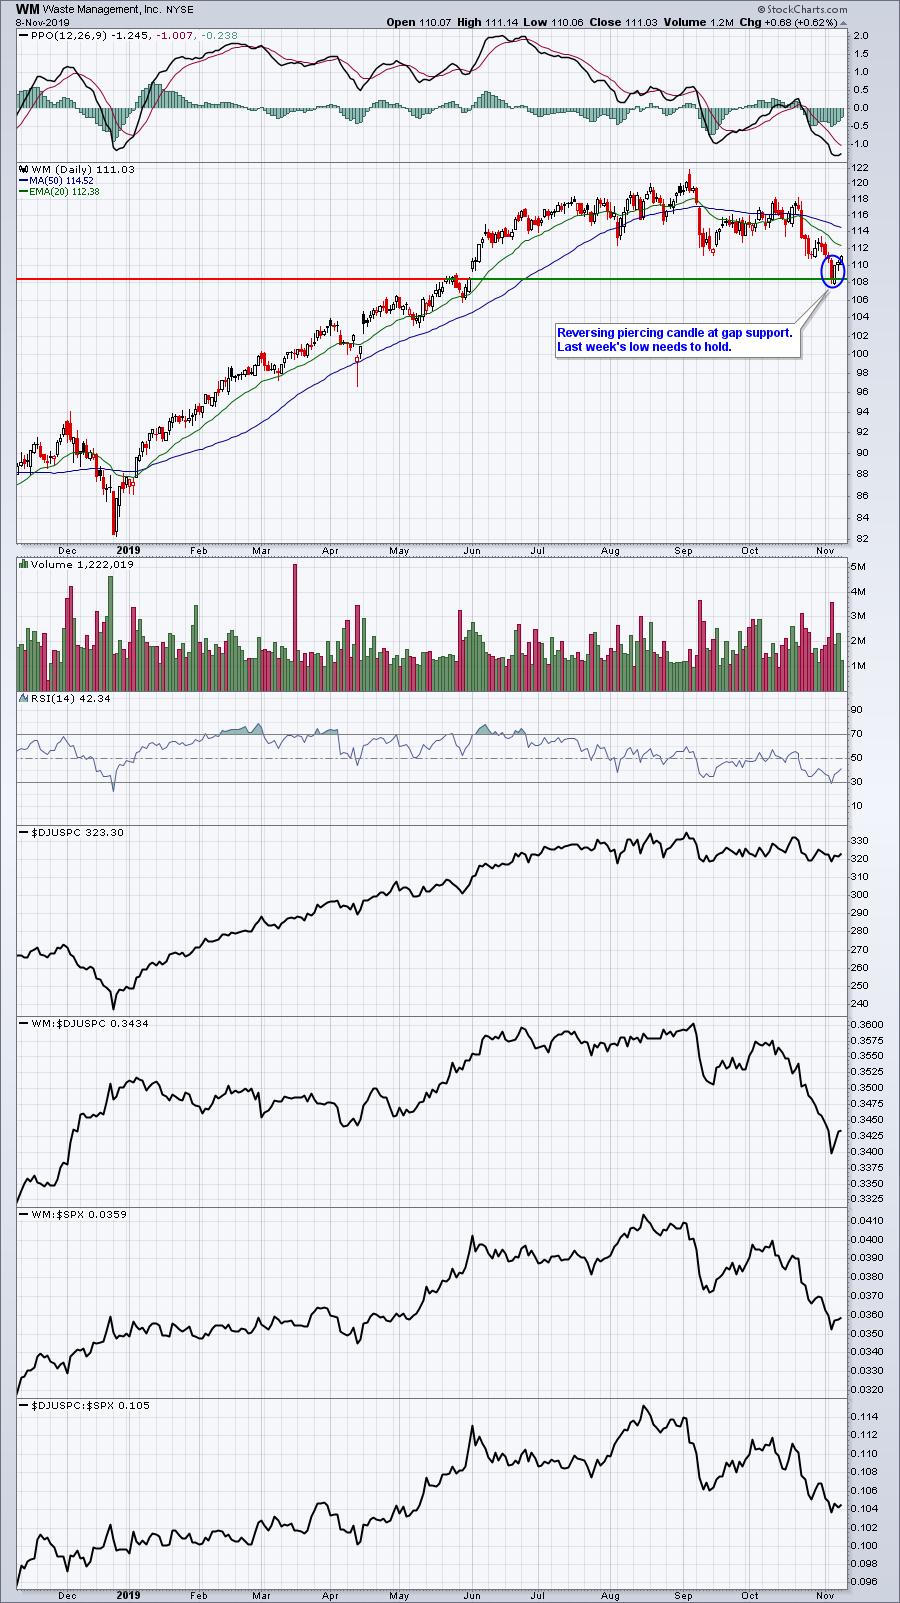
Since WM is now firmly downtrending and volume has expanded to suggest distribution, a rebound to the 20 day EMA would be reason to consider exiting. If you want to make the argument that WM has bottomed, it needs to hold that support level just beneath 108 and break back above its 20 day EMA. For our purposes here at EarningsBeats.com, we will hold all portfolio stocks for the full 90 days until it's time for the selection of new portfolio stocks, but members can decide individually how they want to approach these portfolios.
Summary
This quarter has been grueling. The IWF:IWD relative chart continues to show that aggressive stocks are out of favor as you can see below:
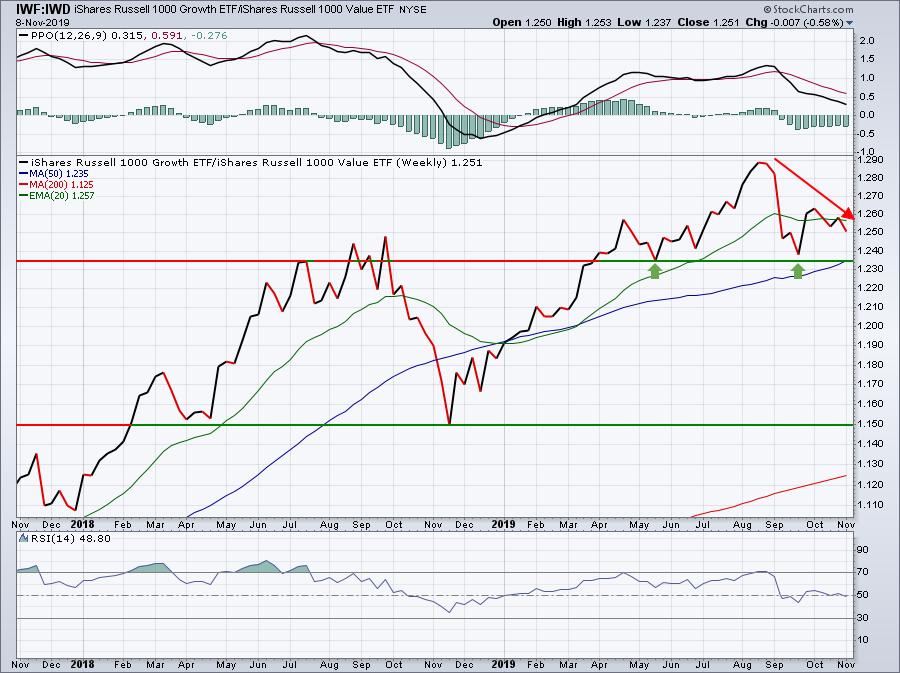
There's no doubt in my mind that this thematic change in the U.S. stock market has caused the significant deterioration in our portfolio performance this quarter. The top in this ratio occurred in August, just as we released our portfolios full of growth stocks. I'm still completely sold, however, on using relative strength to outperform the benchmark S&P 500 and believe we'll have a solid batch of new companies to fill out our portfolios on Tuesday, November 19th.
In the meantime, stay bullish. I think there's a reasonable chance we'll see a bit of selling soon - in the 1% to 2% variety on our major indices - but that ultimately we're looking at a very strong year ahead.
I wish everyone a great week ahead!
Happy trading!
Tom Bowley, Chief Market Strategist
EarningsBeats.com
"Better timing. Better trades."