
EB Weekly Portfolio Report - Sunday, November 17, 2019
Portfolio Rules and Objectives
Here are the common traits and objectives of each portfolio:
- There are 10 leading stocks from 10 leading industries in each portfolio (at the time of selection)
- They are held for an entire 90 day period, with no stops in place
- Every stock will be held through ONE earnings report
- The expectation is that relative winners will carry the portfolio to outperformance
- They are all entered into as of February 19, May 19, August 19, and November 19 (these dates are used as we are generally past the majority of earnings reports by these dates)
- Primary objective is to outperform the benchmark S&P 500
Here are several considerations for EB members:
- I would expect the Aggressive portfolio to be the riskiest, followed by the Model portfolio, and then the Income portfolio
- The Income portfolio stocks will all pay dividends, with the expected average dividend yield to be at least 1.5%
- Drawdowns (losses) should be much milder on the Income portfolio, with much more volatility on the other two
- You should own or trade these stocks in whatever manner is most comfortable for you; while we buy all 10 stocks as of the dates identified above, feel free to trade certain stocks or wait for pullbacks if the stocks are overbought
- We have no idea what risk each member is willing or able to take. We are not registered investment advisors so be sure you understand the risk you take.
- EarningsBeats.com shareholders/employees may own all or some of the portfolio stocks from time to time.
Weekly Summary
Benchmark S&P 500:
It was a landmark week for the S&P 500 as it closed above 3100 for the first time in history on Friday. For the week, the S&P 500 gained 0.89%.
Here is a recap of S&P 500 performance last week by sector:
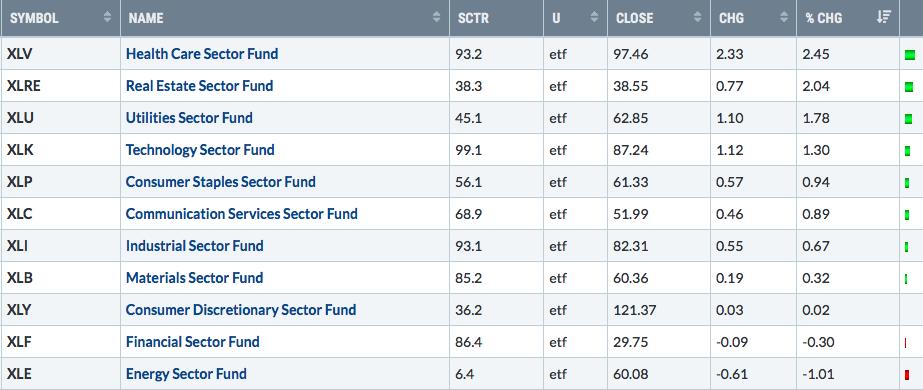
Healthcare (XLV) was the leader and we saw strength throughout the sector:
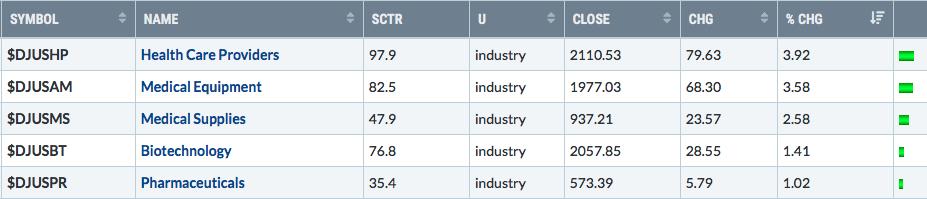
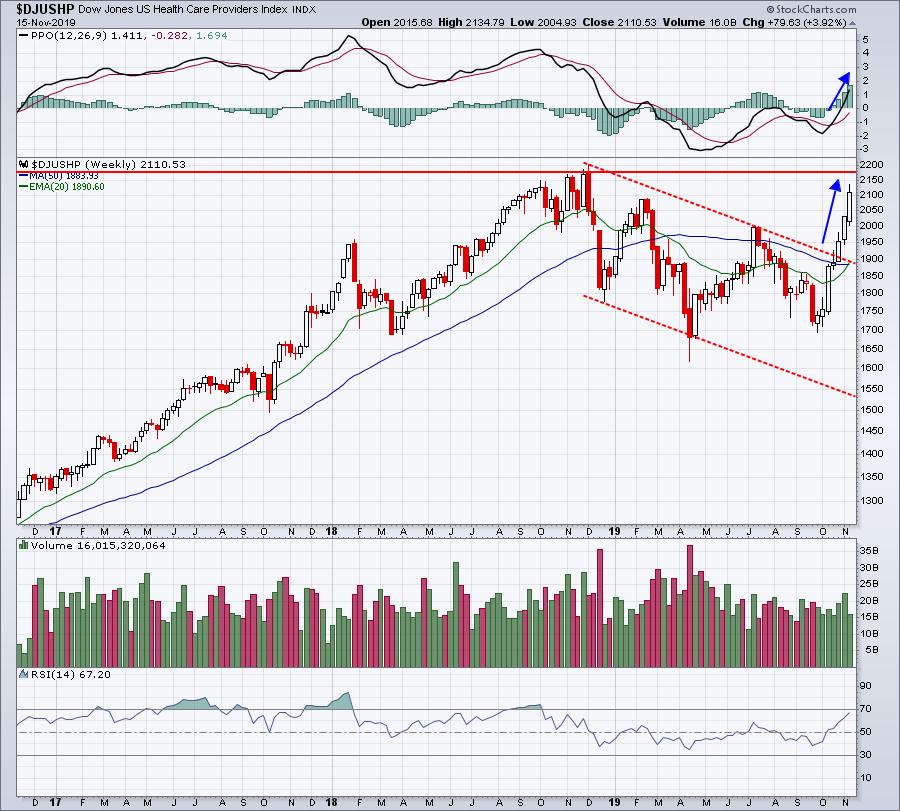
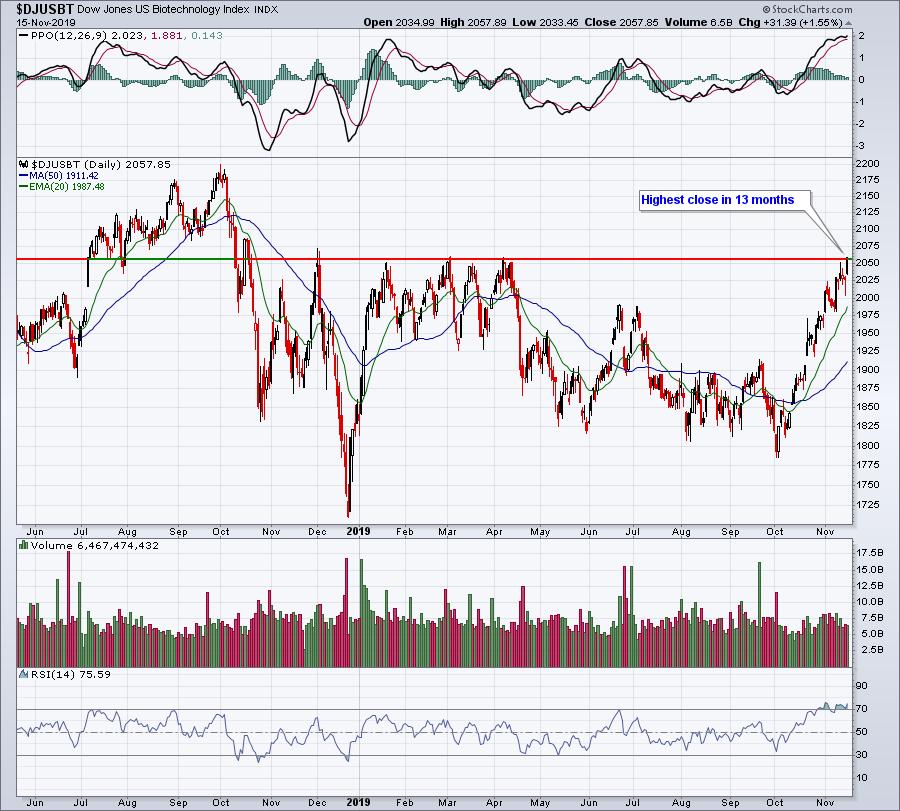
Health care providers ($DJUSHP) and biotechnology ($DJUSBT) have made significant breakouts recently as you can on the charts below:
$DJUSHP:
$DJUSBT:
It was a nice week and we're beginning to see how the market evolves during a major bull market run - rotation sends many sectors and industries into breakout territory. Wide participation is a key ingredient to any bull market as it encourages new money to keep rolling in.
Model Portfolio:
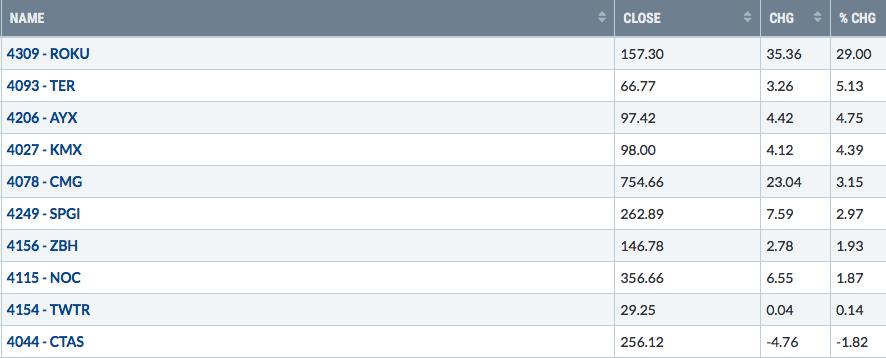
The Model portfolio surged 5.12% last week and is now down just 0.89% since August 19th, the date of the last selection process. ROKU was a monster, gaining 29%, but the overall key was the return to strength among many growth stocks. The following is a one month relative chart of the IWF:IWD (Russell 1000 growth vs. value ratio):
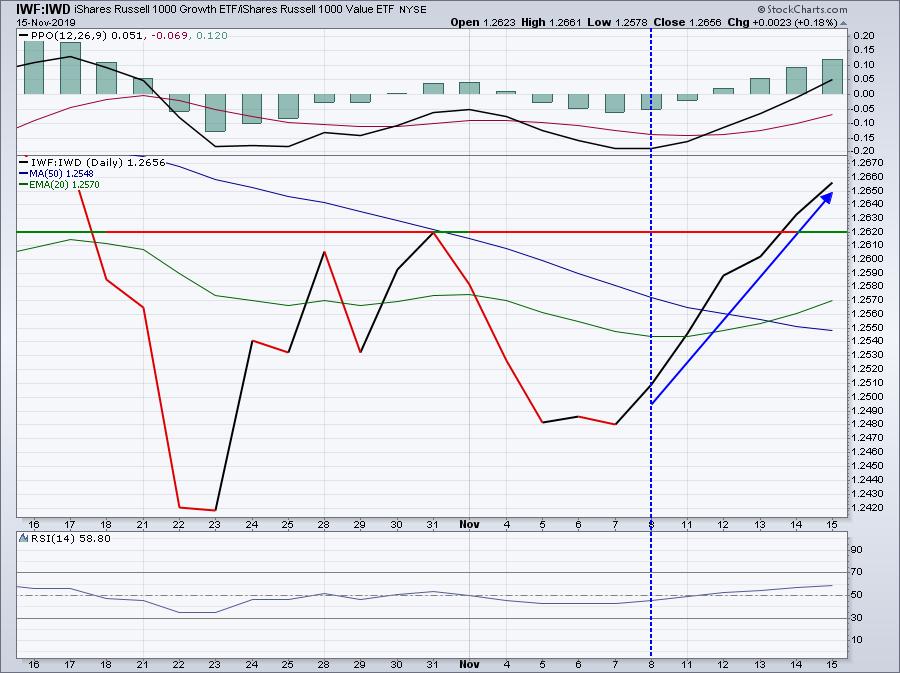
The pop in this ratio last week (it advanced every day) provided a much better backdrop for our portfolios and the Model portfolio, behind ROKU's impressive week, took full advantage.
Here is a current look at the Model portfolio's user-defined index that I track daily at StockCharts.com:
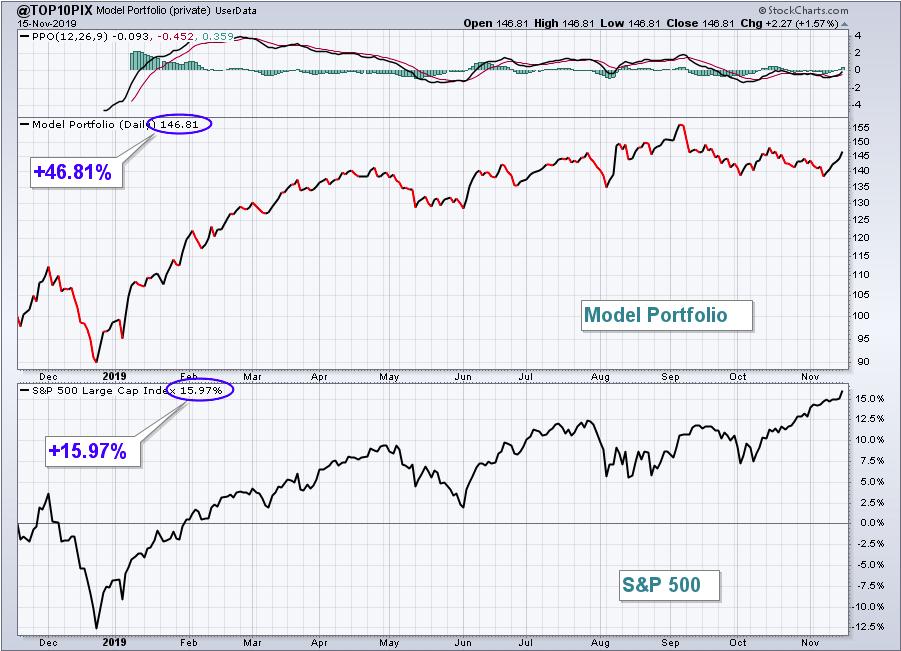
Strong performance last week was clearly led by the huge advance in ROKU, but it's worth noting that 8 of the 10 portfolio stocks out-gained the benchmark S&P 500. Here's a recap of how each stock in the Model portfolio performed last week:
The one stock that I'd like to specifically highlight is AYX. Software stocks ($DJUSSW) have broken out again and AYX has been very slow to react. But its weekly chart remains very solid despite all the selling the past two months. On Friday, AYX broke back above its 20 day EMA. If it can hold that moving average, we could see a strong week ahead:
AYX:
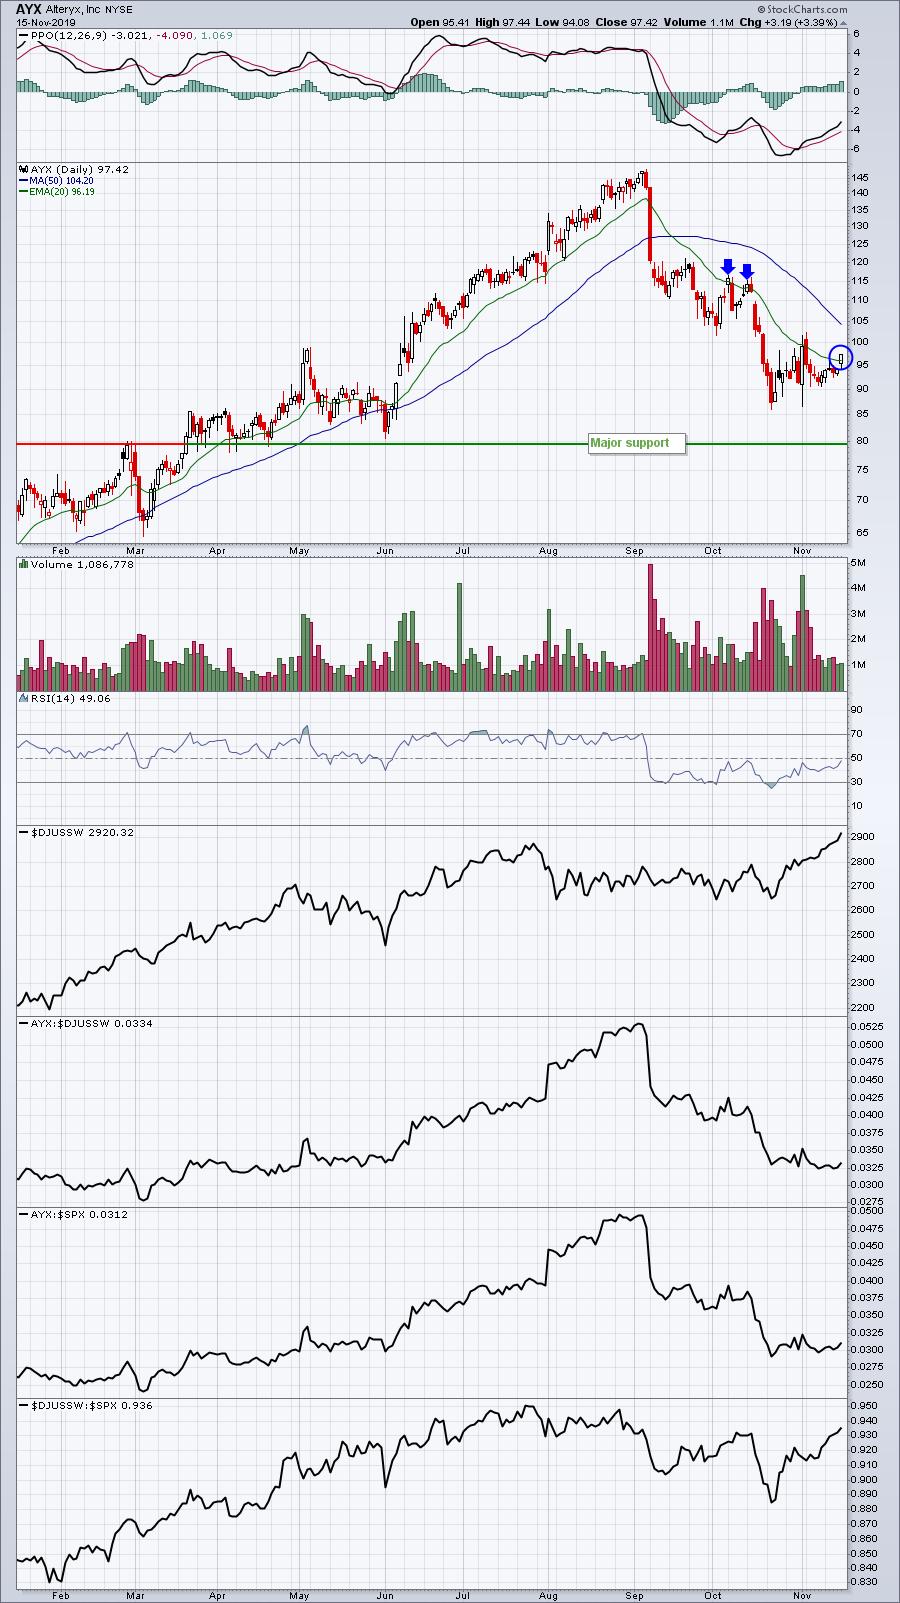
Watch the AYX:$DJUSSW relative line. Thus far, AYX is attempting an absolute rebound, but it could simply be because software broke out. We want to see relative leadership return or the story isn't the same. The red arrows above show two prior attempts at clearing the 20 day EMA and they both immediately failed. Watch to see how AYX performs on an absolute basis first to see if it holds that 20 day EMA, then check to see if it's relative strength is returning. If both occur, that would be quite bullish.
Aggressive Portfolio:
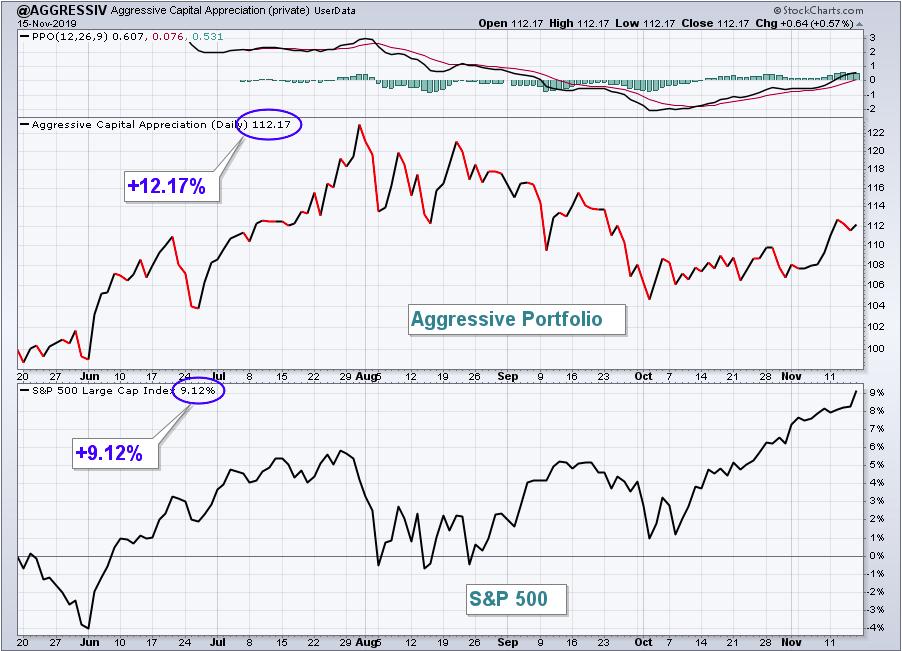
The Aggressive portfolio rallied and topped the S&P 500 performance last week, gaining 2.65%. The return of growth stocks helped this portfolio last week for sure. Here's the Aggressive portfolio's chart since inception:
Last week, this portfolio was saved by a huge earnings report of and big rally by EverQuote (EVER). Profit taking in EVER last week hurt the Aggressive portfolio, but it still managed to produce a nice week. Here is how each Aggressive portfolio stock performed last week:
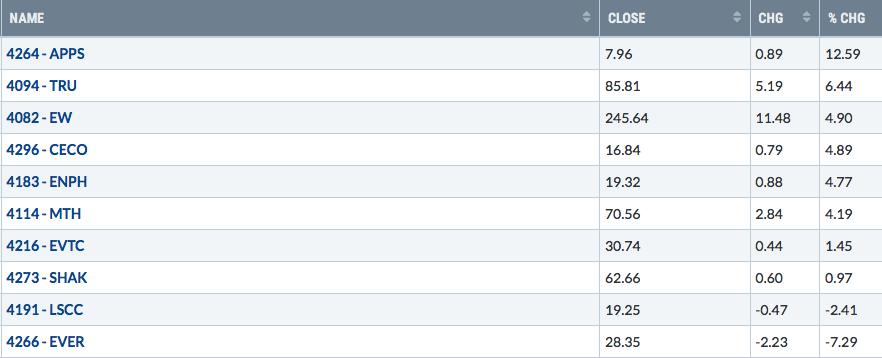
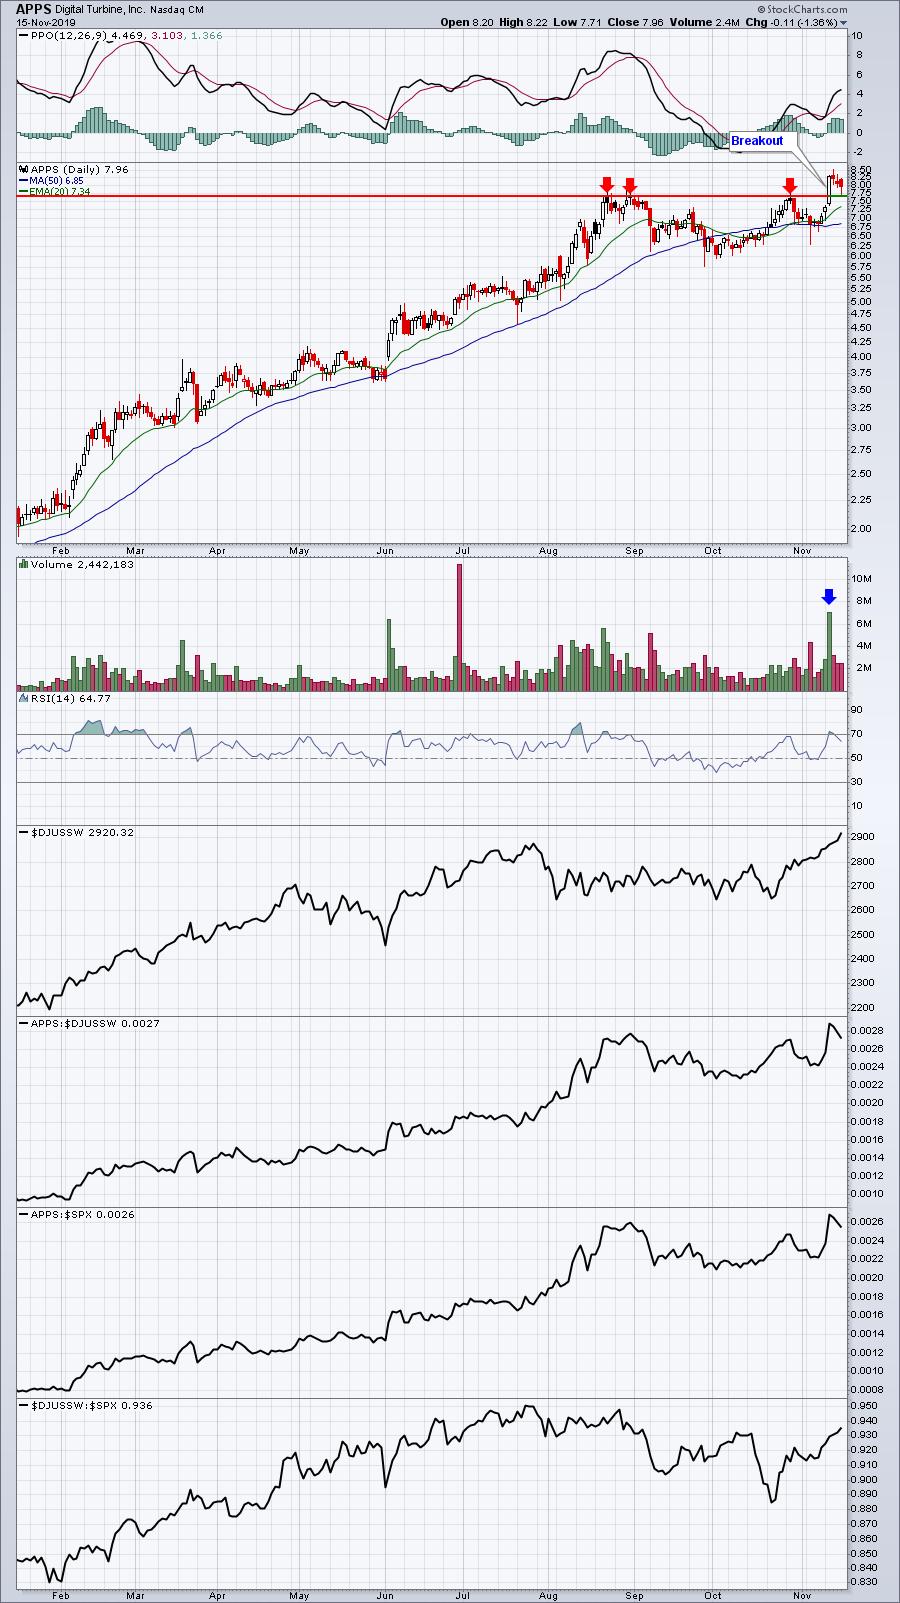
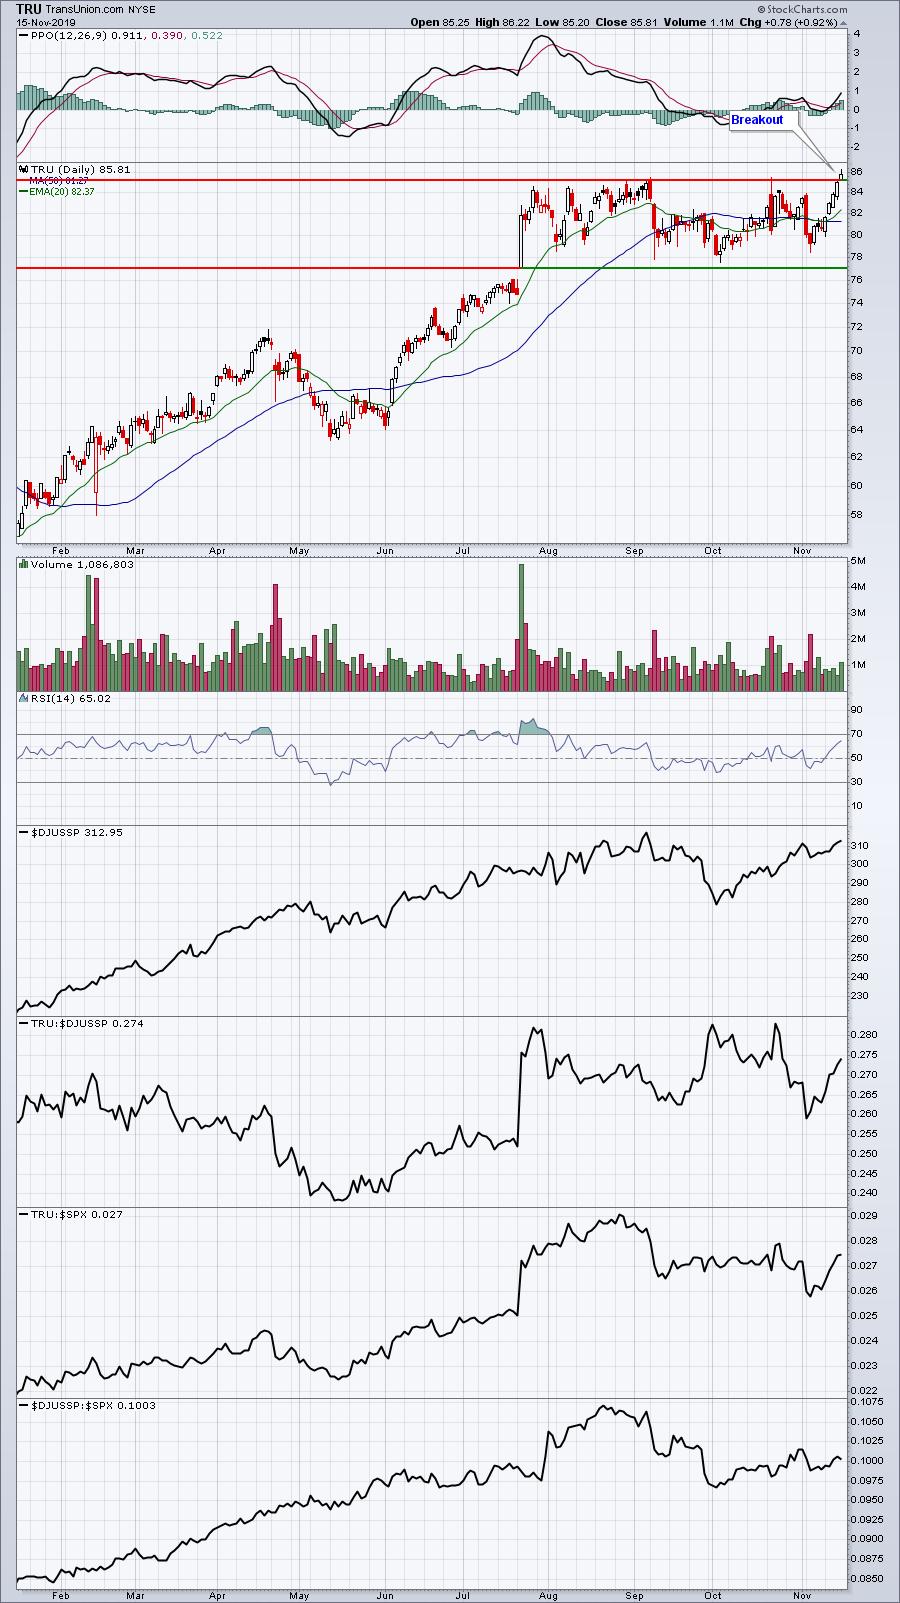
Like the Model portfolio, 8 Aggressive portfolio stocks outperformed the S&P 500. APPS was the big winner as it made a significant breakout. TRU and EW also broke to new highs:
APPS:
TRU:
EW:
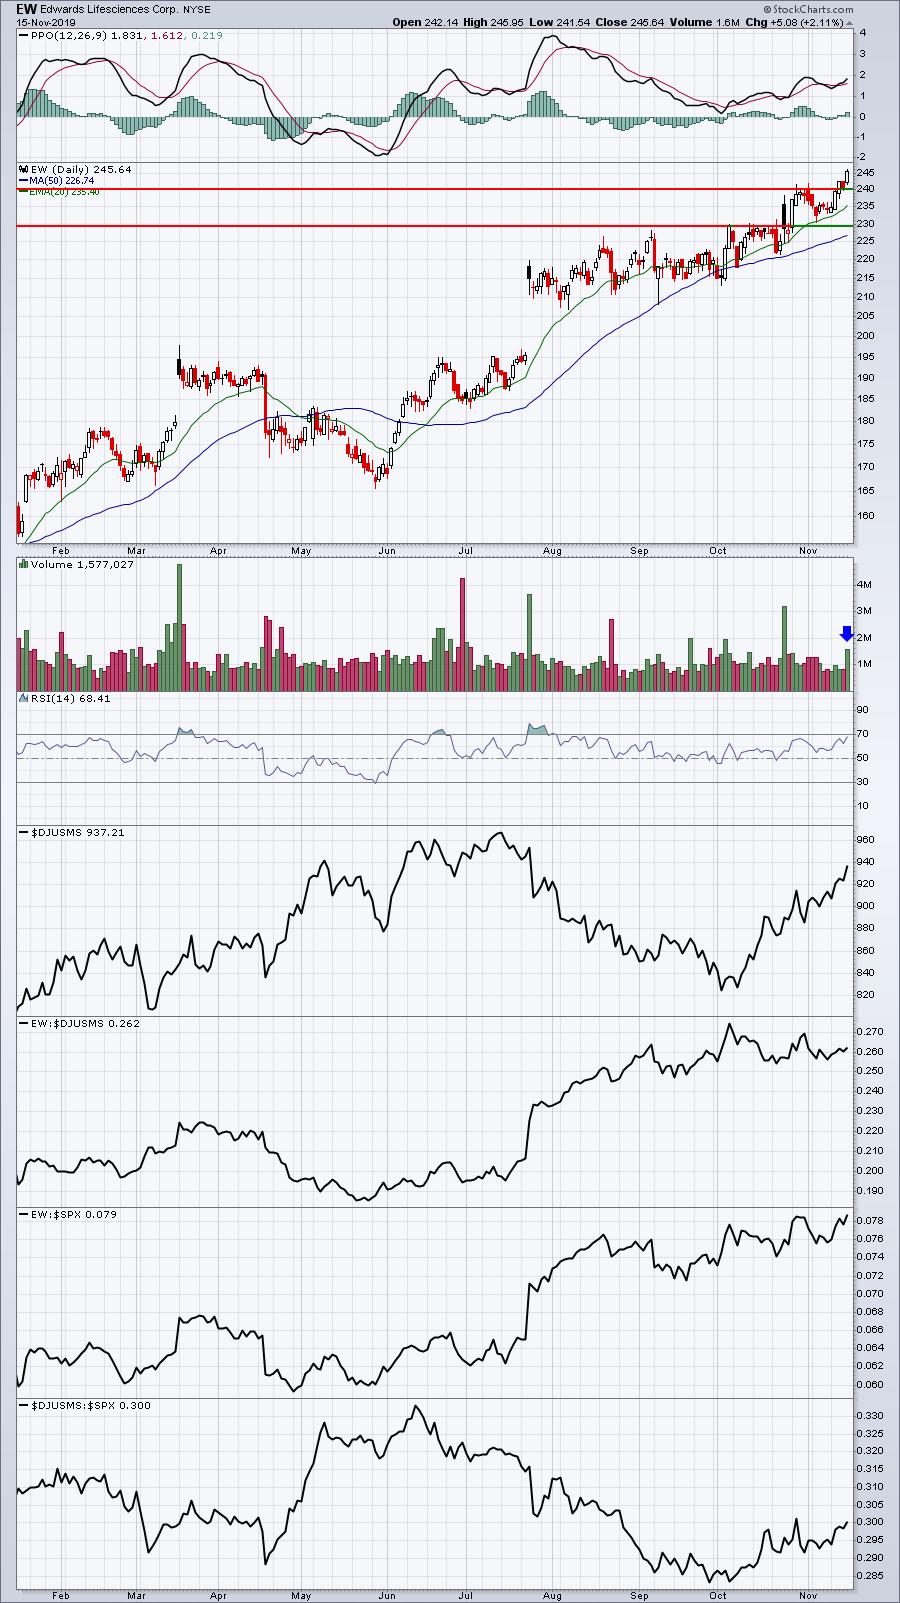
All three stocks look quite solid, but EW was able to take advantage of the relative strength in healthcare last week. I'm still expecting another surge from Lattice Semiconductor (LSCC) as that industry has been on fire and LSCC hasn't really had its turn at a run. Perhaps it will catch up next week. Currently, it's consolidating in sideways fashion after an uptrend, which isn't a bad thing. But we'll need to see a breakout to confirm the bullish continuation pattern.
Income Portfolio:
The Income portfolio gained 1.68% last week, which enabled our portfolios to go 3 for 3 in terms of outperforming the S&P 500. We hadn't seen one of those weeks in quite some time. Here's a chart of the Income portfolio since its May inception as it broke out to its highest level:
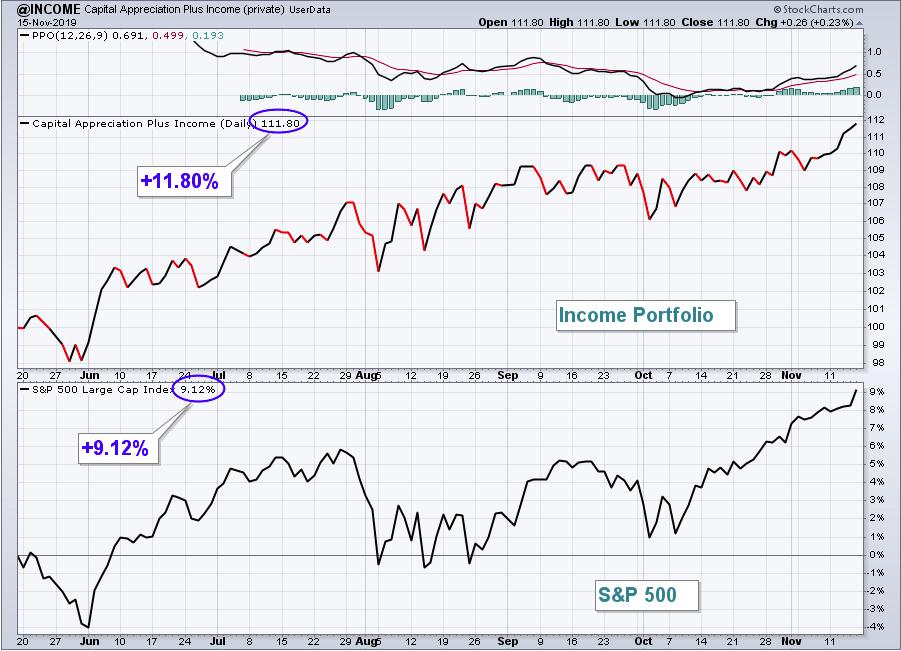
It stretched its lead over the S&P 500 to 2.68 percentage points. Keep in mind that dividends are ignored in our portfolio performance calculations and the average yield on the Income portfolio is just under 2% annually (or 0.50% quarterly).
Here are how the individual stocks in the Income portfolio performed last week:
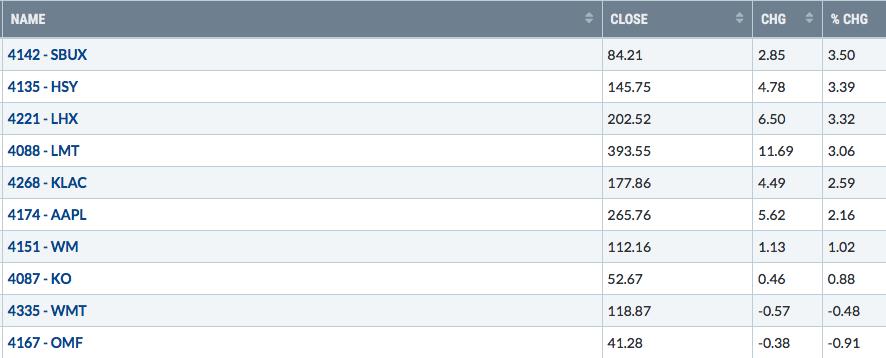
7 stocks outperformed the S&P 500, while KO essentially tracked the index. WMT seems to have topped, at least near-term, after reporting mixed results. Its initial reaction was higher, but the reversal doesn't look good on the chart:
WMT:
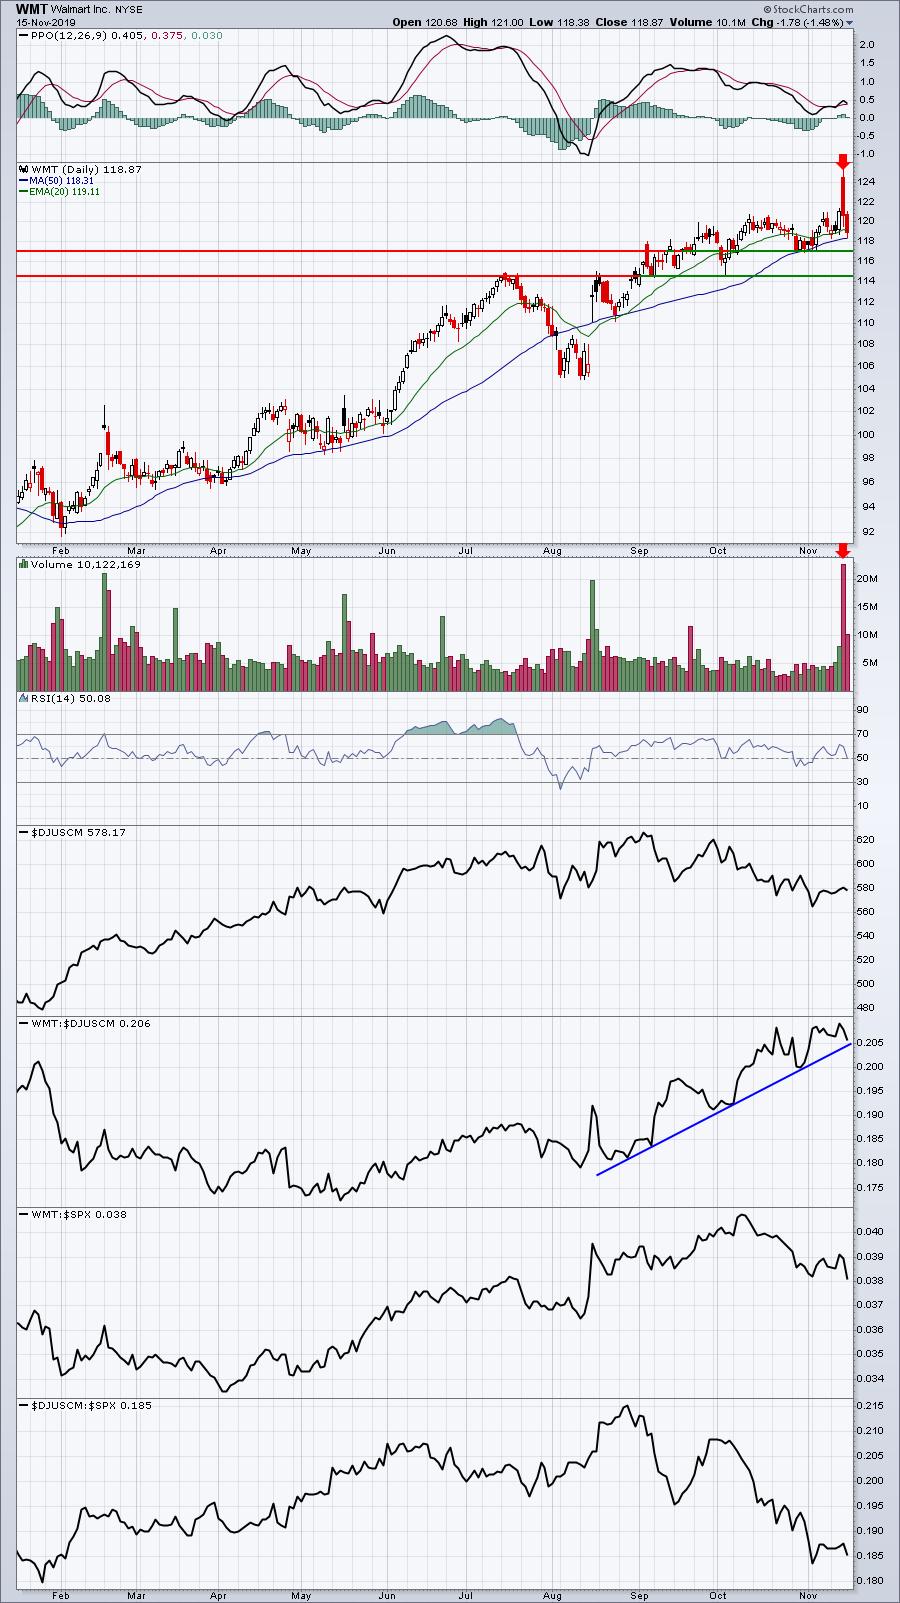
The earnings reversal came on extremely heavy volume (red arrows) and last week I pointed out that WMT's peer group has been weak. I annotated two price support lines worth watching and also indicated that last week's relative strength deteriorated as WMT is now testing its relative strength uptrend line. Its earnings report was mixed so my bullishness here is definitely tempered.
Summary
Last week's performance was much needed heading into our Selection Tuesday, where we'll unveil our Top 10 stocks for each portfolio. I've been asked by a few members if I could let them know if we're keeping certain stocks in our portfolios in the quarter ahead. I understand the rationale as they'd rather not sell, just to buy the stock back again. First of all, I literally go through all the charts on our SECL (Strong Earnings ChartList) on Tuesday to make the selections, so providing that information ahead of time isn't really practical. I literally could be deciding between stocks at 4pm EST. Second, even if a stock stays in a portfolio, a rebalancing would be required so keeping a position as is just doesn't work.
Let's hope we have another strong couple days to start the week and hopefully launch into a great quarter ahead with new market leaders!
I wish everyone a great week ahead!
Happy trading!
Tom Bowley, Chief Market Strategist
EarningsBeats.com
"Better timing. Better trades."