
EB Weekly Portfolio Report - Sunday, December 1, 2019
Portfolio Rules and Objectives
Here are the common traits and objectives of each portfolio:
- There are 10 leading stocks from 10 leading industries in each portfolio (at the time of selection)
- They are held for an entire 90 day period, with no stops in place
- Every stock will be held through ONE earnings report
- The expectation is that relative winners will carry the portfolio to outperformance
- They are all entered into as of February 19, May 19, August 19, and November 19 (these dates are used as we are generally past the majority of earnings reports by these dates)
- Primary objective is to outperform the benchmark S&P 500
Here are several considerations for EB members:
- I would expect the Aggressive portfolio to be the riskiest, followed by the Model portfolio, and then the Income portfolio
- The Value portfolio is a new breed and is much different from the others; it's quite diversified, but how it ranks in volatility among the four remains to be seen - I would anticipate high volatility
- The Income portfolio stocks will all pay dividends, with the expected average dividend yield to be at least 1.5%
- Drawdowns (losses) should be much milder on the Income portfolio, with more volatility expected on the other three
- You should own or trade these stocks in whatever manner is most comfortable for you; while we buy all 10 stocks as of the dates identified above, feel free to trade certain stocks or wait for pullbacks if the stocks are overbought
- We have no idea what risk each member is willing or able to take. We are not registered investment advisors so be sure you understand the risk you take.
- EarningsBeats.com shareholders/employees may own all or some of the portfolio stocks from time to time.
Snapshot
Here's a weekly recap:
Weekly Summary
Benchmark S&P 500:
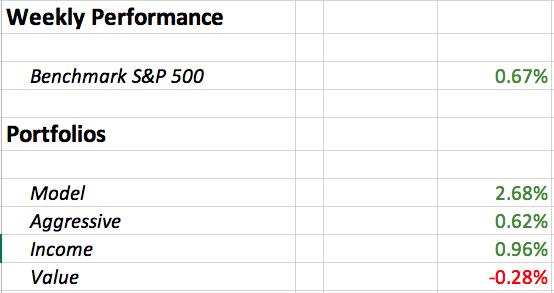
Despite a bit of selling on Friday, the S&P 500 had another very solid week, gaining 0.67%. There are a few subtle warning signs about the next couple weeks, however. Let's start with the daily chart that shows a slight negative divergence:
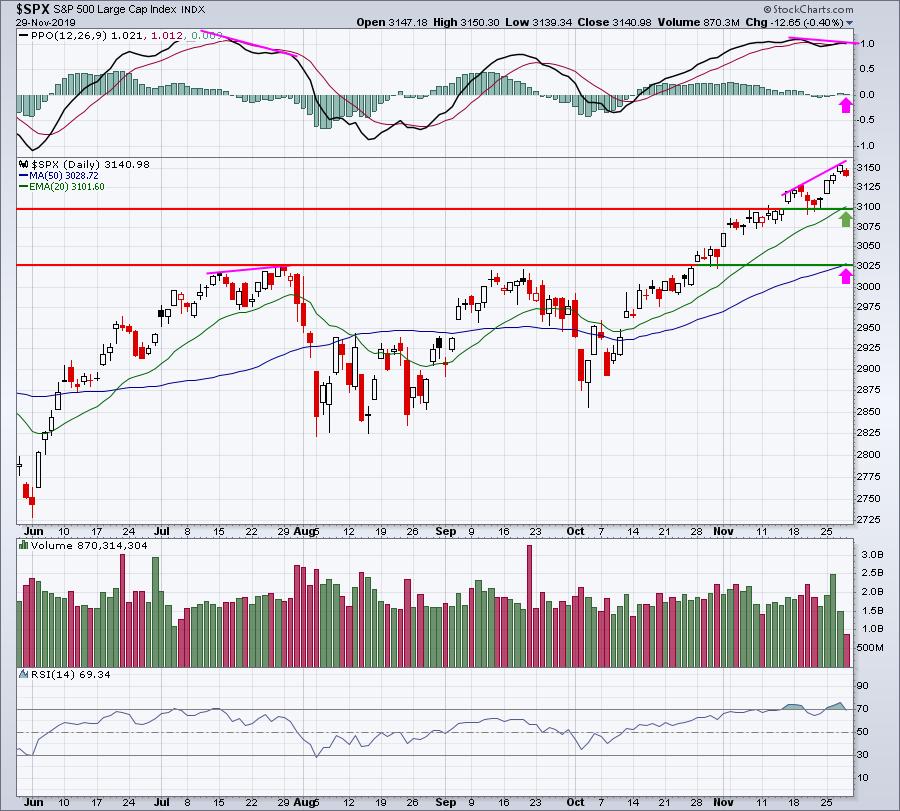
One thing to understand about divergences is that they can simply go away. If the S&P 500 strengthens this week, it's quite possible the PPO turns higher again and eliminates that negative divergence. For now, however, it's there.
Then the hourly S&P 500 chart:
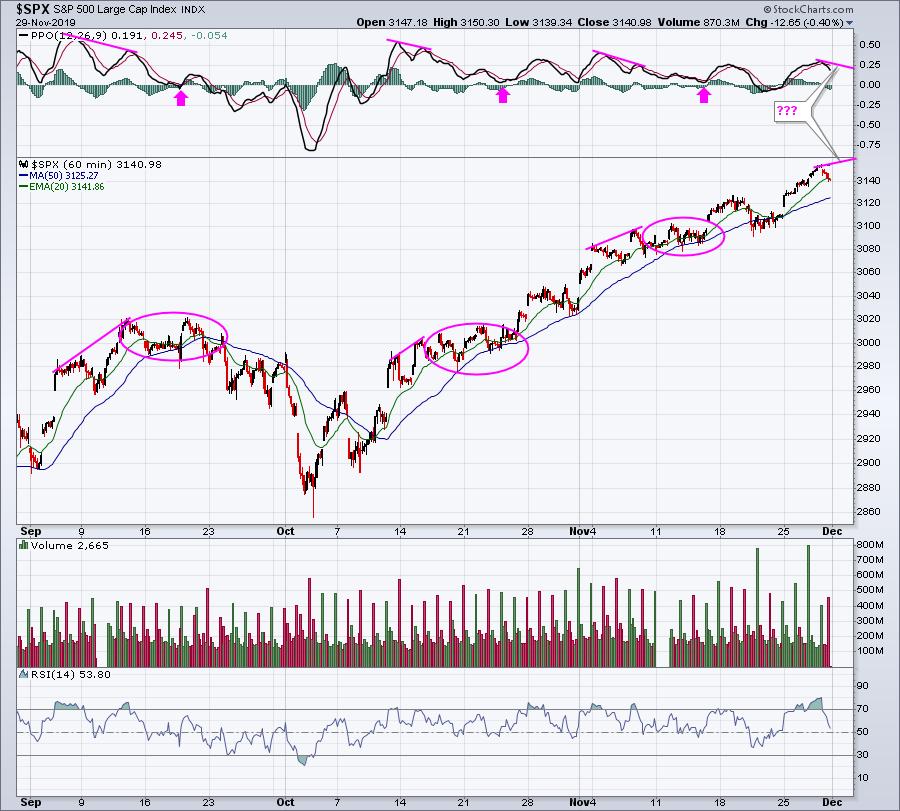
Negative divergences are beginning to appear so we need to consider the strength of any short-term rally. If we continue to edge higher, I suspect we'll see a negative divergence emerge on the hourly chart and we already have one, though slight, on the daily chart.
I would look for a further rally near-term, but as we move deeper into next week, it could be time for a market pause similar to those pink circles shown above on the hourly chart.
Model Portfolio:
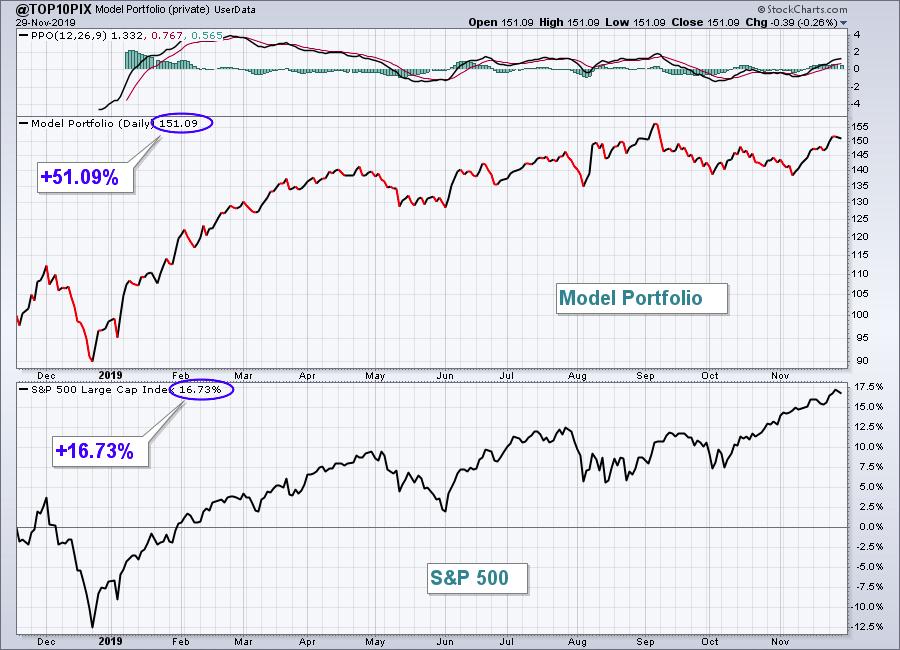
The Model portfolio was strong last week, gaining 2.68%. Here's the updated inception-to-date chart of the portfolio:
Here are how the Model portfolio component stocks performed last week:
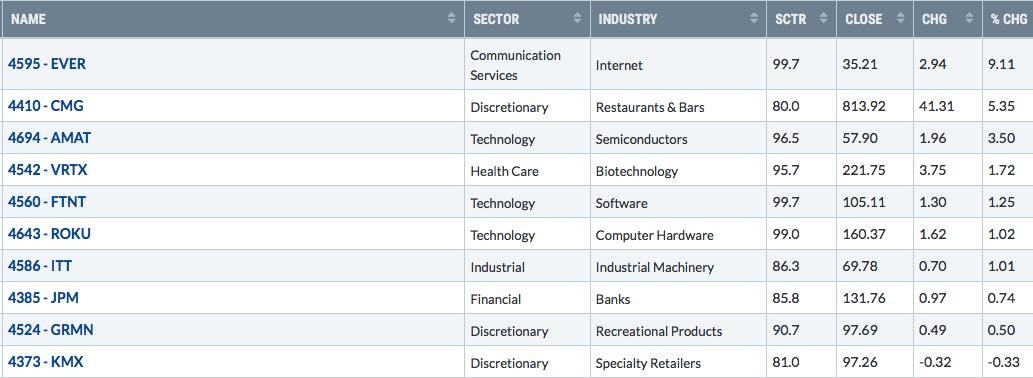
While the portfolio had a very solid week, GRMN and KMX were both disappointing. Consumer discretionary (XLY) was the second best performing sector, yet two of our three discretionary stocks underperformed the S&P 500. Here are the two charts:
GRMN:
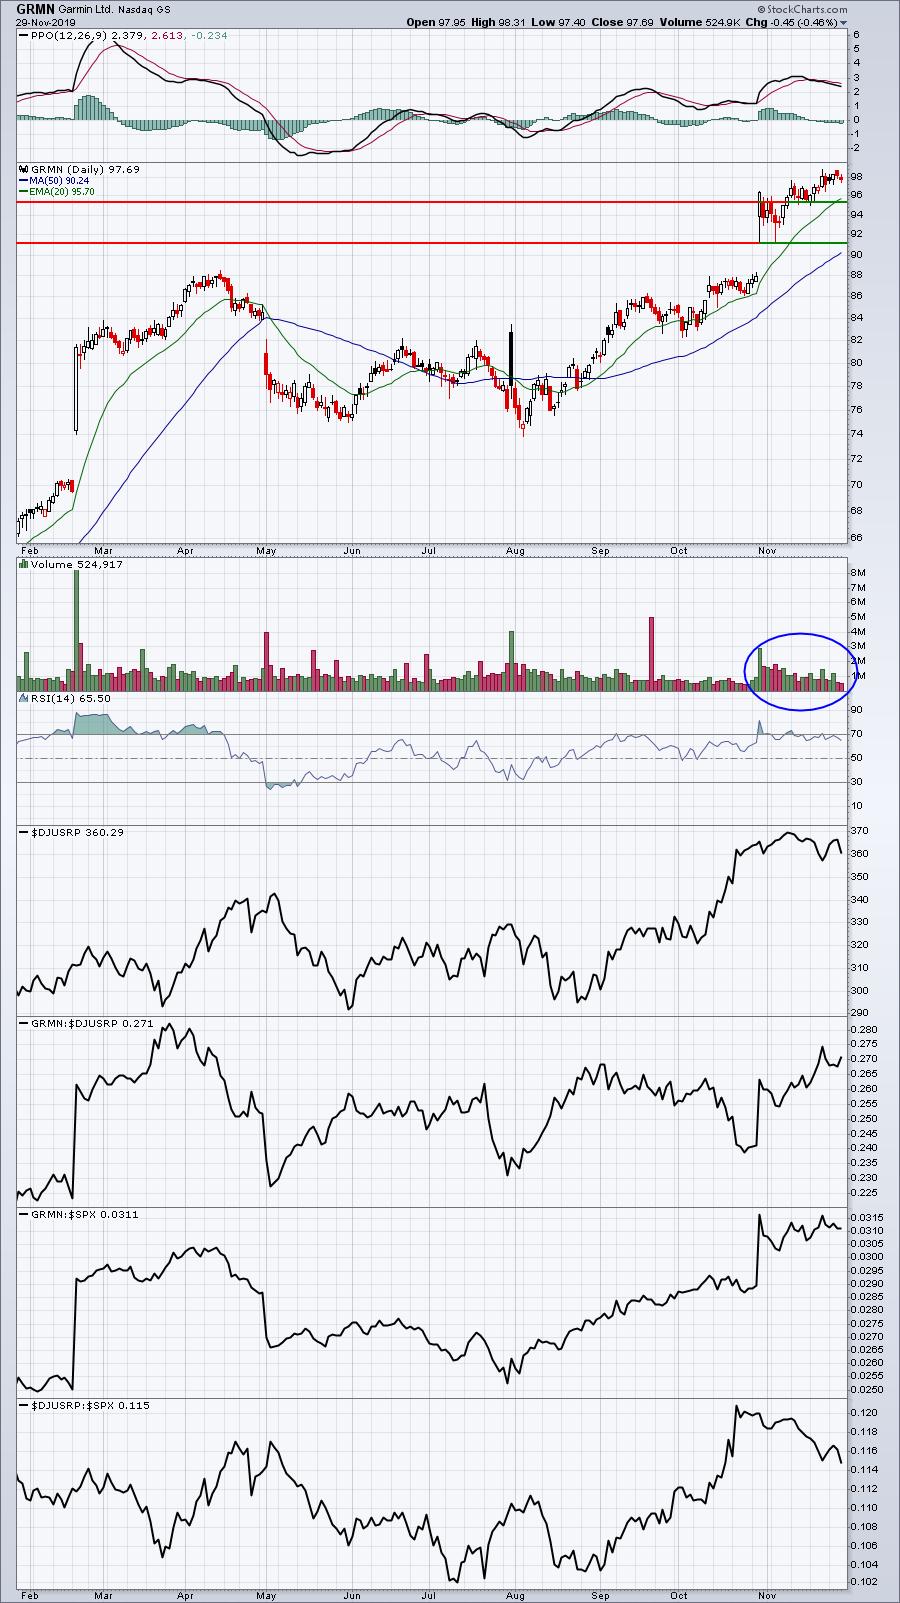
Volume trends remain quite strong and I'd expect any trip down to 95.25-96.00 would find buyers.
KMX:
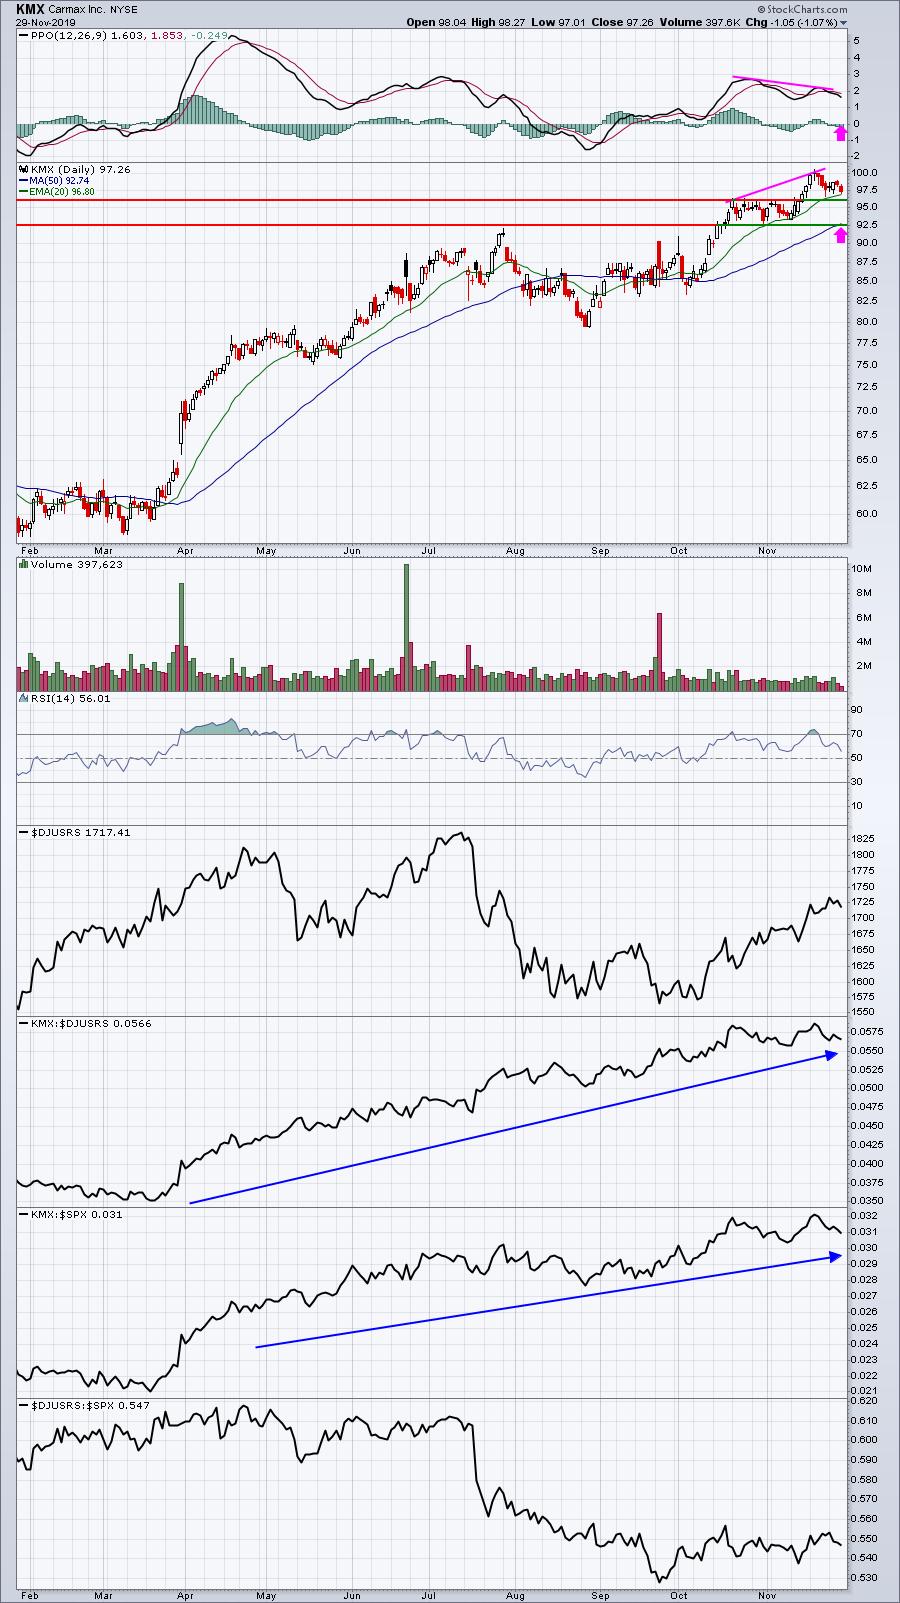
The negative divergence combined with lesser volume suggests that KMX could have more downside in the near-term, though it clearly remains a leader among specialty retailers ($DJUSRS).
Aggressive Portfolio:
The Aggressive portfolio was strong early in the week, but gave back some gains and ended up gaining 0.62%, nearly the same as the S&P 500. Here's the Aggressive portfolio chart since its inception on May 19, 2019:
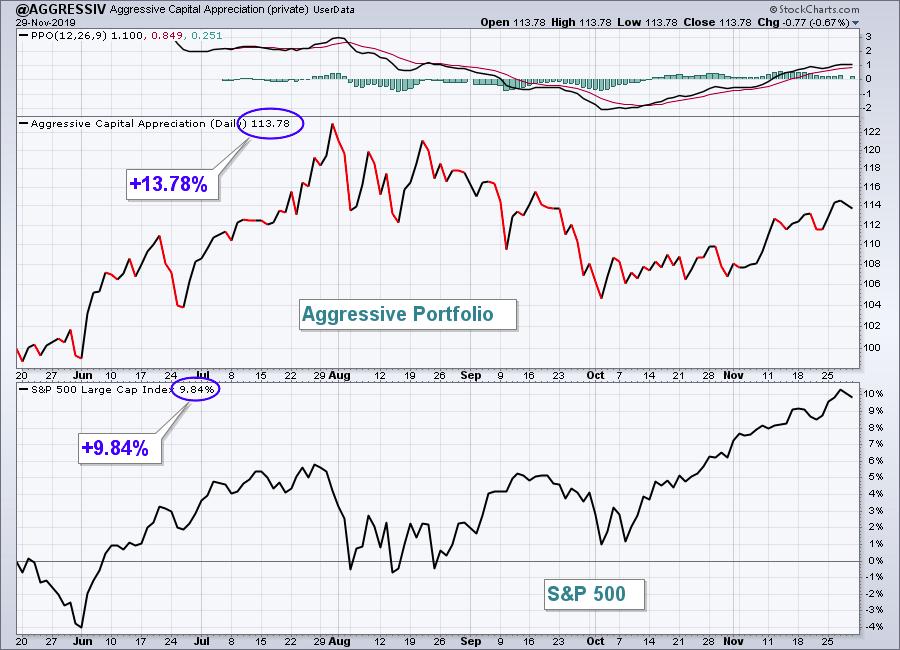
Here are how the Aggressive portfolio component stocks performed last week:
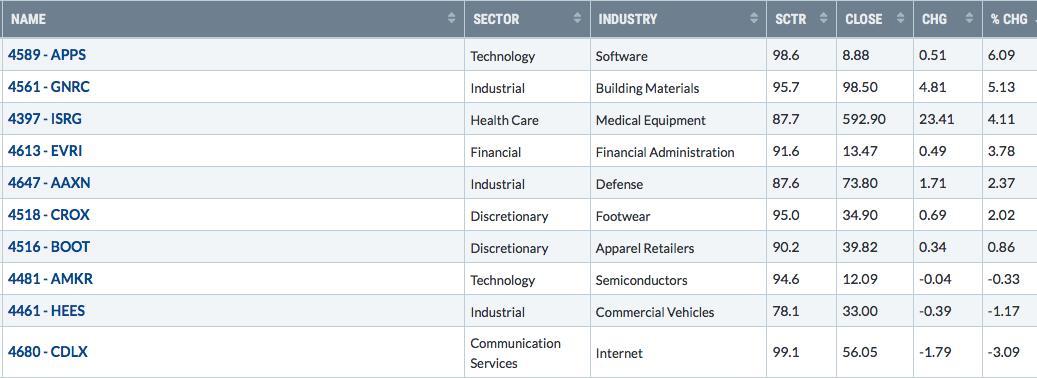
These weekly results are a bit skewed because they look at the last five trading days. Since Thursday was a holiday, the above weekly percentages include last Friday's results, which were very strong for the Aggressive portfolio. Still, the above gives us an idea of where the strength has come from. Software ($DJUSSW) has been bouncing back and the leadership in APPS continues to shine through:
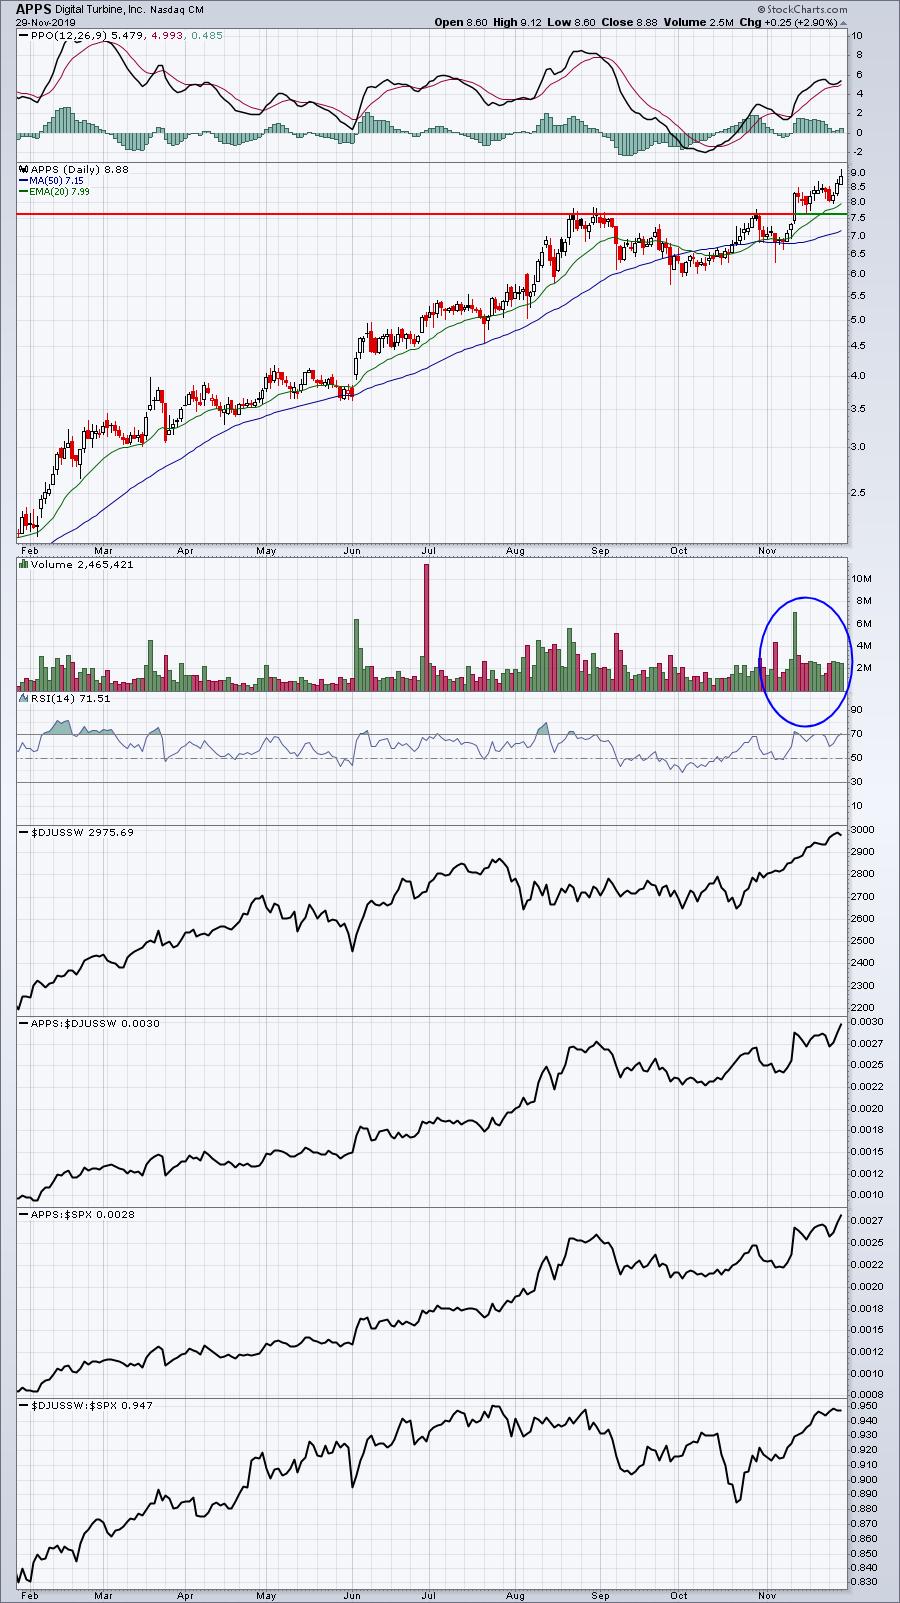
APPS closed at another absolute and relative high on Friday. Note the very solid volume that has coincided with these breakouts. APPS looks very strong.
Income Portfolio:
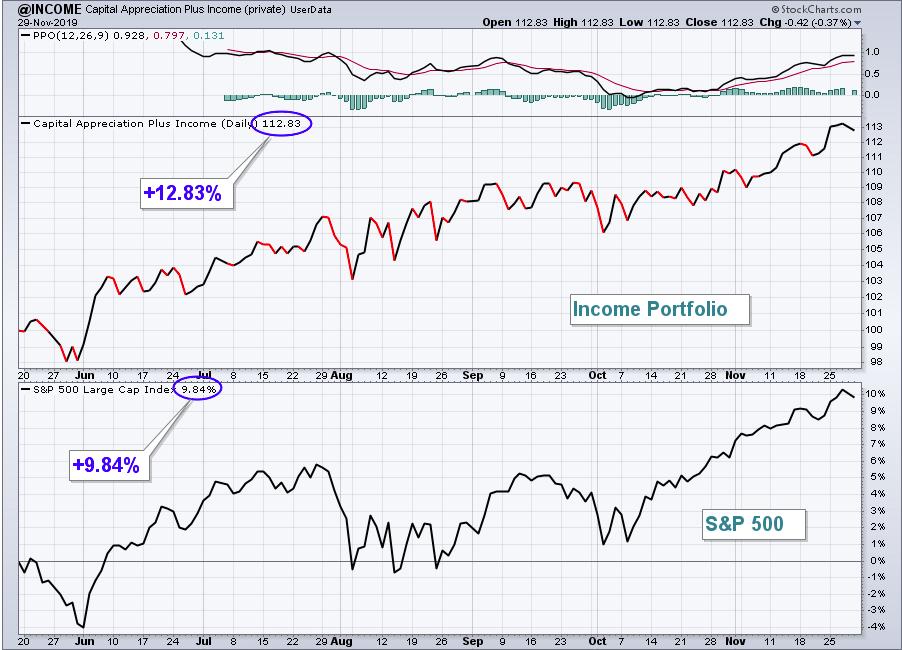
The Income portfolio gained 0.96% last week, eclipsing the S&P 500's gain. It's now a full 3 percentage points higher than the benchmark S&P 500 in just over 6 months, very impressive considering that it's been comprised of mostly household, dividend-paying names. Oh, and by the way, dividends are not included in the Income portfolio returns. Here's a look at the inception-to-date chart:
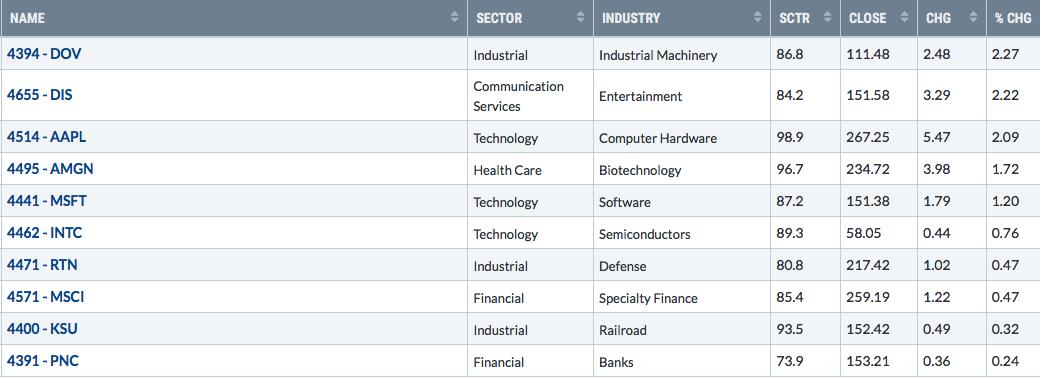
Here are how the Income portfolio component stocks performed last week:
Banks hit overhead price resistance, just above the 500 level and that no doubt had an impact on PNC Financial (PNC), which stalled as well:
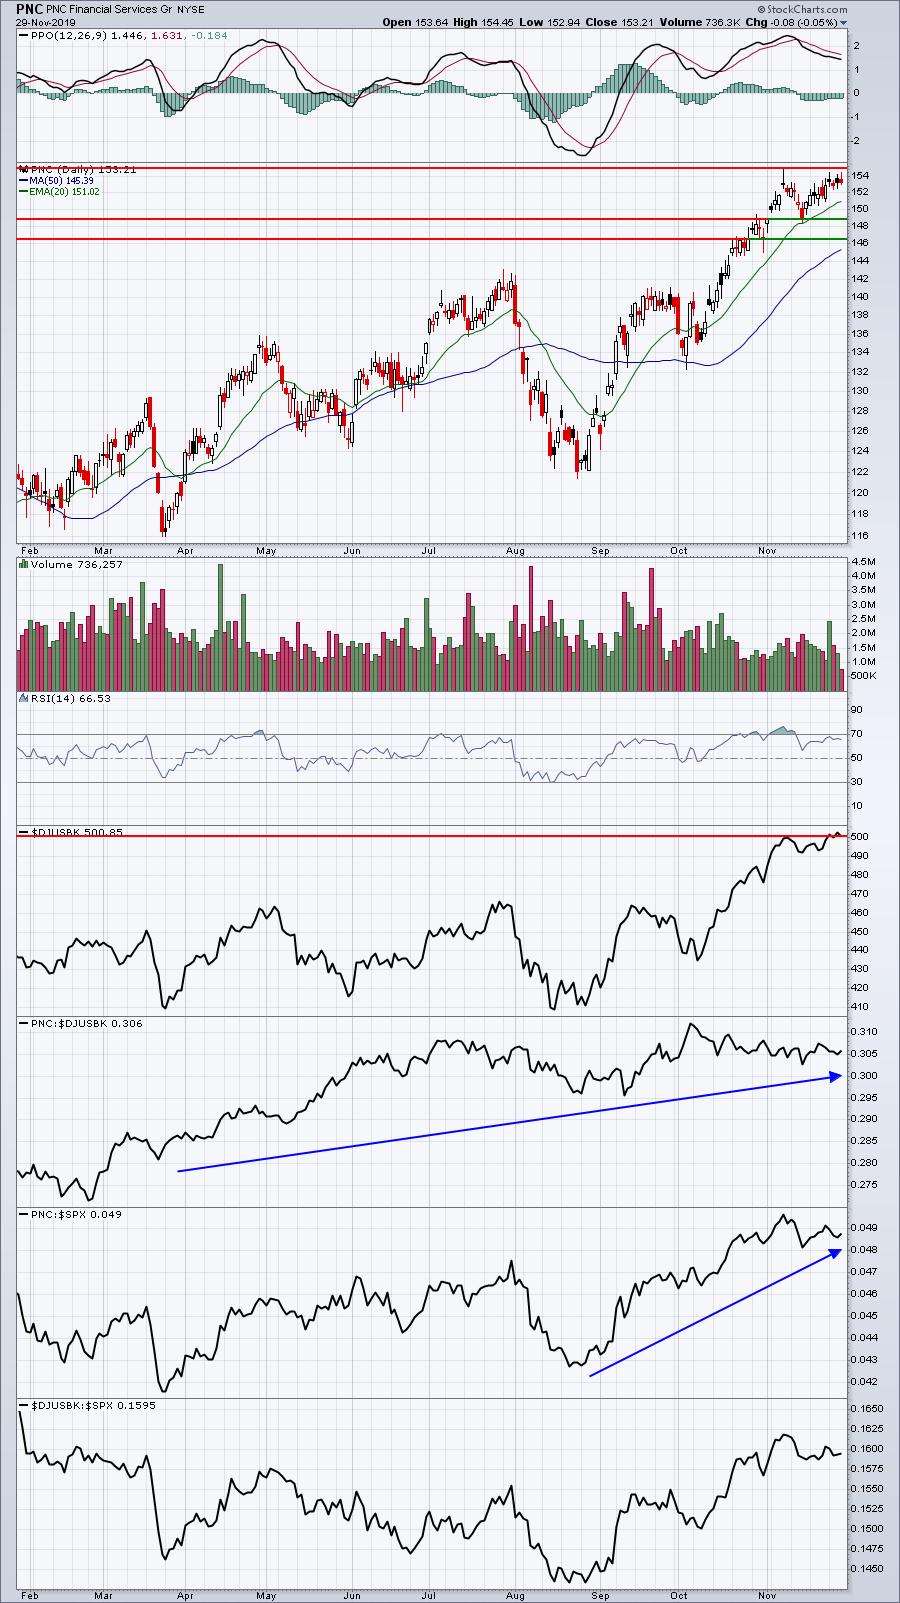
PNC does remain a leader among banks ($DJUSBK) and the overall group has held up well despite the 10 year treasury yield losing 20 basis points over the past 3 weeks.
Value Portfolio:
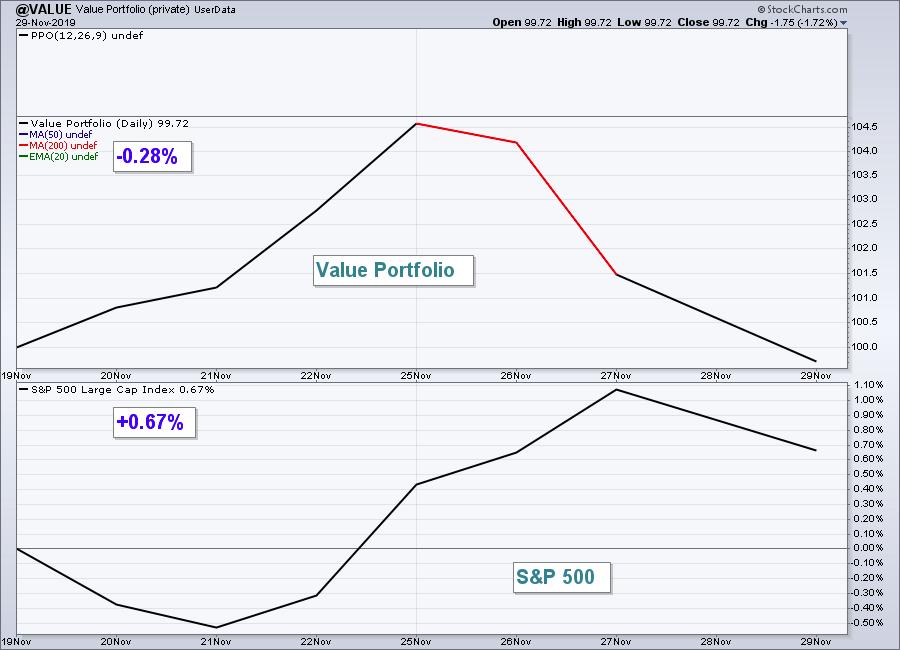
One week ago, the Value portfolio got off to a roaring start and I asked the question.....is it beginners luck? Well, apparently it was as the Value portfolio underperformed badly last week, dropping 0.28%. On the surface, that might not seem too bad, but the Value portfolio fell from a value of 104.19 at Tuesday's close to 99.72 by Friday's close. Here is the inception-to-date chart:
Here are how the Value portfolio component stocks performed last week:
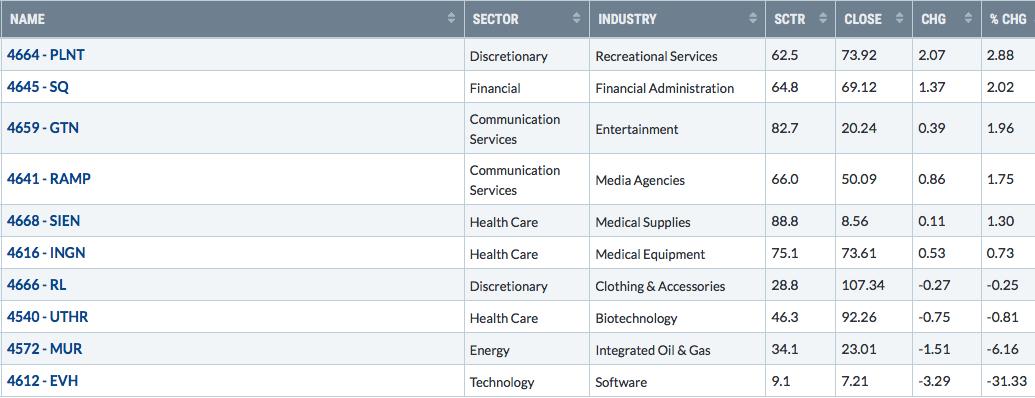
MUR followed the energy stocks (XLE) and the price of oil ($WTIC) lower last week, but the big story was EVH. It had gained more than 10% from November 19th until it was announced on Wednesday that its partner, Passport Health Plan, received notification from the Kentucky Cabinet for Health and Family Services that it was not awarded a Kentucky managed care contract. EVH announced earlier in 2019 that it would acquire a 70% interest in Passport Health Plan. That deal is anticipated to close by end of year. Passport has said it will appeal Kentucky's decision, but last week Wall Street spoke and didn't care for any of this:
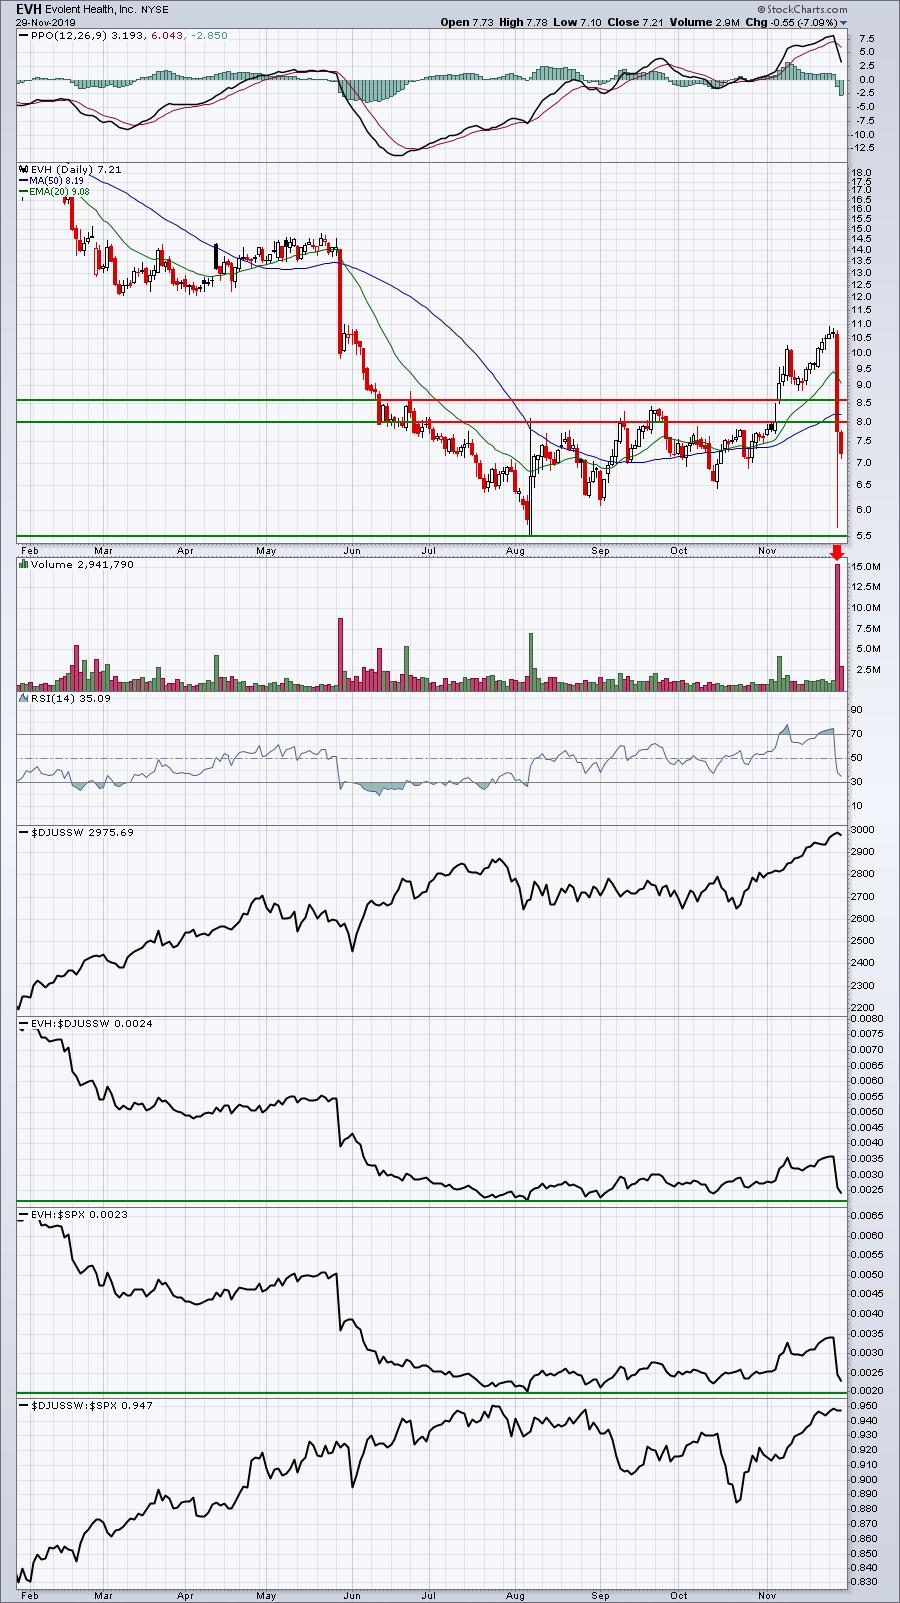
Two key gap support levels were lost on massive distribution (volume) during last week's selling and, barring an unforeseen announcement this week, I'd expect further volatile action with a downside bias. The 5.50-5.75 area is now the most important price support on the chart.
Summary
Overall, it was a pretty solid week for the portfolios. It likely helped that growth stocks (IWF) outperformed value stocks (IWD) as that ratio (IWF:IWD) moved to its highest level in more than 10 weeks. Seasonally, we still have much to look forward to as December tends to be a very strong month. One seasonal stat worth considering is that small caps ($SML) have a tendency to outperform their larger cap counterparts ($SPX) as you can see from the following seasonality chart:
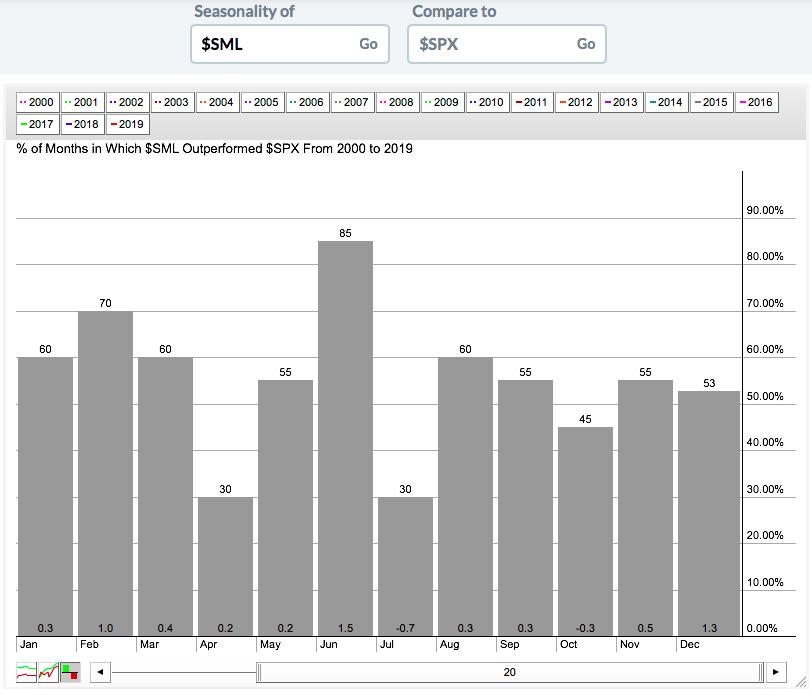
Over the past two decades, June and December have been excellent months for small cap stocks relative to large cap stocks, with the S&P 600 Small Cap Index outperforming the S&P 500 by an average of 1.3% in December. Also, from my own historical research, I can tell you that the Russell 2000 ($RUT) has moved higher during December 26 of the last 32 years, a very strong percentage. But I also must tell you that the RUT has lost ground during December in 3 of the last 4 years.
Still, I like that longer-term trend and, based on what I'm seeing on the chart, I believe we're going to see a strong December in small caps, which would likely be very good news for the Aggressive portfolio, home to 5 small caps and 4 mid caps. The Value portfolio has the reverse - 5 mid caps and 4 small caps.
Happy trading!
Tom Bowley, Chief Market Strategist
EarningsBeats.com
"Better timing. Better trades."