
EB Weekly Portfolio Report - Sunday, December 22, 2019
Portfolio Rules and Objectives
Here are the common traits and objectives of each portfolio:
- There are 10 leading stocks from 10 leading industries in each portfolio (at the time of selection)
- They are held for an entire 90 day period, with no stops in place
- Every stock will be held through ONE earnings report
- The expectation is that relative winners will carry the portfolio to outperformance
- They are all entered into as of February 19, May 19, August 19, and November 19 (these dates are used as we are generally past the majority of earnings reports by these dates)
- Primary objective is to outperform the benchmark S&P 500
Here are several considerations for EB members:
- I would expect the Aggressive portfolio to be the riskiest, followed by the Model portfolio, and then the Income portfolio
- The Value portfolio is a new breed and is much different from the others; it's quite diversified, but how it ranks in volatility among the four remains to be seen - I would anticipate high volatility
- The Income portfolio stocks will all pay dividends, with the expected average dividend yield to be at least 1.5%
- Drawdowns (losses) should be much milder on the Income portfolio, with more volatility expected on the other three
- You should own or trade these stocks in whatever manner is most comfortable for you; while we buy all 10 stocks as of the dates identified above, feel free to trade certain stocks or wait for pullbacks if the stocks are overbought
- We have no idea what risk each member is willing or able to take. We are not registered investment advisors so be sure you understand the risk you take.
- EarningsBeats.com shareholders/employees may own all or some of the portfolio stocks from time to time.
Snapshot
Here's a weekly recap:
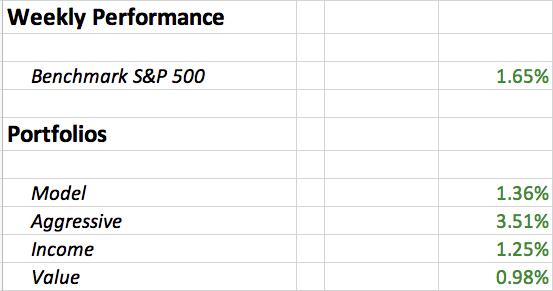
Weekly Summary
Benchmark S&P 500:
The S&P 500 did what it does during the latter half of Decembers. It moved up. The S&P 500 rose on 4 of 5 days last week, gaining 1.65% cumulatively. The leadership last week was strange, however, as communication services (XLC) broke out to lead the market higher. The most unusual part was clearly the bottom of the sector leaderboard, though. Check it out:
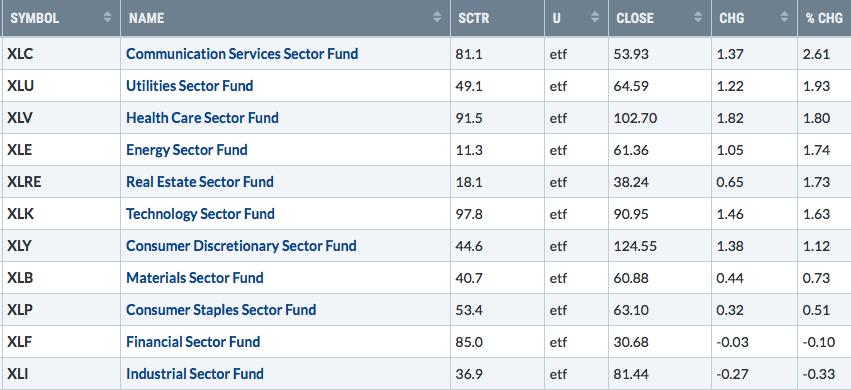
Industrials (XLI) and financials (XLF) did not participate in last week's rally. The really strange part, especially for the financials, was that the 10 year treasury yield ($TNX) rose 10 basis points last week from 1.82% to 1.92%. That's normally the ticket to higher prices among financials. 40% of the XLF is comprised of Berkshire Hathaway (BRK.B), JP Morgan (JPM), Bank of America (BAC), and Well Fargo (WFC), all of which underperformed the S&P 500 last week.
One lesson here is to understand what you own. Just because you own a major sector ETF, that does not mean you have significant diversification. Thus, you're subject to the performance of those companies that highly influence the ETF.
Model Portfolio:
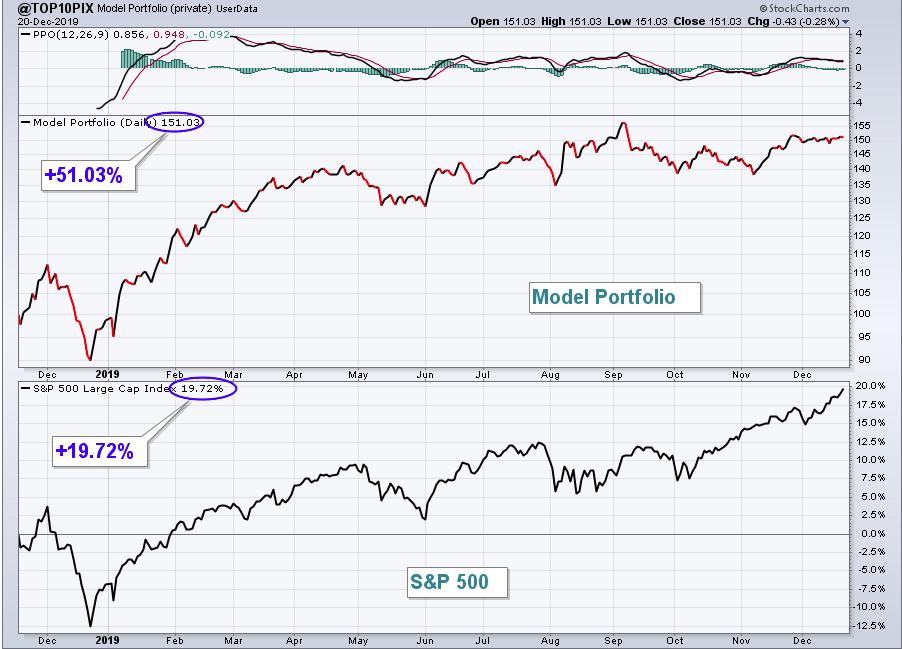
The Model portfolio gained ground last week, rising 1.36%. It was either a glass half empty or half full type of week, depending on how you viewed it. Carmax, Inc. (KMX) was the first of our portfolio stocks to report its quarterly earnings report and it did so on Friday morning. They fell short of their EPS estimate and dropped 6% on Friday as a result. Here's the updated inception-to-date chart of the portfolio:
Here are how the Model portfolio component stocks performed last week:
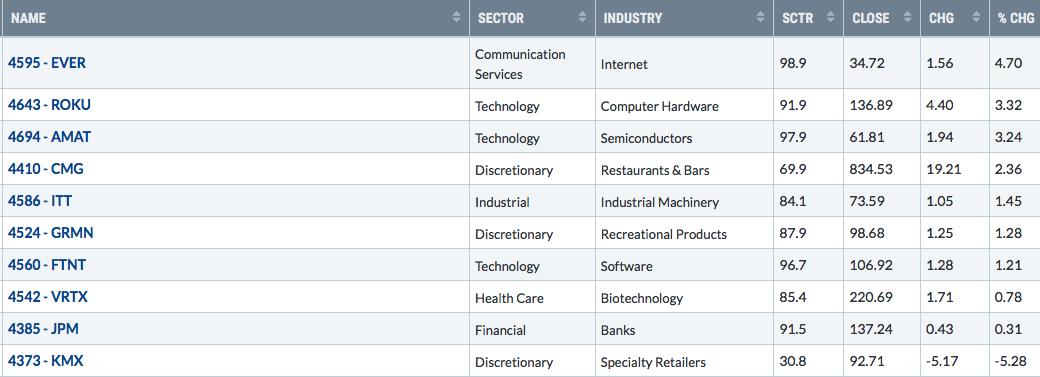
EVER and ROKU have been consistently volatile and that trend continued last week. Both were strong overall and helped the Model portfolio perform well. In fact, looking at the component stocks last week, it was shaping up to be an excellent week for the group before the KMX miss. That's the glass half full or half empty argument.
So what do we do with KMX, knowing that it's missed its EPS and we still have 2 more months before the portfolios see changes? We've never adjusted portfolios mid-stream, but I'm making a change this time. If KMX closes below 90.00 to the downside or tests its 20 day EMA to the upside, it will be removed and that position will simply move to cash. There's a reasonable chance that it will be replaced, but I'll discuss that more when the time comes. For now, just be aware of the selling strategy that's now in place. Here's a current look at the chart and why I feel compelled to sell KMX:
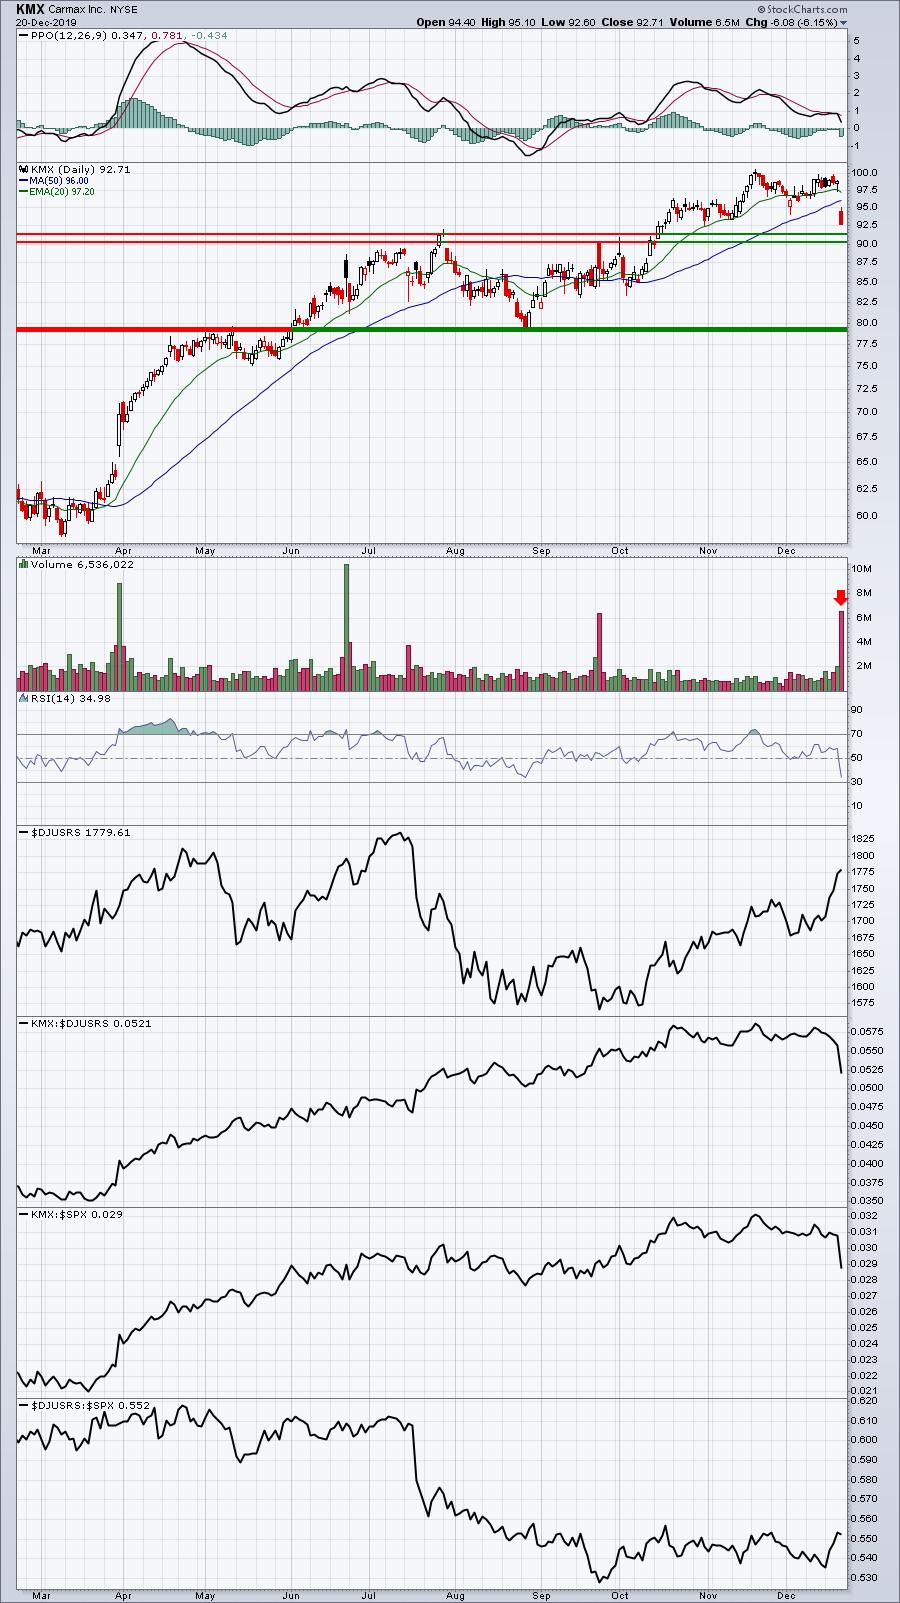
There should be price support in the 90-91 area, but we can't ignore the heavy volume selling with KMX finishing on its low on Friday. That resulted in a red-filled candle as sellers were completely in control of Friday's action. We want to limit the effect of any further damage on KMX. We know anything can happen in the stock market, but if KMX loses 90 support, I believe the odds increase significantly of a major test of support just below 80.
Aggressive Portfolio:
The Aggressive portfolio had one of its best weeks of 2019 and surged 3.51% on the week. The most encouraging part of the performance here is that both small caps and mid caps continue to struggle on a relative basis vs. the benchmark S&P 500. Yet the Aggressive portfolio consists of 5 small caps, 4 mid caps, and just 1 large cap. Here's the Aggressive portfolio chart since its inception on May 19, 2019:
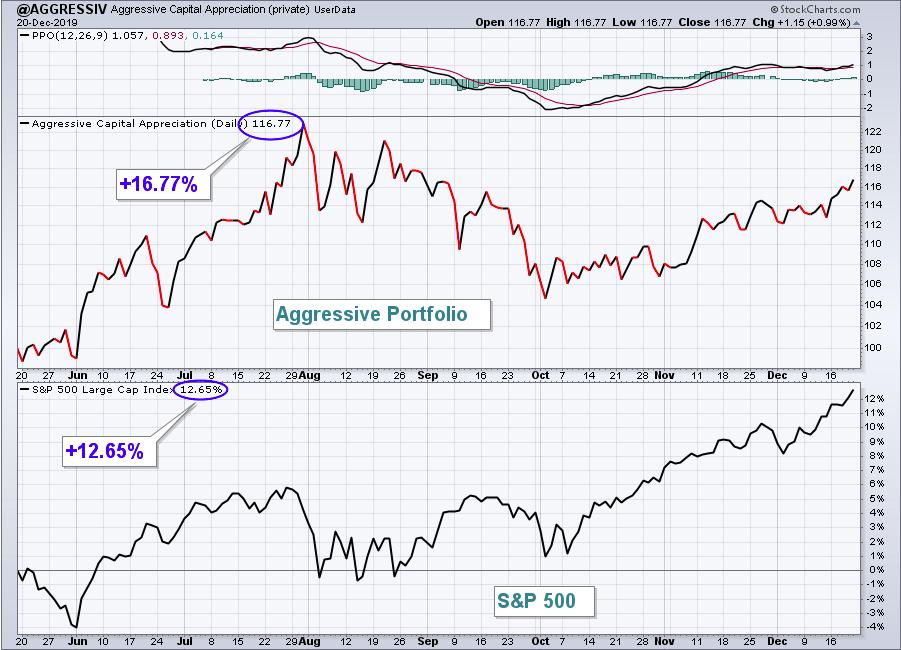
Since the beginning of October, the Aggressive portfolio has held its own against the S&P 500, despite relative weakness in smaller shares. Should small and mid caps begin to outperform, I'd be very bullish this portfolio, but that relative strength remains to be seen.
Here are how the Aggressive portfolio component stocks performed last week:
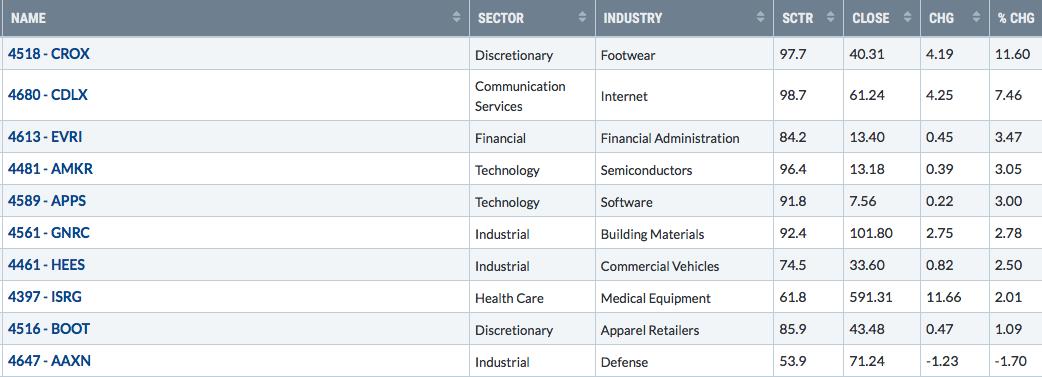
The big winner last week was CROX. In Monday's DMR, I highlighted CROX at 37.86 just as it was breaking above neckline resistance in a bullish inverse head & shoulders pattern and suggested an initial measurement to 41. By Friday, CROX had neared that measurement, hitting an intraday high of 40.85. Patterns work.
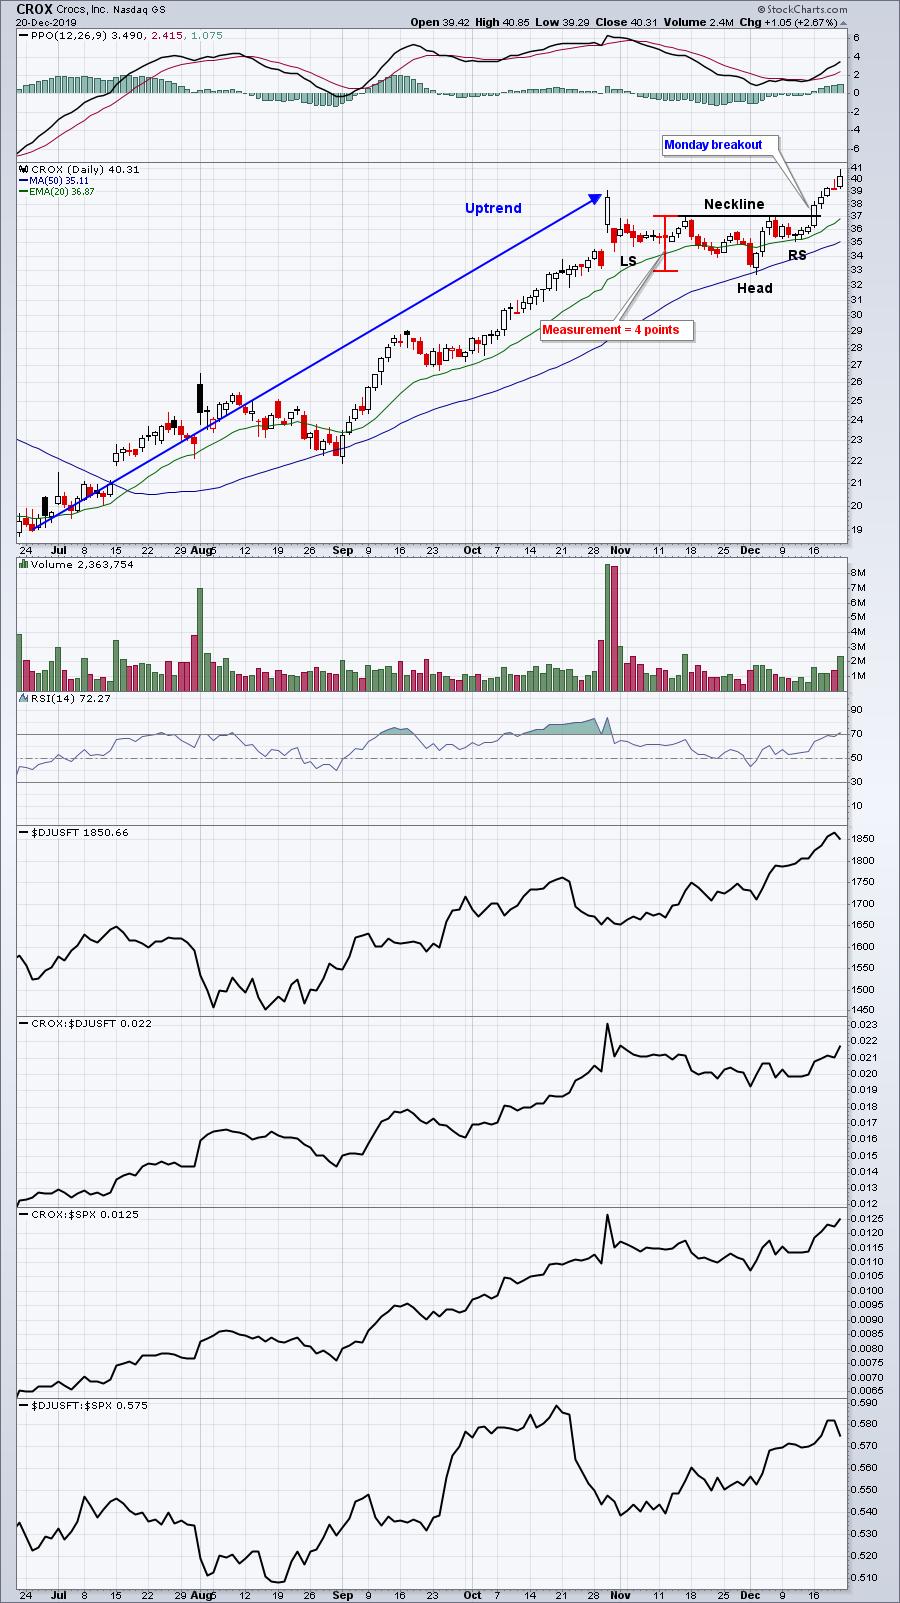
Add roughly 4 points to the 37 breakout level and you get the 41 measurement. I suspect we'll see CROX moving higher, but profit taking is in order at any time.
Income Portfolio:
The Income portfolio gained 1.25% last week, trailing slightly S&P 500's return. Here's a look at the inception-to-date chart:
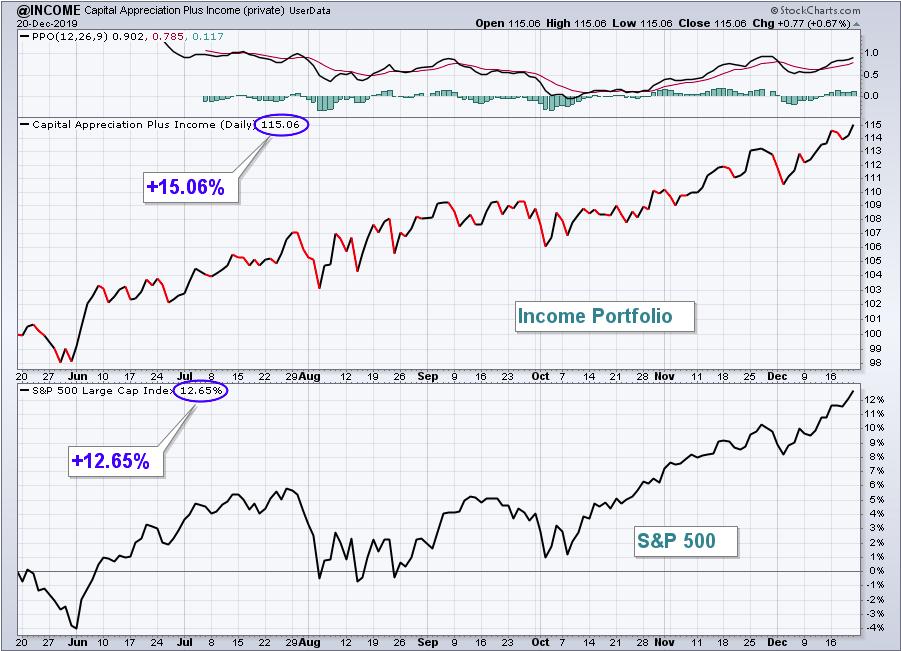
Here are how the Income portfolio component stocks performed last week:
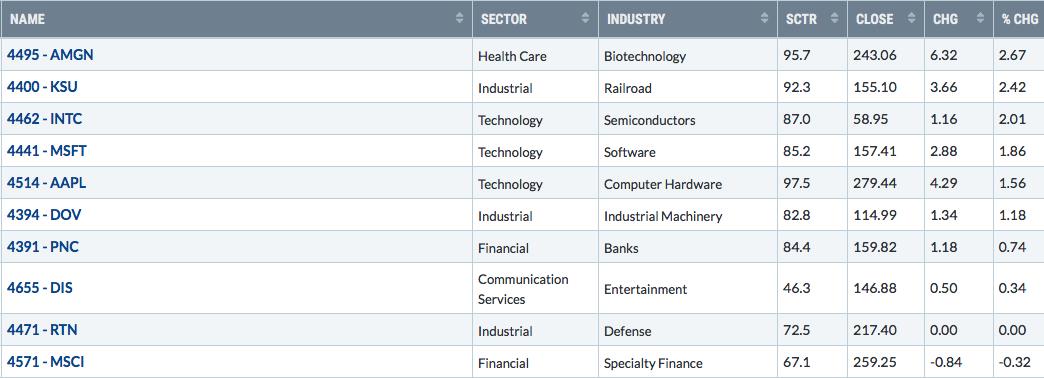
The Income portfolio was somewhat boring, which is exactly what we expect from it. The two stocks that held back the portfolio last week, RTN and MSCI, were part of the two sectors - industrials and financials - that didn't participate in last week's rally.
Value Portfolio:
The Value portfolio continues to be a wild card, trailing the S&P 500 last week, but nonetheless posting a 0.98% gain. Here is the inception-to-date chart since November 19, 2019:
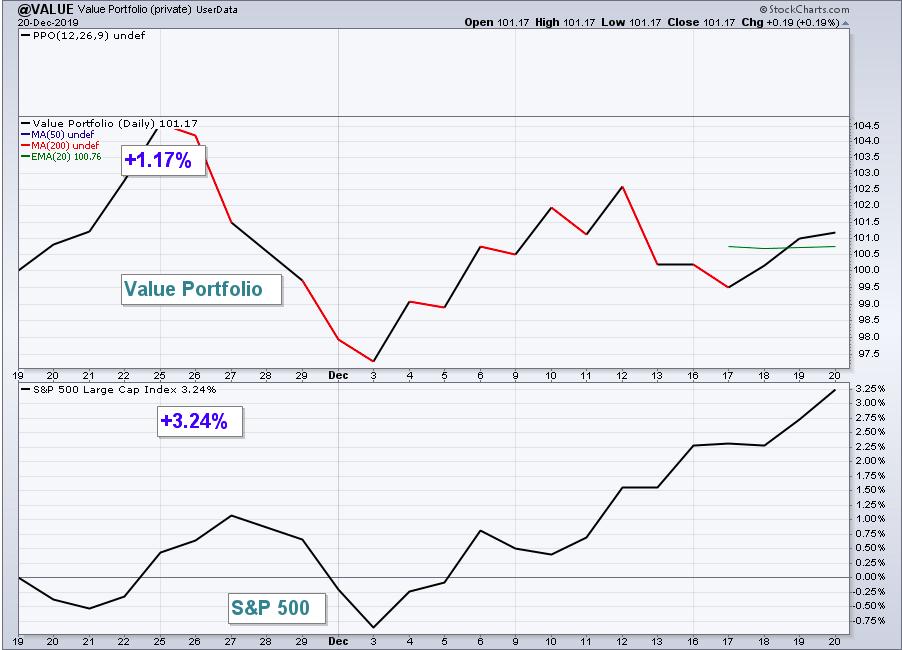
The Value portfolio has lagged the S&P 500, but it's quite volatile and I'd expect that. Remember, this is not a Value portfolio in the traditional sense. Stocks in this portfolio are selected because of technical "character changes" on their charts, as they appear to move from downtrending to uptrending charts as a result of a recent positive quarterly earnings surprise. I fully expect that we'll see big winners and big losers in this portfolio. The question will be how many continue to strengthen. In the current bull market environment, I expect this portfolio to outperform. Like the Aggressive portfolio, 9 of the 10 component stocks are either small cap (4) or mid cap (5). Should these two asset classes begin to lead, the Value portfolio would have a much better opportunity to lead.
Here are how the Value portfolio component stocks performed last week:
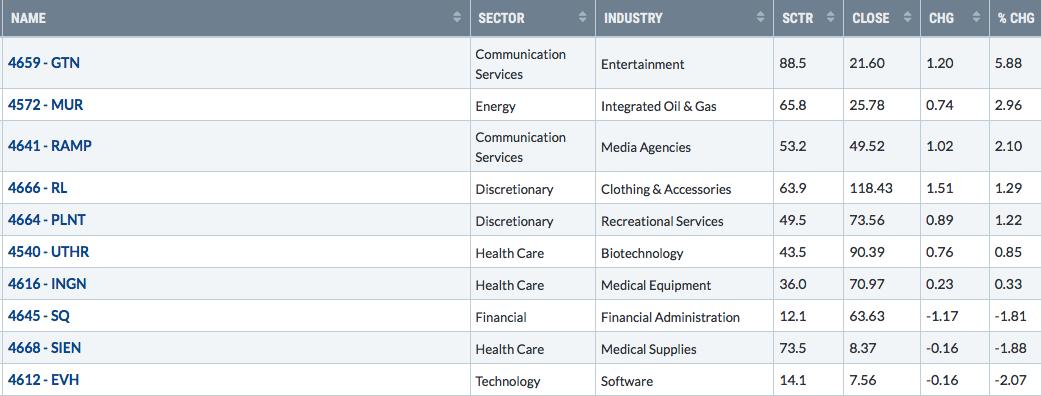
GTN was a big winner last week and has gained more than 10% since the Value portfolio stocks were announced on November 19th. The chart remains solid:
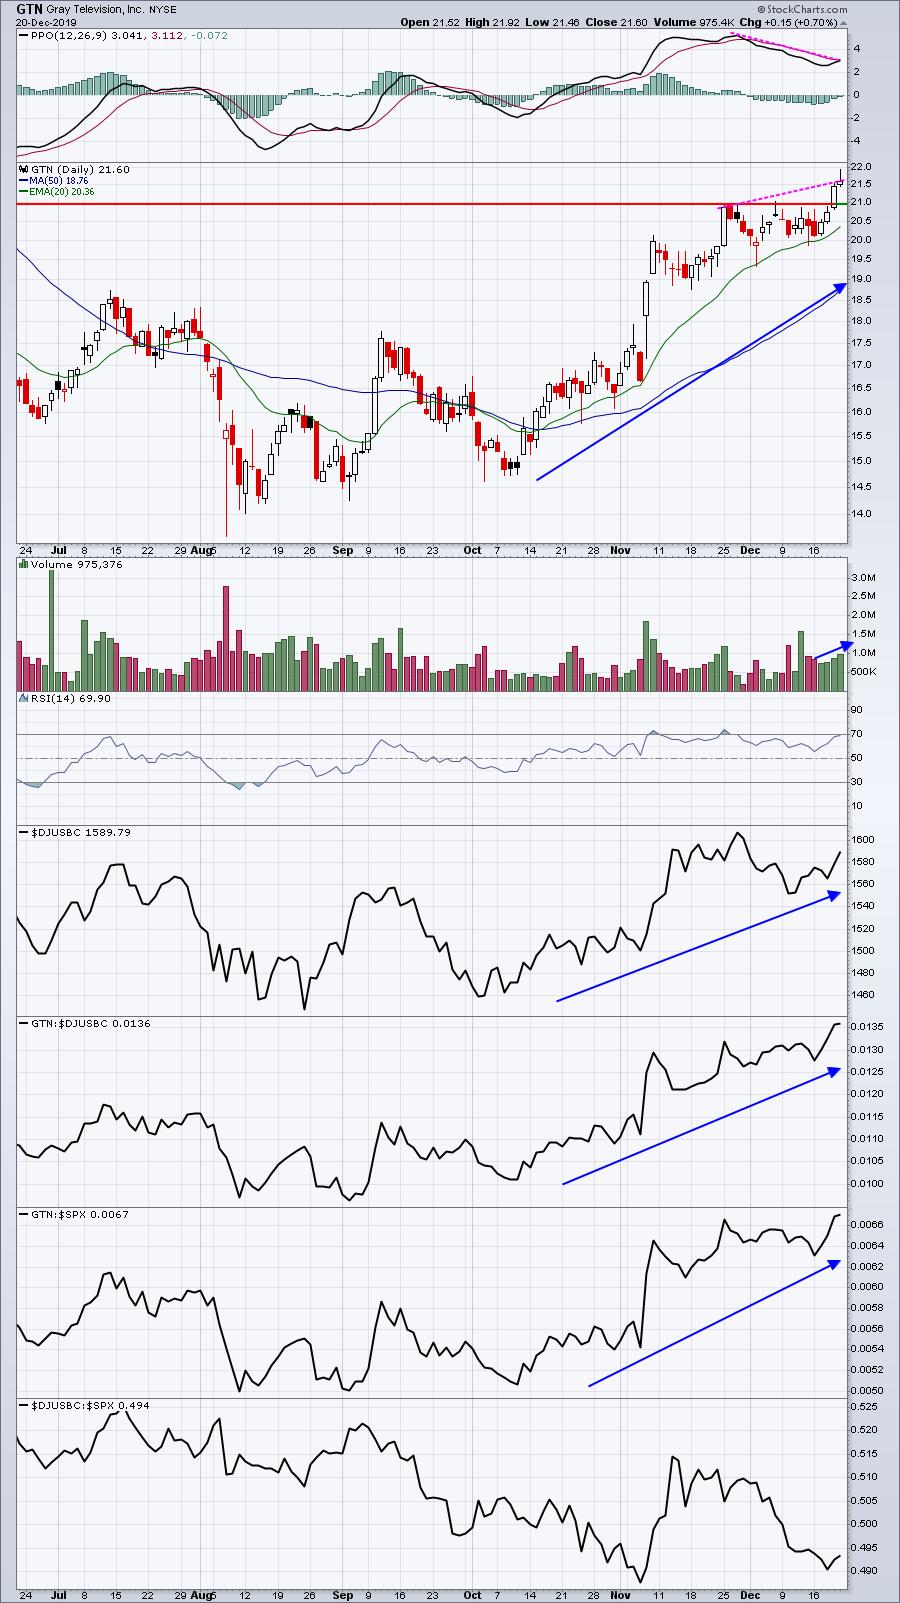
Those bearish the stock would likely point to the negative divergence (pink-dotted lines) as price continues to rise with a falling PPO. I don't buy into that primarily because the volume on last week's advance was strong and climbing throughout the week. It's difficult, in my view, to make a case of slowing momentum when a stock is breaking out and rising on increasing volume.
Summary
Overall, it was a solid week for the market and the portfolios. While there was minor underperformance on a couple portfolios, the huge week enjoyed by the Aggressive portfolio more than offset it. Also, keep in mind that only 21 of the 40 stocks in our portfolios are large caps. So these portfolios, in total, are fairly diversified between sectors, industries, and asset classes, with one common ingredient - relative strength.
I'd like to extend happy holiday wishes to all of you and your families! Please be safe too!
Happy trading!
Tom Bowley, Chief Market Strategist
EarningsBeats.com
"Better timing. Better trades."