
EB Weekly Portfolio Report - Sunday, January 5, 2020
Portfolio Rules and Objectives
Here are the common traits and objectives of each portfolio:
- There are 10 leading stocks from 10 leading industries in each portfolio (at the time of selection)
- They are held for an entire 90 day period, with no stops in place
- Every stock will be held through ONE earnings report
- The expectation is that relative winners will carry the portfolio to outperformance
- They are all entered into as of February 19, May 19, August 19, and November 19 (these dates are used as we are generally past the majority of earnings reports by these dates)
- Primary objective is to outperform the benchmark S&P 500
Here are several considerations for EB members:
- I would expect the Aggressive portfolio to be the riskiest, followed by the Model portfolio, and then the Income portfolio
- The Value portfolio is a new breed and is much different from the others; it's quite diversified, but how it ranks in volatility among the four remains to be seen - I would anticipate high volatility
- The Income portfolio stocks will all pay dividends, with the expected average dividend yield to be at least 1.5%
- Drawdowns (losses) should be much milder on the Income portfolio, with more volatility expected on the other three
- You should own or trade these stocks in whatever manner is most comfortable for you; while we buy all 10 stocks as of the dates identified above, feel free to trade certain stocks or wait for pullbacks if the stocks are overbought
- We have no idea what risk each member is willing or able to take. We are not registered investment advisors so be sure you understand the risk you take.
- EarningsBeats.com shareholders/employees may own all or some of the portfolio stocks from time to time.
Snapshot
Here's a weekly recap:
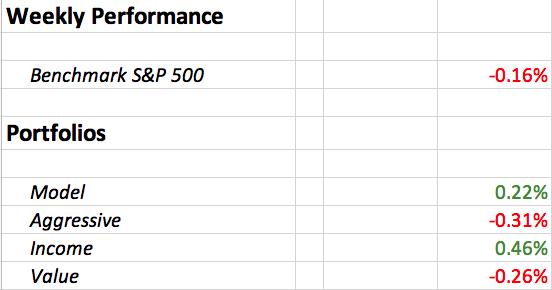
We saw mixed action on our portfolios last week, but overall not bad. Both the Model and Income portfolios widened their relative performance leads since inception over the benchmark S&P 500.
Weekly Summary
Benchmark S&P 500:
The S&P 500 had a fairly flat holiday week, dropping 0.16%. Small caps ($SML) did manage to gain ground against this benchmark as it added 0.20% for the week. However, mid caps ($MID) fell 0.35% and continue to significantly underperform the S&P 500. Check out this relative performance chart (MID:SPX):
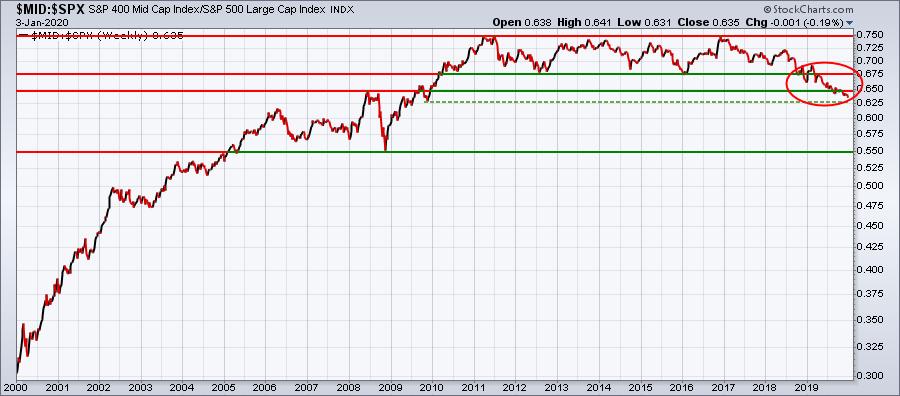
This is a 20 year weekly chart and shows that the relative performance has now reached a 10+ year low. The red circle highlights a multi-year relative breakdown. I wouldn't give up on mid caps, but the first order of business is to simply reverse this relative downtrend. We need to keep in mind that 5 mid caps are included in our Value portfolio, while 4 are in our Aggressive portfolio. One mid-cap stock (ITT) is resident in our Model portfolio. I would certainly expect to see much better portfolio performance if we see mid caps begin to show leadership. For now, the portfolio results aren't bad considering the lack of love for this area of the stock market.
Model Portfolio:
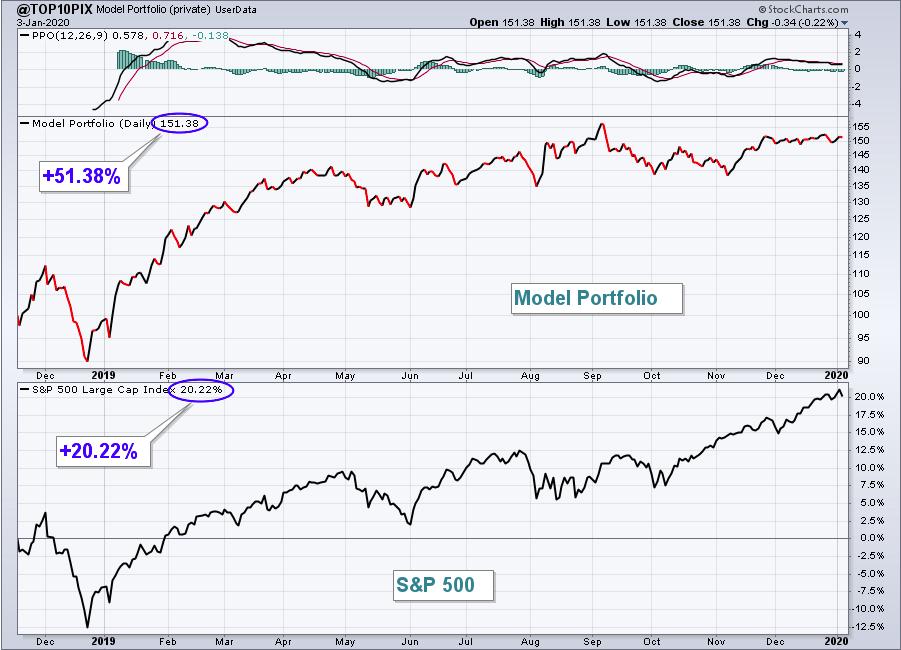
The Model portfolio gained 0.22% last week, showing a bit of outperformance. Here's the updated inception-to-date chart of the portfolio:
Here are how the Model portfolio component stocks performed last week:
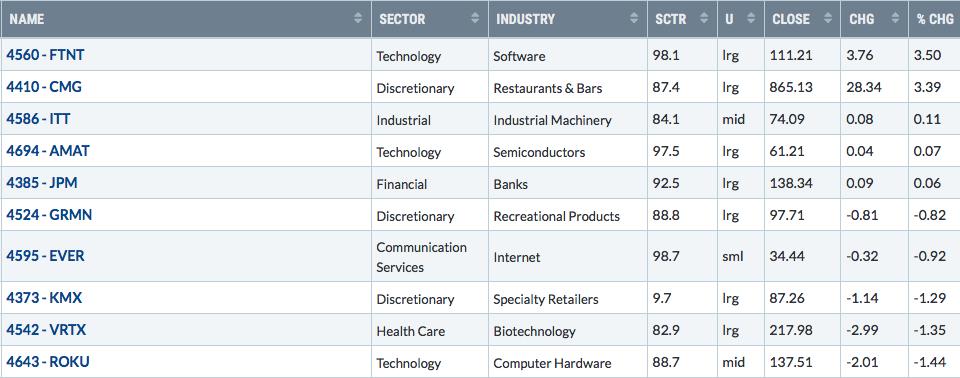
Keep in mind that KMX is no longer counted in the Model portfolio's results. It was stopped out when it closed beneath 90.00 on December 23rd. Its value will remain unchanged (in other words - in cash) every day for the balance of this quarter, unless a replacement stock is announced.
Here are two Model portfolio stocks that I want to feature today:
CMG:
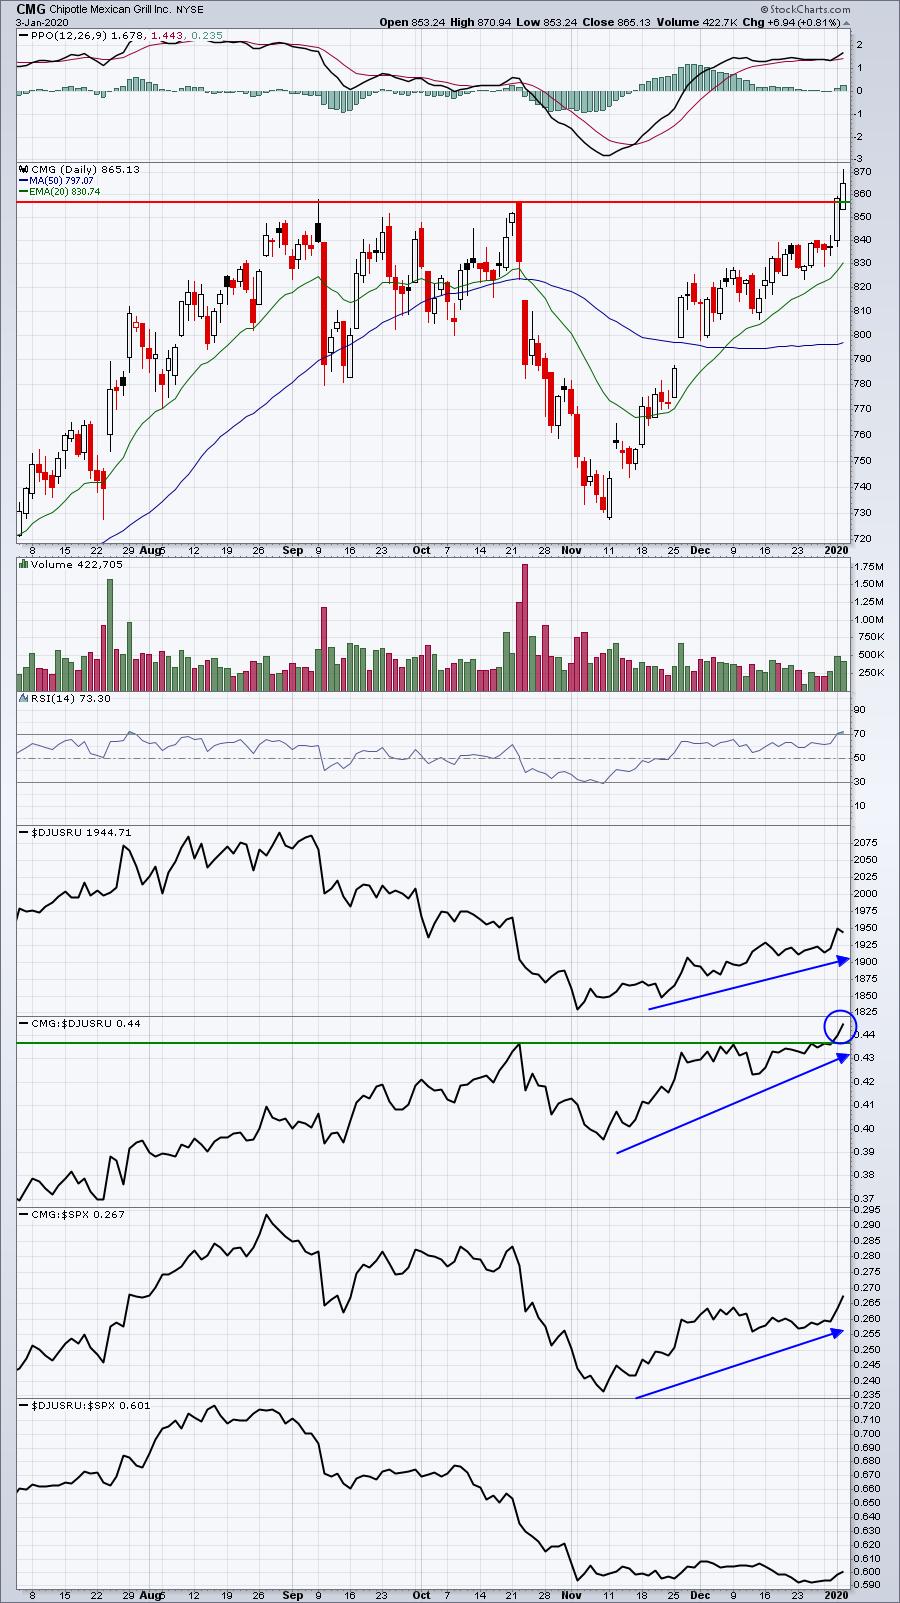
Restaurants ($DJUSRU) have begun to turn higher again, but relative strength still remains an issue. However, CMG is clearly one of the best in this group and its relative and absolute breakouts on increasing volume last week suggest that CMG remains a must own stock.
AMAT:
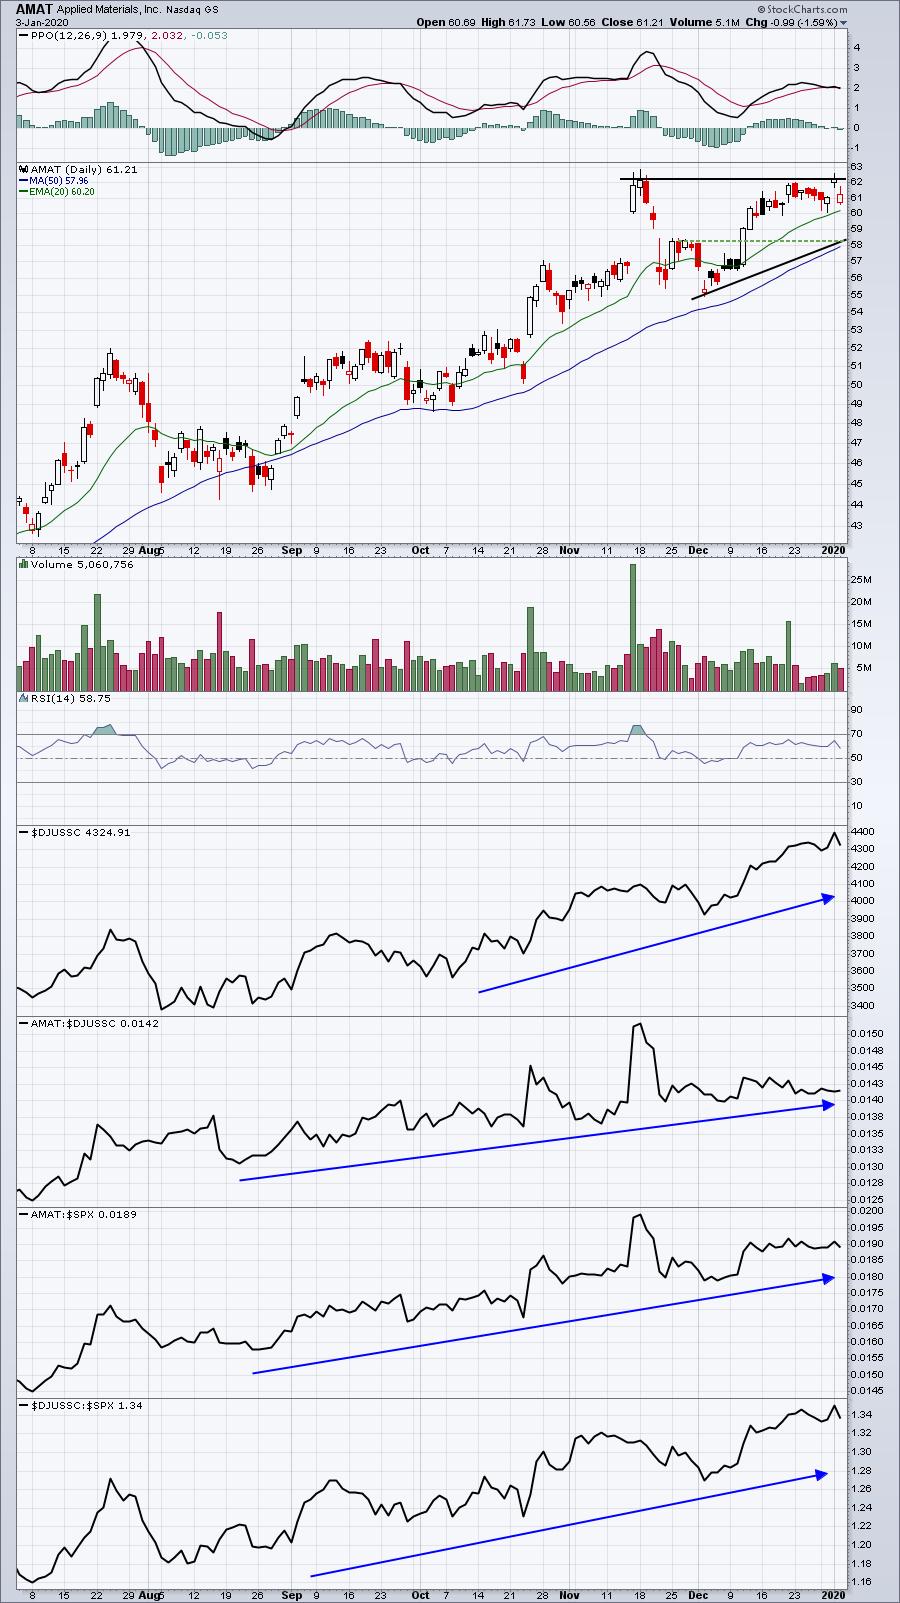
AMAT remains a solid leader in semiconductors. Currently, it's consolidating after testing its mid-November high. A trip back down to 58-59 cannot be ruled out and that would likely complete a bullish ascending triangle continuation pattern. Eventually, I see AMAT moving much higher.
Aggressive Portfolio:
The Aggressive portfolio fell 0.31% last week. Underperformance in mid cap stocks is definitely not helping here. Here's the Aggressive portfolio chart since its inception on May 19, 2019:
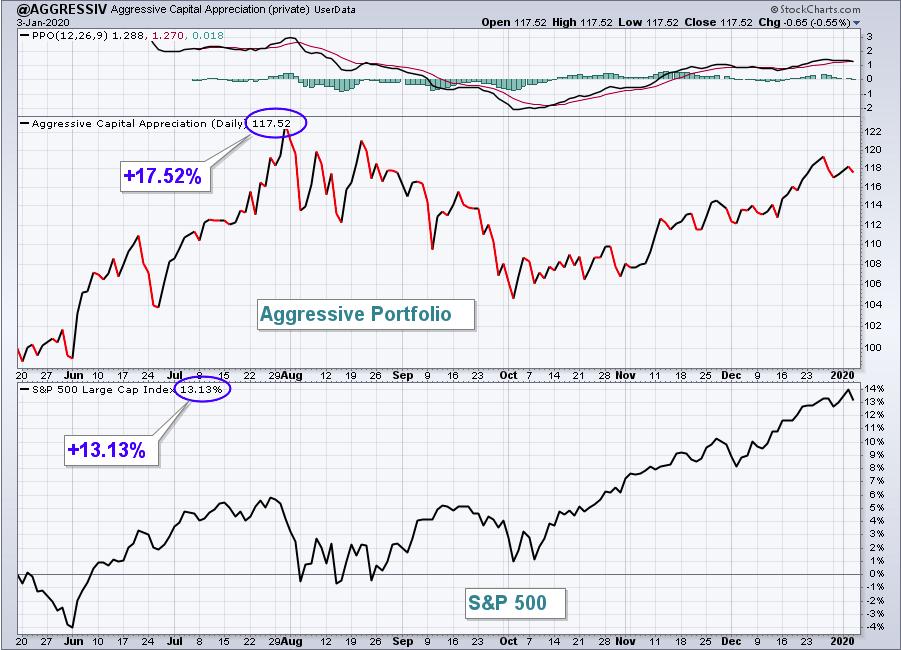
Here are how the Aggressive portfolio component stocks performed last week:
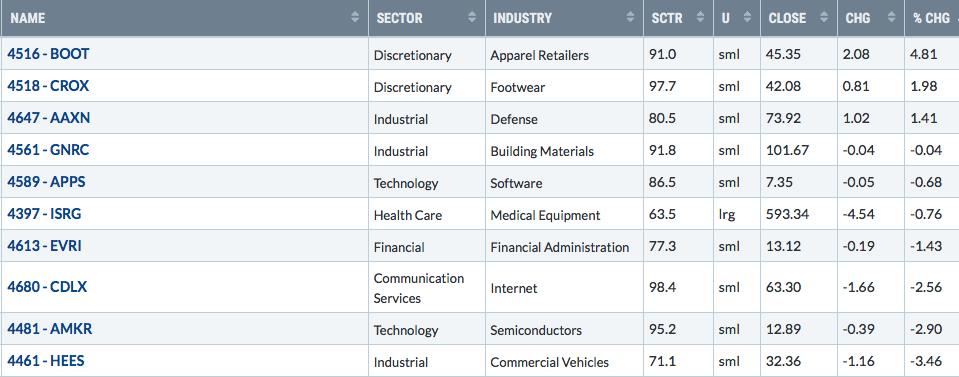
Let's take a look at technical updates for the two worst performers last week.
AMKR:
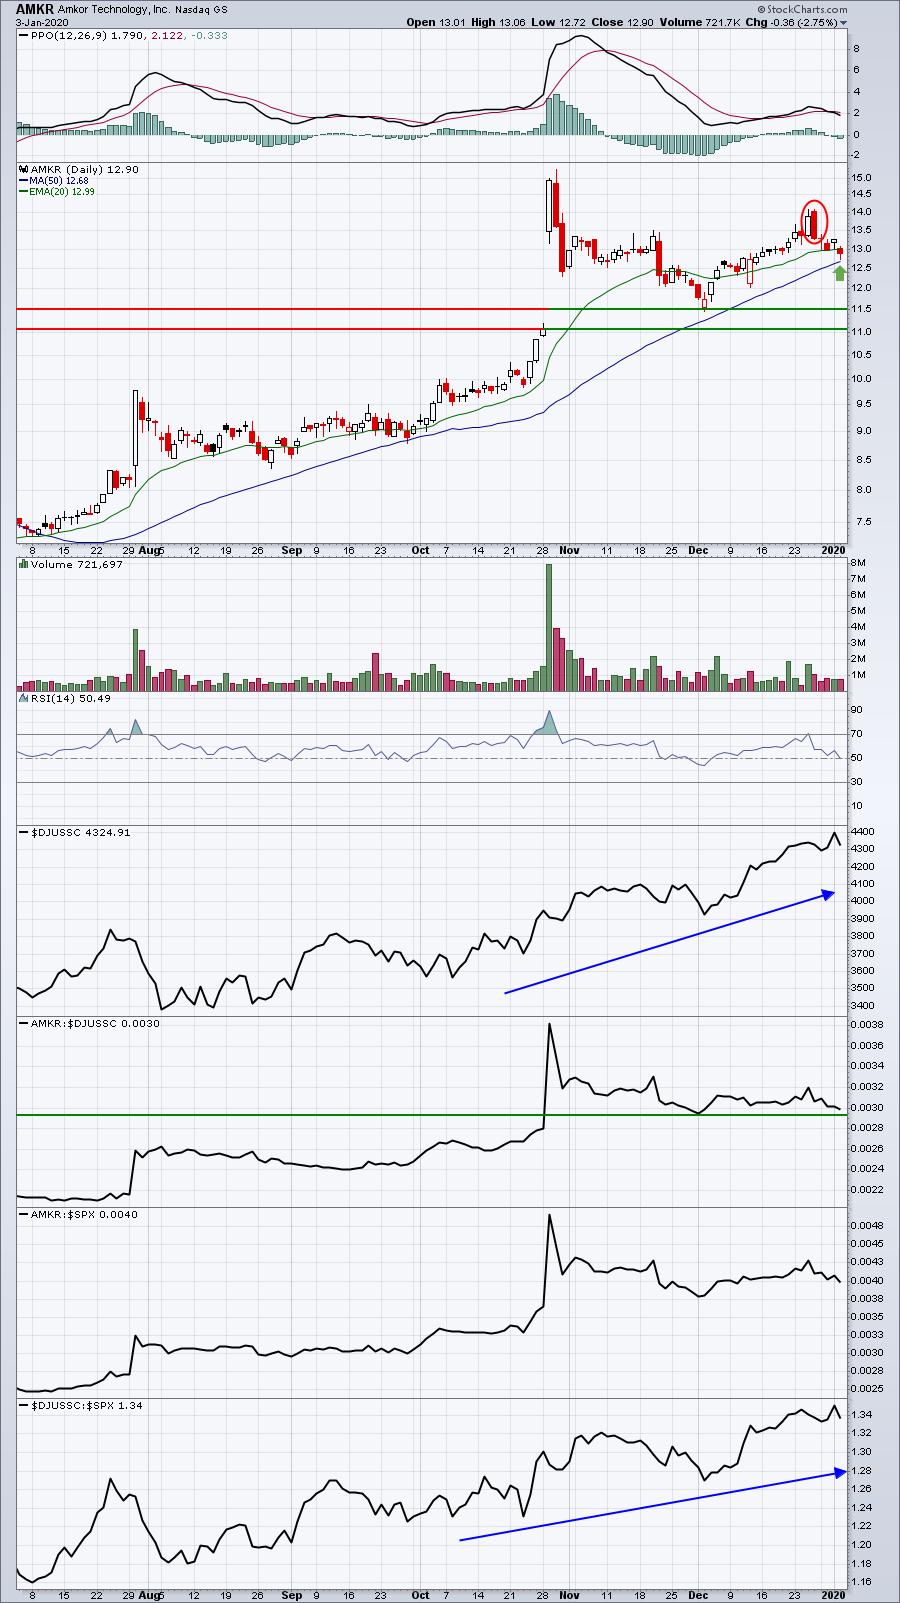
The bearish engulfing candle last Friday set AMKR up for further selling this week, so I'm not surprised. There's still plenty of downside possible to major support levels identified above. I wouldn't be surprised, however, to see AMKR bounce off of its first 50 day SMA test since its earnings report.
HEES:
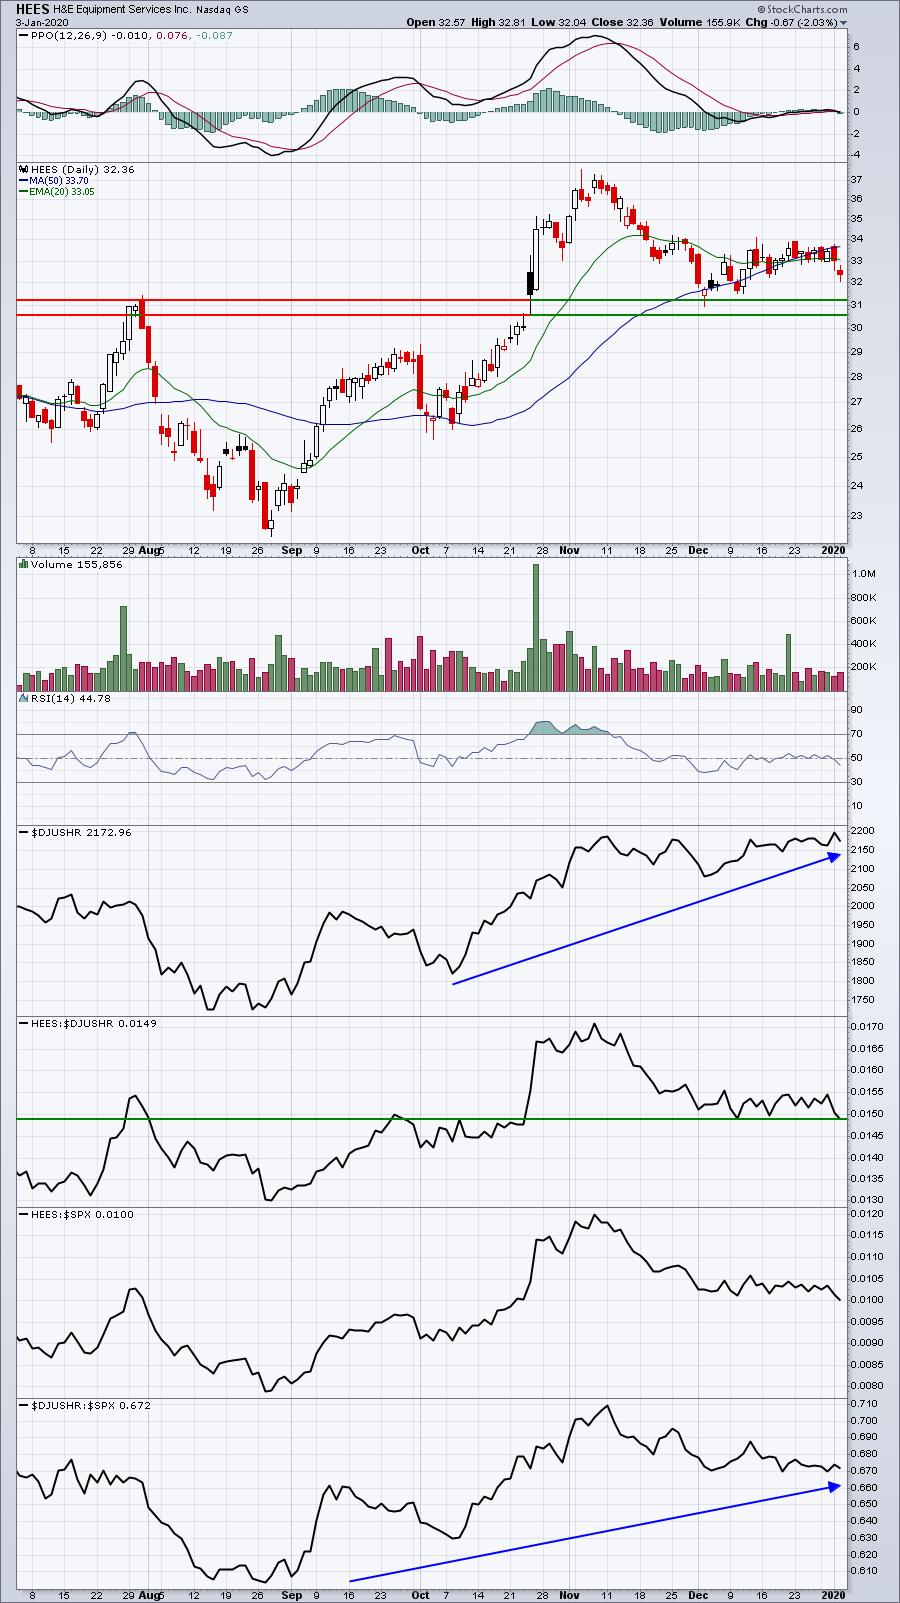
I'm not excited about the recent relative underperformance, but I'm ok with HEES for now. Let's make sure that key price support from 30.50-31.25 holds. Even the bottom of gap support just above 30.00 would be ok to use as closing support.
Income Portfolio:
The Income portfolio had a strong week, gaining 0.46%. Here's a look at the inception-to-date chart:
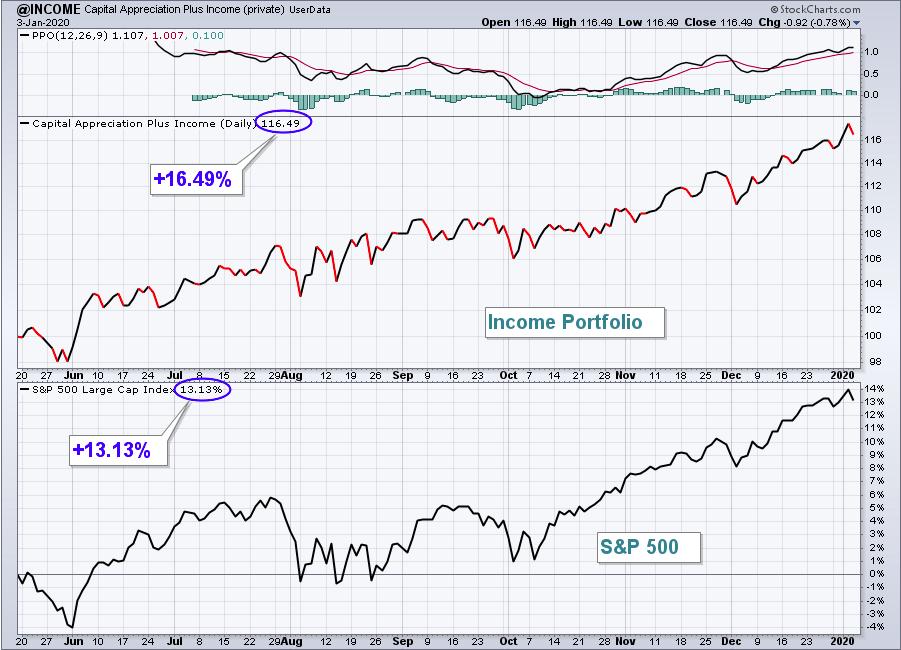
Here are how the Income portfolio component stocks performed last week:
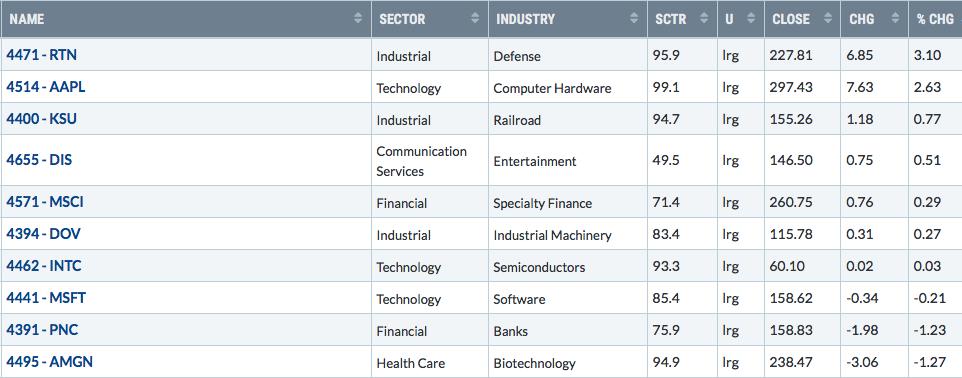
Strength in RTN and AAPL more than offset the weakness in PNC and AMGN. Here's a quick update of two of these stocks:
RTN:
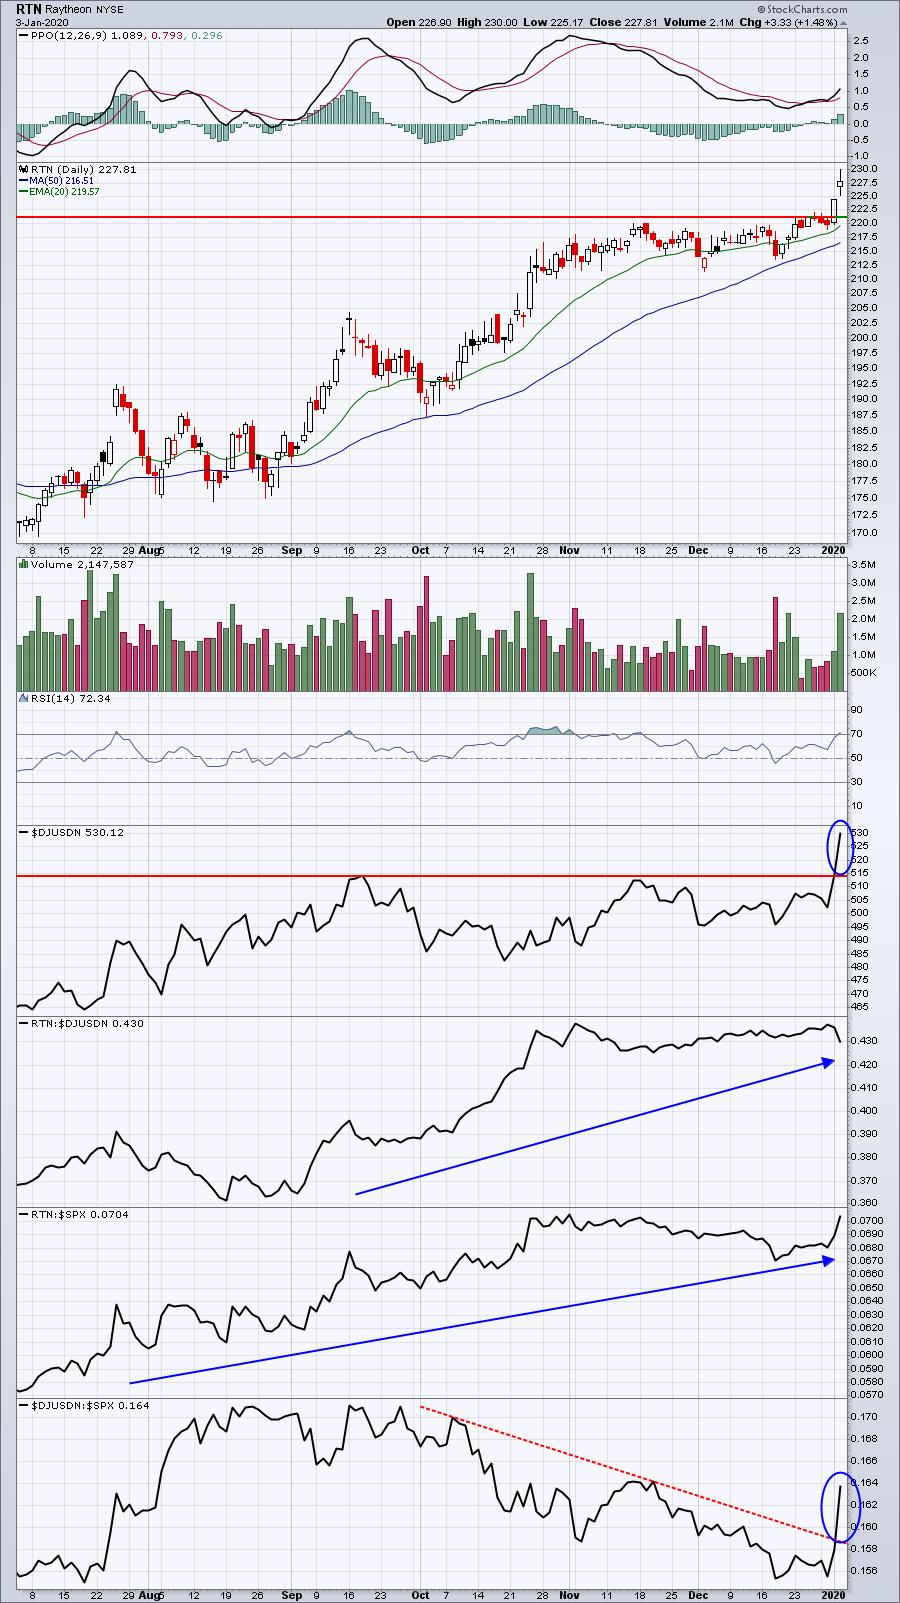
Defense stocks ($DJUSDN) were on the move higher Friday after the U.S. airstrike in Baghdad. RTN wasn't the best performer in the group, but it's technically made a significant price breakout and the PPO is turning back higher. I'd expect the prior price resistance level near 221 to hold as price support on any short-term profit taking.
PNC:
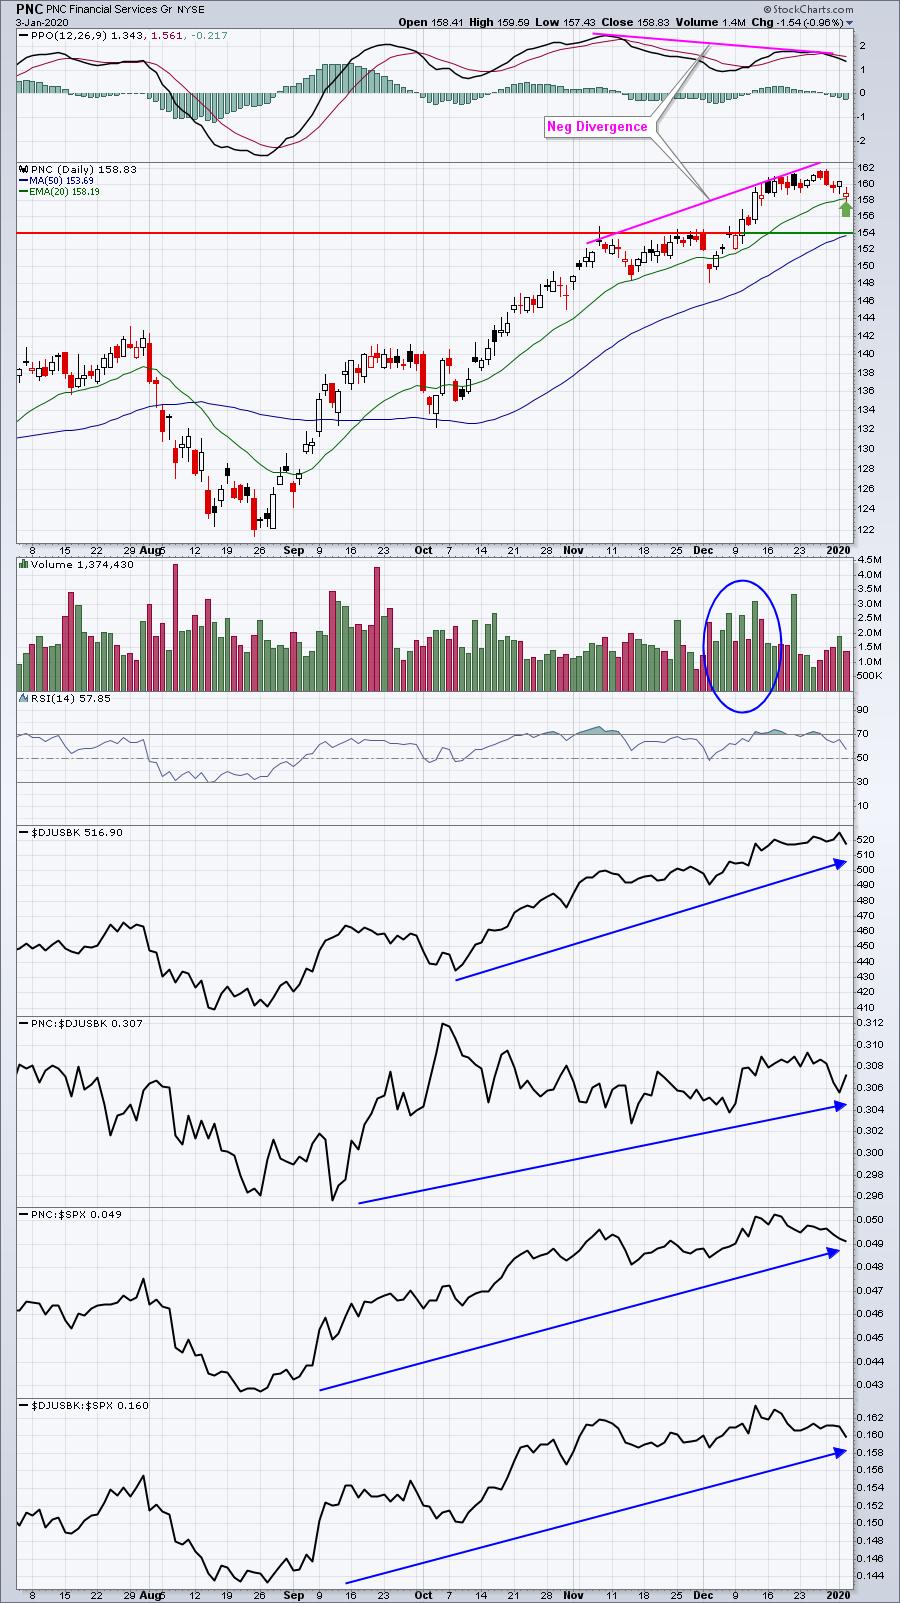
The negative divergence is a bit of a short-term concern, but the last breakout in PNC was accompanied by heavy volume. It's hard to play the slowing momentum card, which is what a negative divergence typically represents, when a stock breaks out on heavy volume.
Value Portfolio:
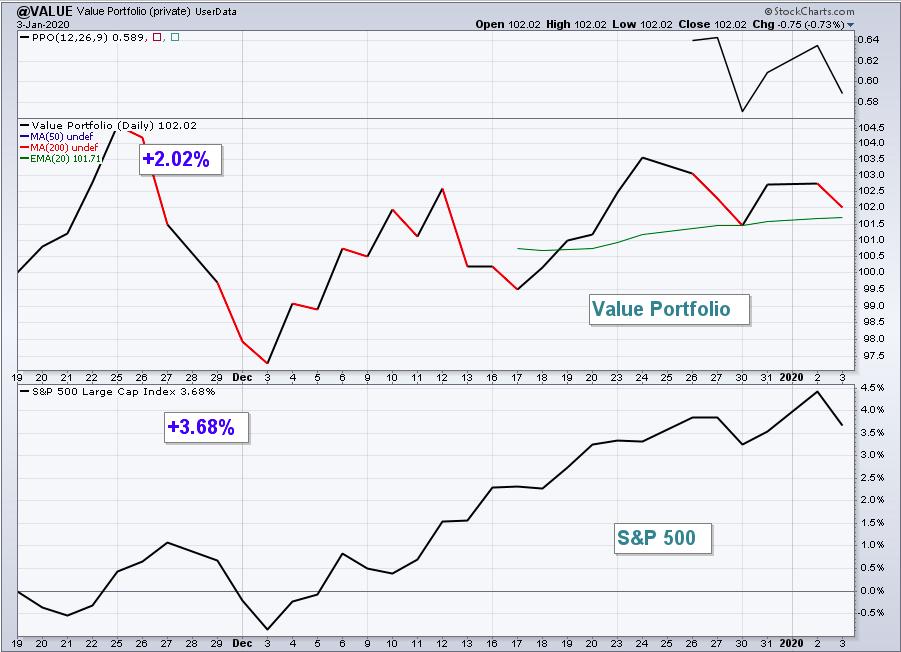
The Value portfolio lost a bit of ground last week, losing 0.26%. Here is the inception-to-date chart since November 19, 2019:
Here are how the Value portfolio component stocks performed last week:
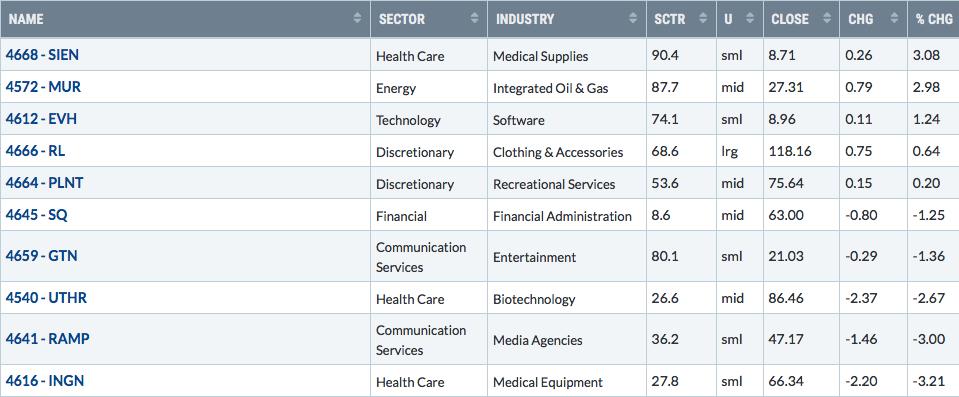
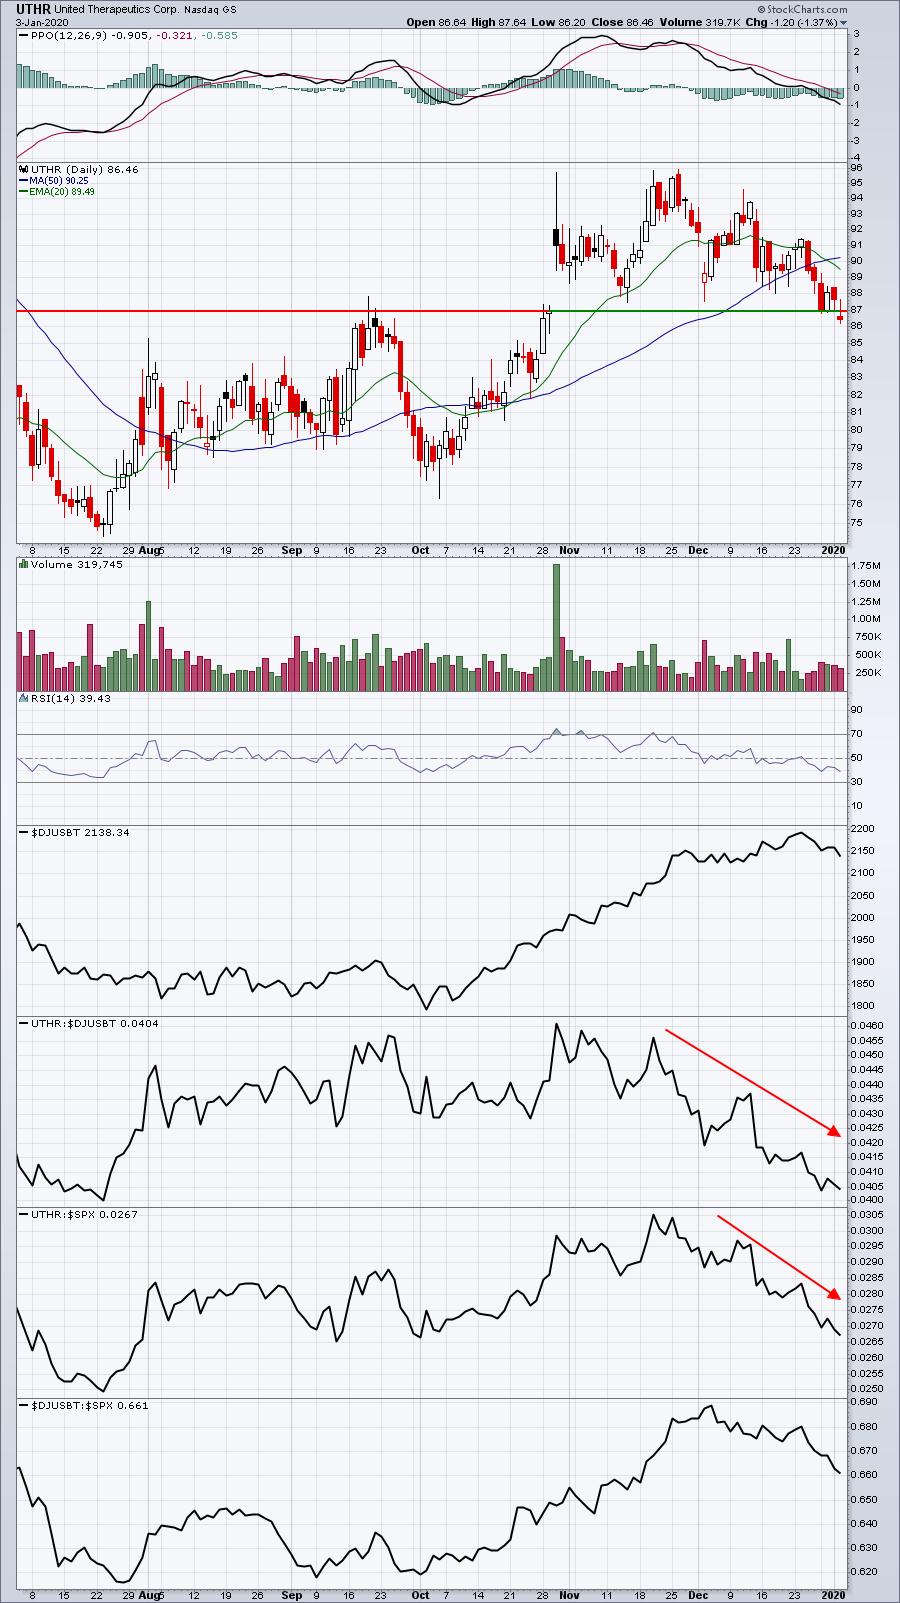
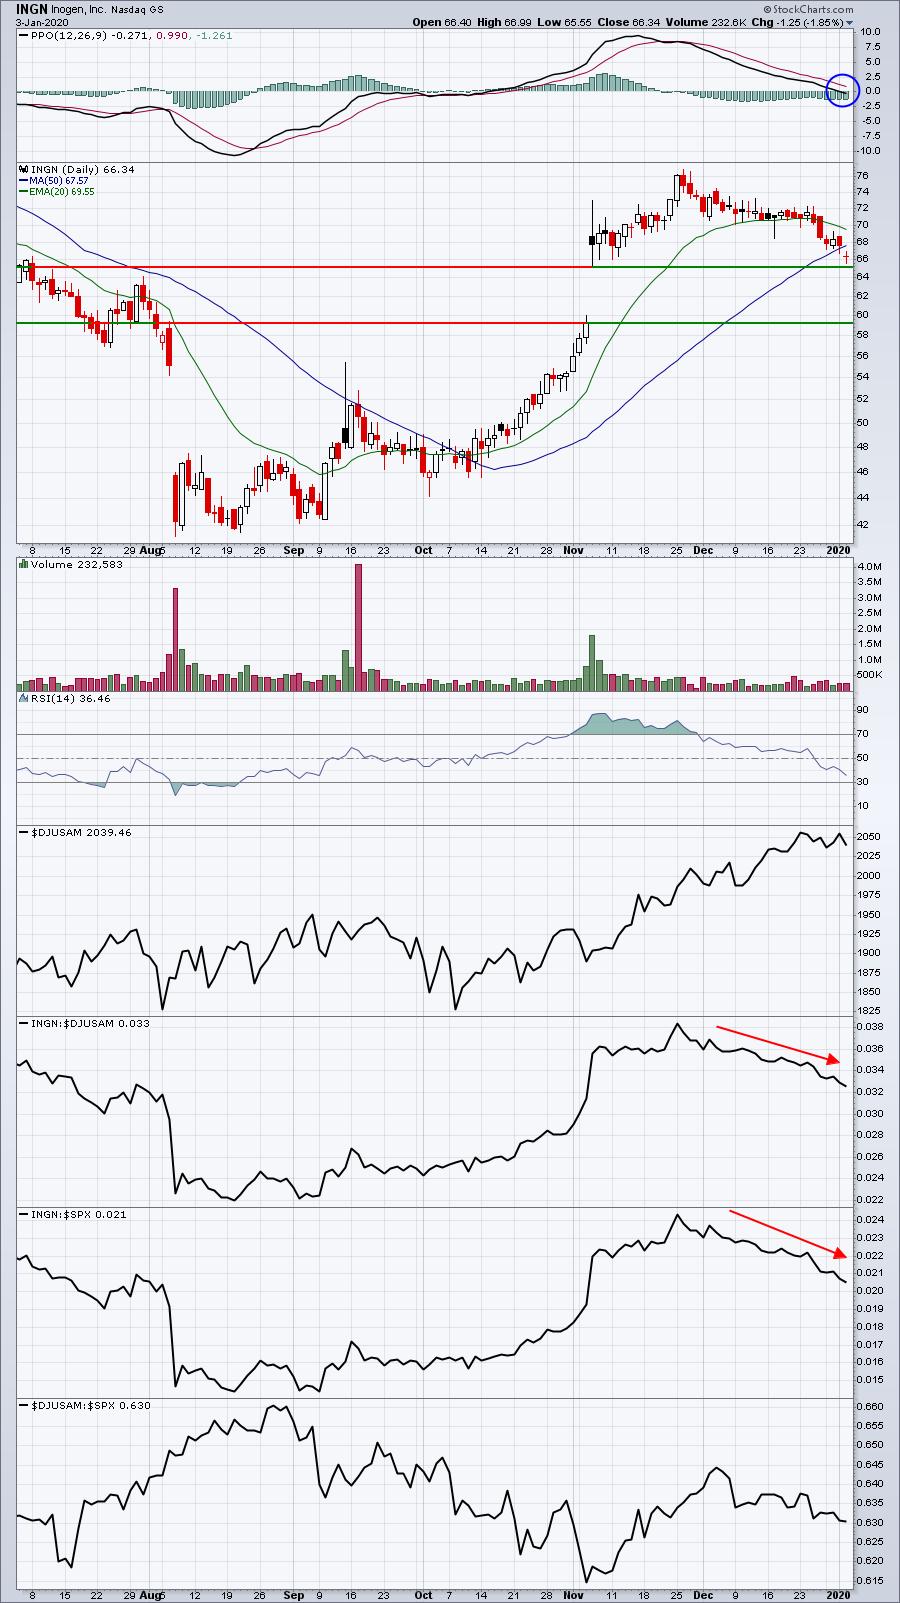
There was lots of volatility among individual component stocks, though there wasn't much on an overall portfolio level. Here are a few stocks at key levels, as annotated on their charts:
UTHR:
INGN:
SIEN:
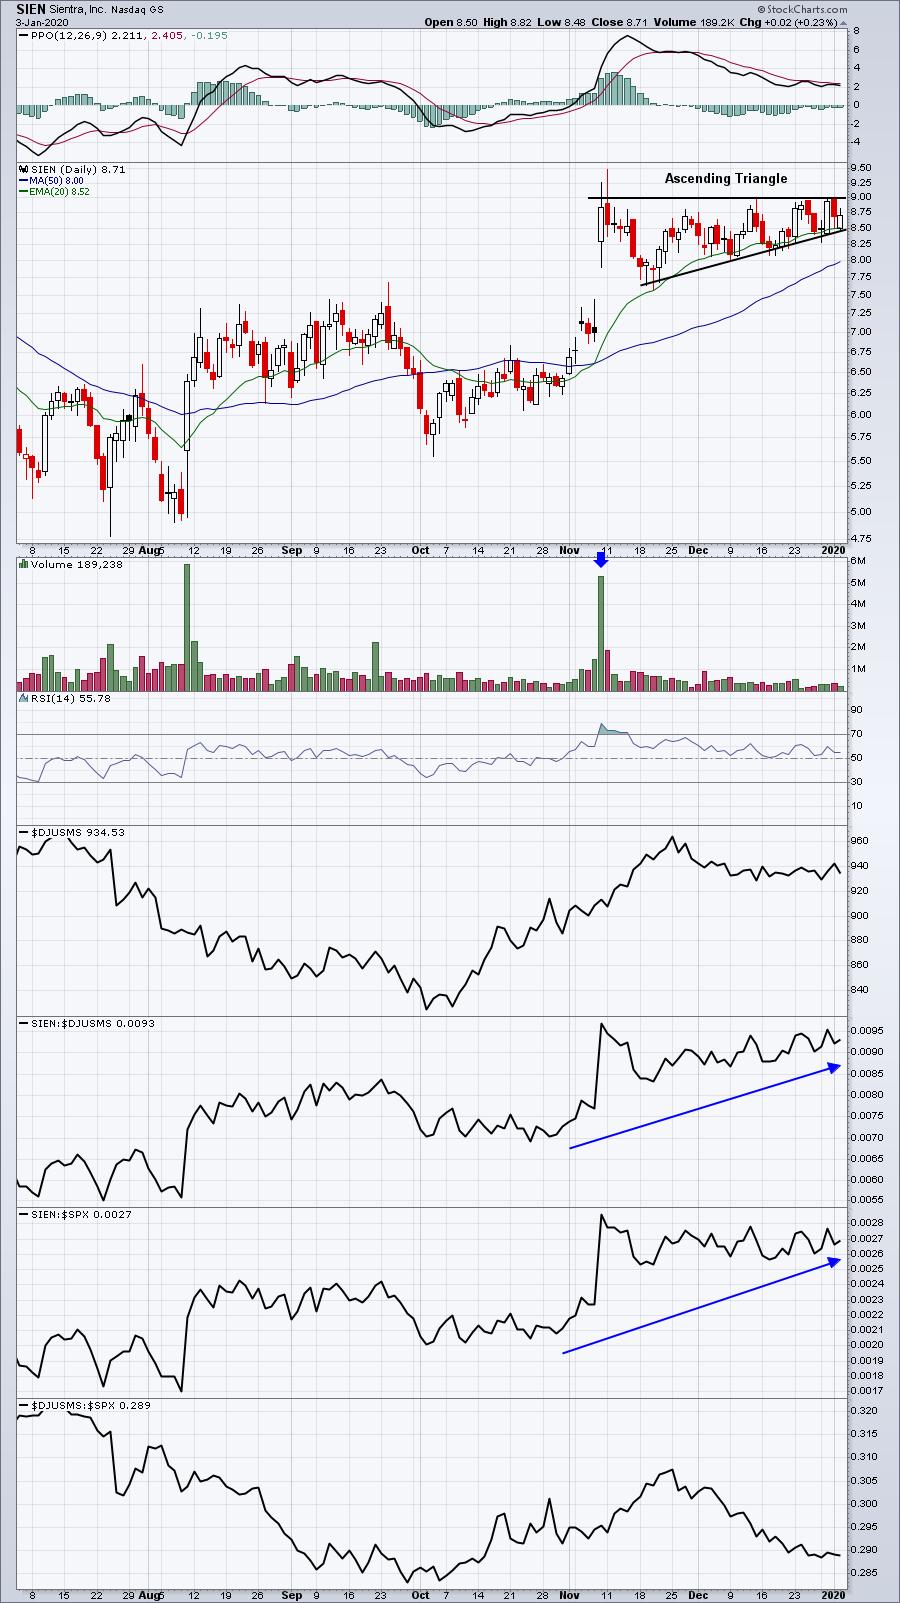
Of these three, UTHR appears to be in poor shape technically. It's broken beneath key gap support from its latest earnings report and its lost all of its relative strength from that report as well. This is the first quarter with this Value portfolio, but allowing this one to stop out wouldn't be a horrible idea. In fact, we're going to add a closing stop of 86.00 to avoid a much bigger potential loss.
INGN surged after its earnings and now it's back close to key support. While its relative strength has been drifting lower, it's still well above where it was prior to its earnings report. I look for a bounce here. Finally, SIEN looks very strong. I love the current ascending triangle pattern and SIEN's relative strength remains high among medical equipment stocks ($DJUSAM).
Summary
Last week was a pretty solid weak for our portfolios. I prefer to see all four portfolios outperform the S&P 500, but the solid outperformance of both the Model and Income portfolios turned the week into a nice one.
I hope you had a great holiday season, enjoying the company of family and friends.
HAPPY NEW YEAR!
Tom Bowley, Chief Market Strategist
EarningsBeats.com
"Better timing. Better trades."