
EB Weekly Portfolio Report - Sunday, January 12, 2020
Portfolio Rules and Objectives
Here are the common traits and objectives of each portfolio:
- There are 10 leading stocks from 10 leading industries in each portfolio (at the time of selection)
- They are held for an entire 90 day period, with generally no stops in place (KMX was an exception)
- Every stock will generally be held through ONE earnings report
- The expectation is that relative winners will carry the portfolio to outperformance
- They are all entered into as of February 19, May 19, August 19, and November 19 (these dates are used as we are generally past the majority of earnings reports by these dates)
- Primary objective is to outperform the benchmark S&P 500
Here are several considerations for EB members:
- I would expect the Aggressive portfolio to be the riskiest, followed by the Model portfolio, and then the Income portfolio
- The Value portfolio is a new breed and is much different from the others; it's quite diversified, but how it ranks in volatility among the four remains to be seen - I would anticipate high volatility
- The Income portfolio stocks will all pay dividends, with the expected average dividend yield to be at least 1.5%
- Drawdowns (losses) should be much milder on the Income portfolio, with more volatility expected on the other three
- You should own or trade these stocks in whatever manner is most comfortable for you; while we buy all 10 stocks as of the dates identified above, feel free to trade certain stocks or wait for pullbacks if the stocks are overbought
- We have no idea what risk each member is willing or able to take. We are not registered investment advisors so be sure you understand the risk you take.
- EarningsBeats.com shareholders/employees may own all or some of the portfolio stocks from time to time.
Snapshot
Here's a weekly recap:
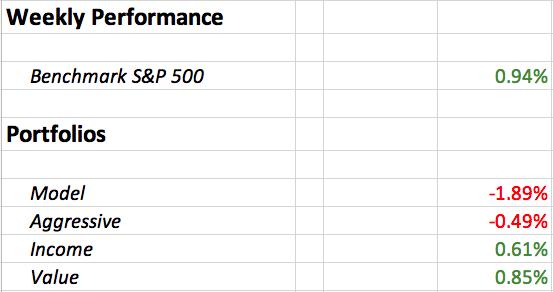
Last week was perhaps the worst week of the quarter for our portfolios. All 4 underperformed, though 2, Income and Value, did gain ground and were close to the benchmark's gain. It was a very poor week for the Model portfolio.
Weekly Summary
Benchmark S&P 500:
The S&P 500 tacked on additional gains, rising an impressive 0.94% for the week. Communication services (XLC) paced the advance, moving higher by 2.32% on the heels of a solid advance in internet stocks ($DJUSNS, +4.71%). Technology (XLK, +2.18%) was buoyed by further gains in Apple (AAPL, +4.34%). Software companies ($DJUSSW, +2.61%) performed well also. Four sectors finished in red territory, however, so it wasn't a broad-based advance. Energy (XLE, -0.98%) ended a volatile week losing ground, along with materials (XLB, -0.23%), financials (XLF, -0.20%), and industrials (XLI, -0.12%).
Model Portfolio:
The Model portfolio was under pressure last week, dropping 1.89% last week. Here's the updated inception-to-date chart of the portfolio:
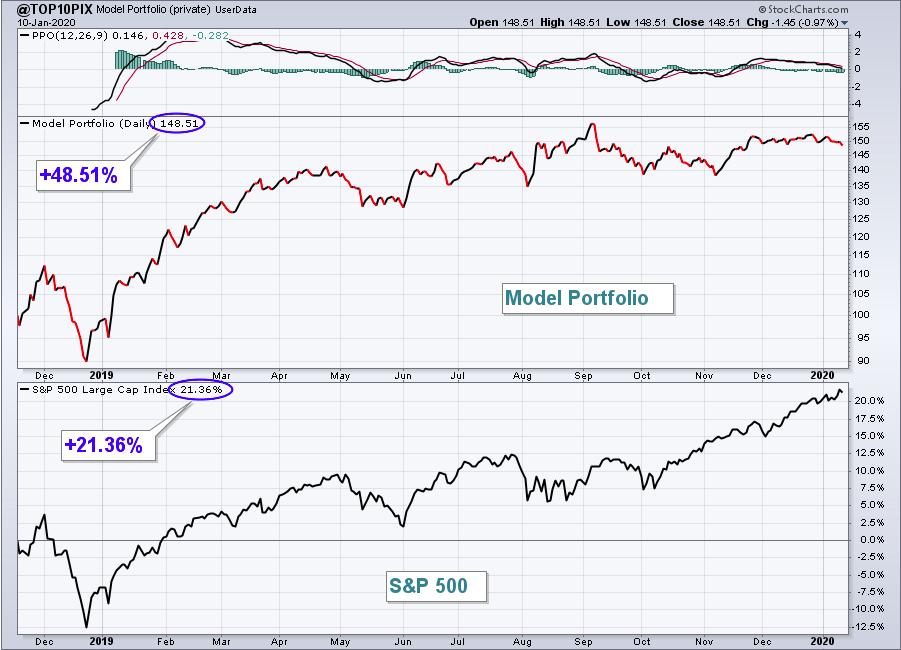
It has yet to follow the S&P 500 to new highs, although the Model portfolio's high in September was during a period of significant outperformance. There are a few reasons for the underperformance that I'm. Many stocks have performed well, but timing of purchase has definitely been an issue. AMAT is a perfect example. Most of the current quarter for AMAT has been consolidation. Obviously, purchasing at a lower level would benefit the portfolio immensely. There's still another five weeks until we replace the stocks in our portfolios, so we'll see how these stocks do through earnings season and go from there.
Here are how the Model portfolio component stocks performed last week:
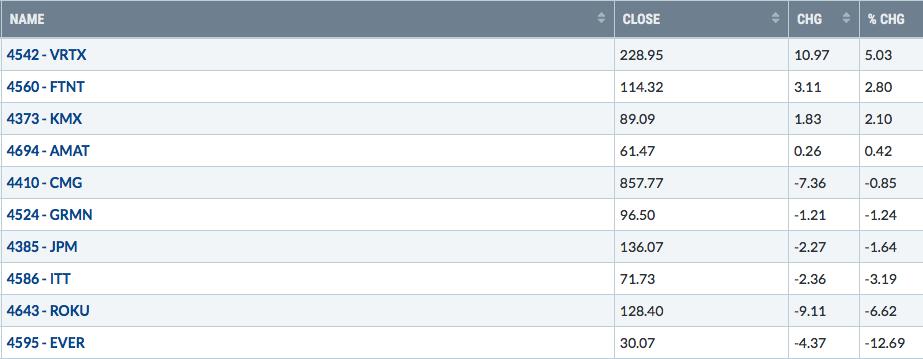
As a reminder, KMX was stopped out a few weeks ago just below 90, so it no longer has an impact on Model portfolio performance. I don't want to delete it because I want to keep record of having it in the portfolio. I've saved all portfolios since the concept was introduced on November 19, 2018.
ROKU and EVER have easily been the most volatile stocks in the portfolio and they both had rough weeks, contributing to the weak relative performance. On a brighter note, VRTX, FTNT, and CMG all printed new highs.
Aggressive Portfolio:
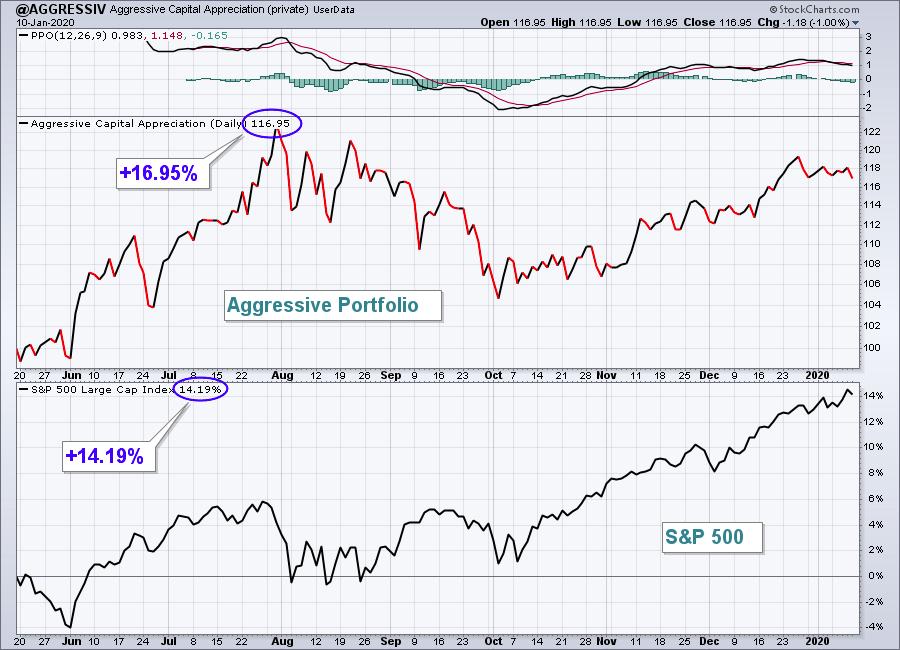
The Aggressive portfolio fell 0.49% last week, but fairly strong performance this quarter is being masked by the continuing weak overall performance of small caps and mid caps. Last week, both the S&P 600 Small Cap Index ($SML, -0.99%) and S&P 400 Mid Cap Index ($MID, -0.21%) fell and significantly underperformed the S&P 500. Here's the Aggressive portfolio chart since its inception on May 19, 2019:
Here are how the Aggressive portfolio component stocks performed last week:
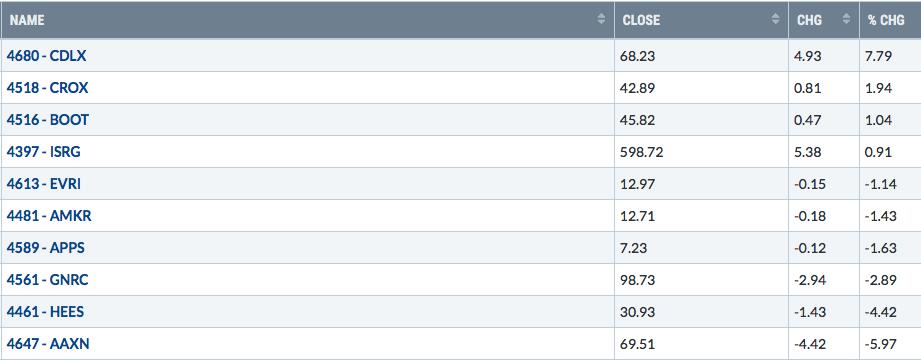
The two extreme stocks on this list, CDLX and AAXN, are clearly showing different paths right now:
CDLX:
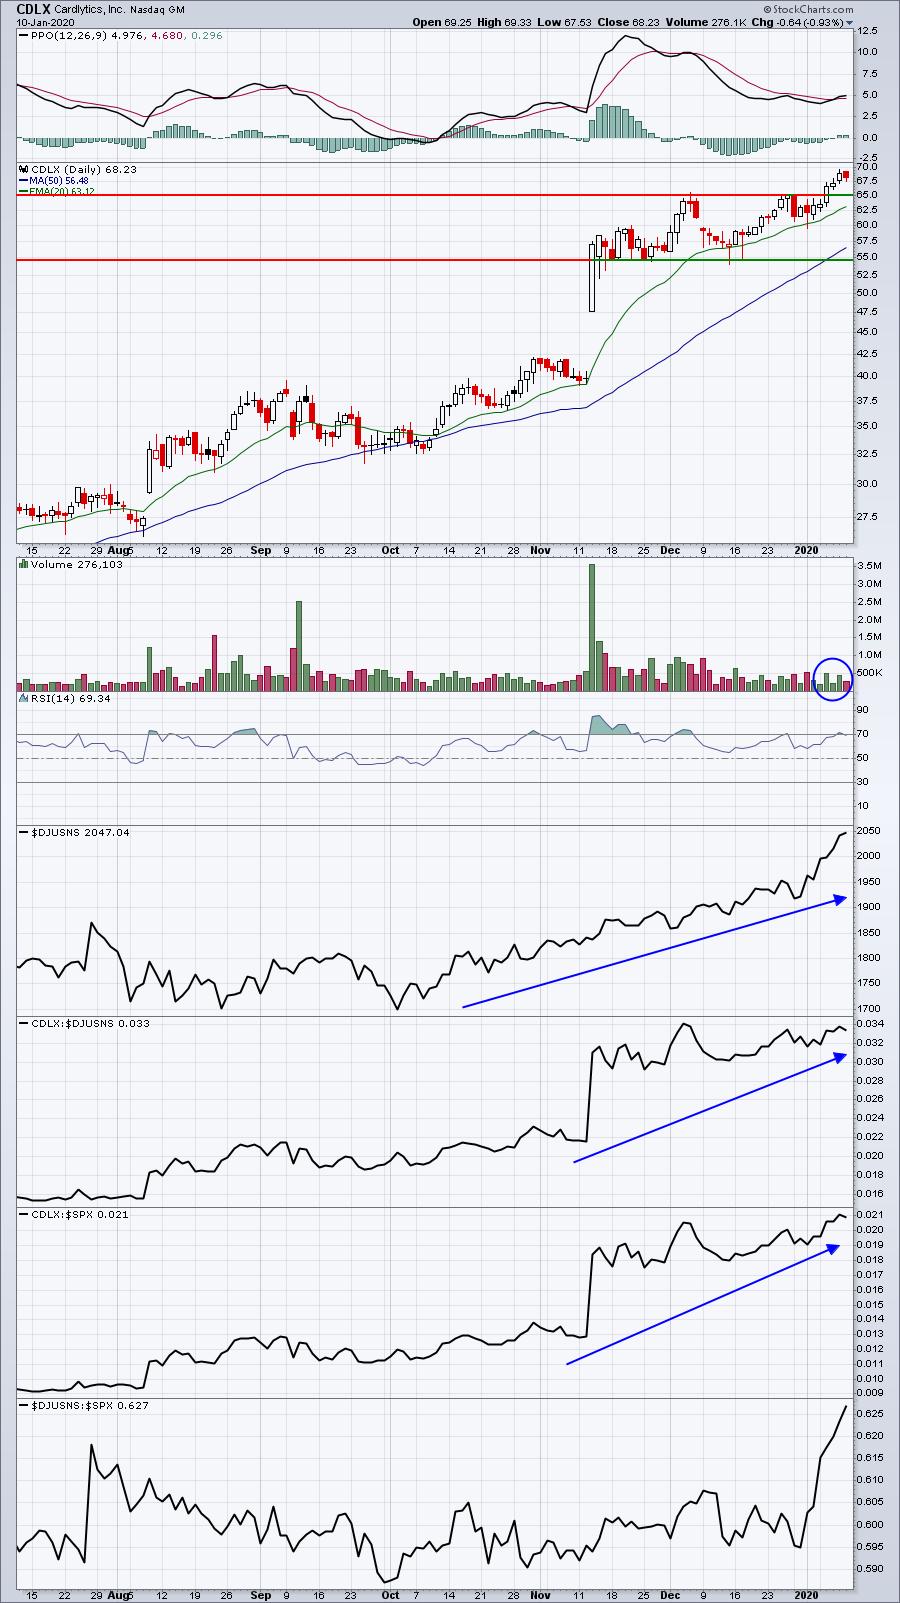
CDLX is part of a very strong internet group ($DJUSNS) and is showing leadership. The volume on the latest breakout is tailing off a bit. I wouldn't say it was light, but it was definitely lighter than what we saw throughout November and early December. Still, the trend is clearly higher.
AAXN:
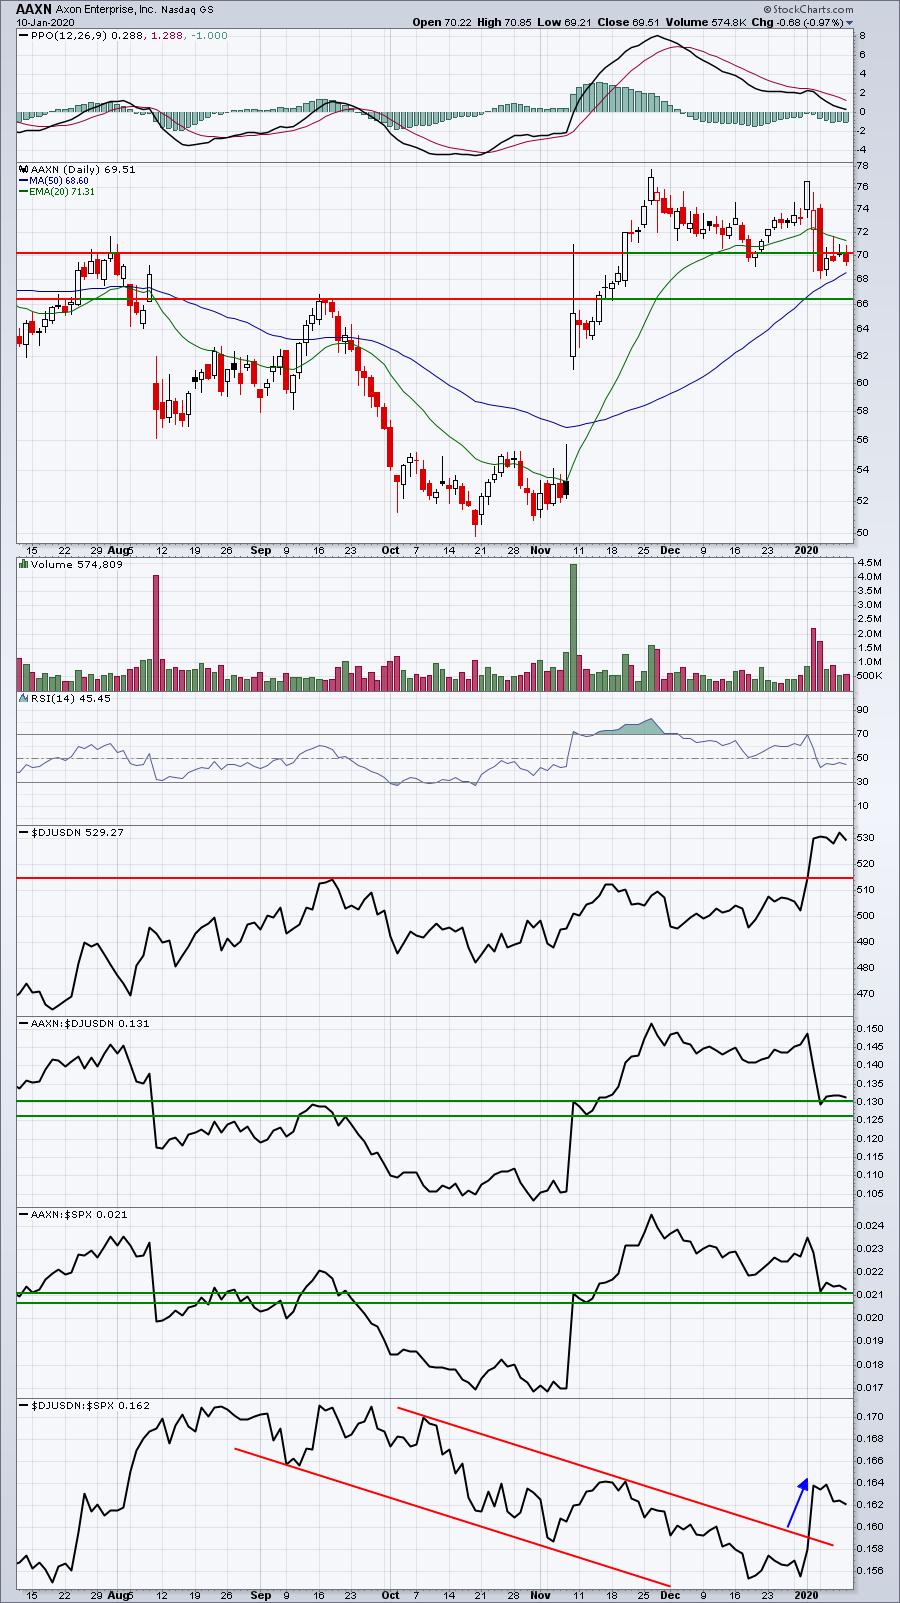
Defense stocks ($DJUSDN) opened 2020 strong, especially after the U.S. airstrike in Baghdad just over a week ago. Since then, however, tensions in the Middle East seem to have died down and the DJUSDN has failed to follow through on early-January strength. Meanwhile, AAXN has been a relative underperformer in the industry, contributing to those poor results last week. I've indicated a couple key short-term support levels I'd watch here.
Income Portfolio:
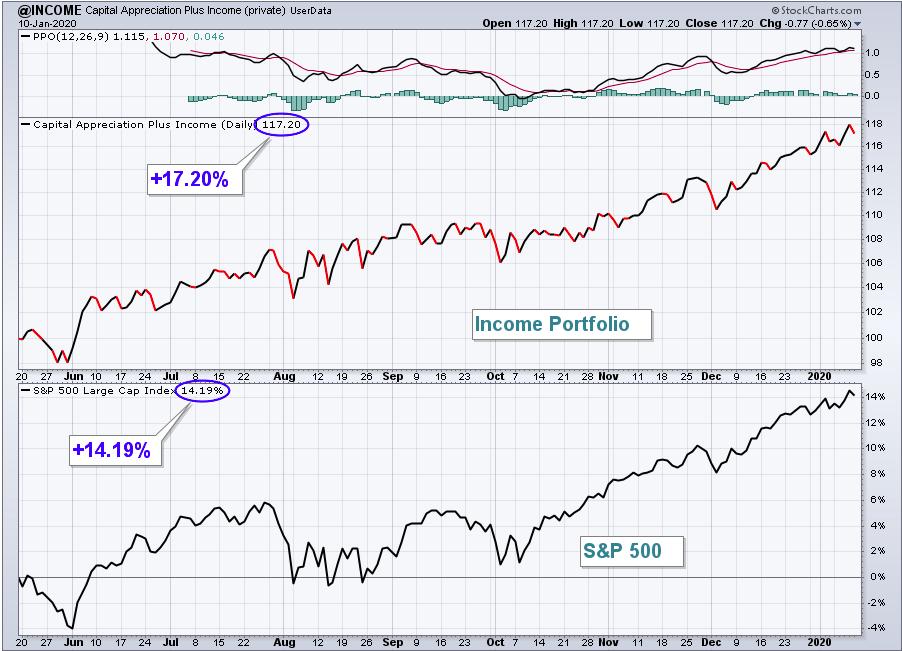
The Income portfolio trailed the S&P 500 last week, but still gained 0.61%. Here's a look at the inception-to-date chart:
Here are how the Income portfolio component stocks performed last week:
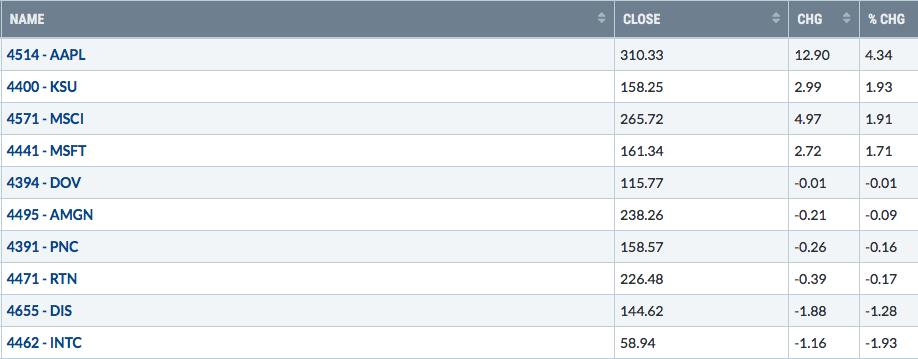
AAPL has been a monster. If you own it, you probably know that it's been helping to carry your portfolio. It's definitely been carrying the Income portfolio, and AAPL, along with MSFT, represent nearly 10% of the S&P 500. One reason that the Income portfolio has outperformed the S&P 500 this quarter (and is the only one to do so, by the way) is that it owns those two stocks. If you don't own AAPL and MSFT (but especially AAPL), it makes it more difficult to beat the benchmark.
All 10 Income portfolio stocks remain quite strong technically, which is helping as well. The lower volatility is also quite apparent.
Value Portfolio:
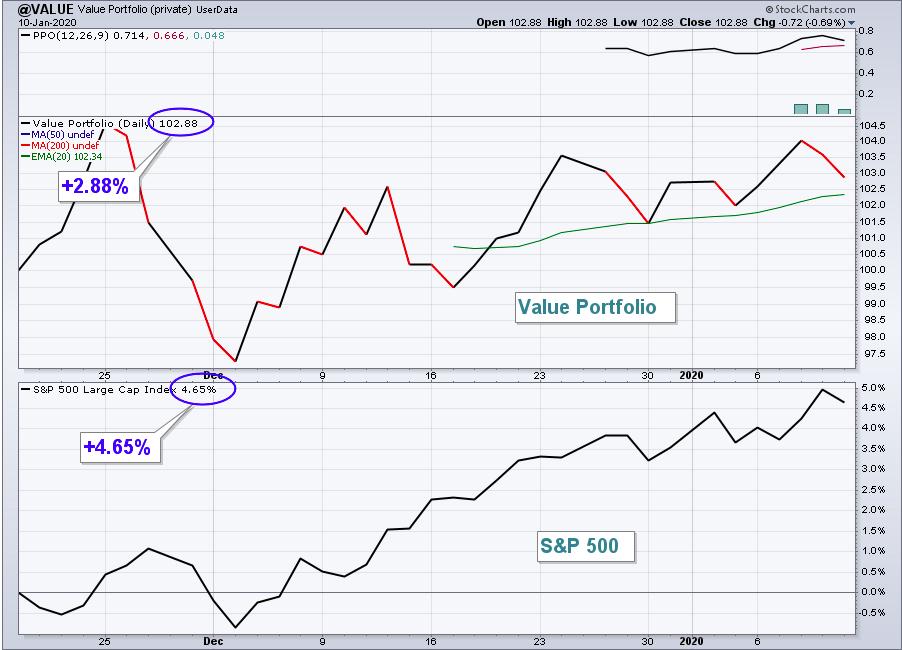
The Value portfolio had another volatile week, ending with a 0.85% gain. Here is the inception-to-date chart since November 19, 2019:
Here are how the Value portfolio component stocks performed last week:
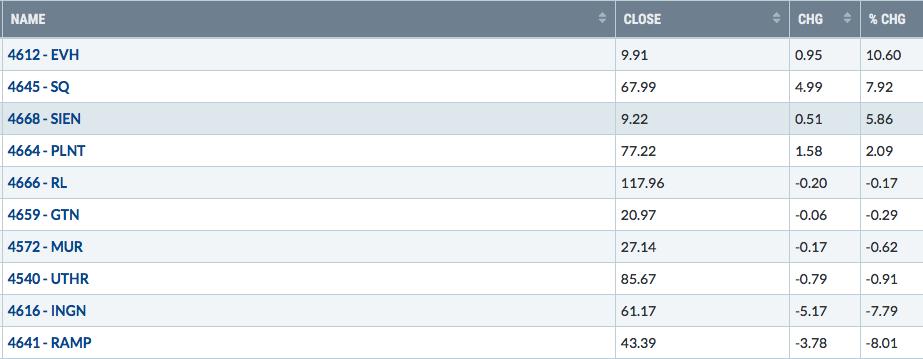
The Value portfolio is the latest portfolio that we added at EarningsBeats.com, with inception on November 19, 2019. Quite honestly, I didn't know what to expect from this group in terms of overall performance. I did expect it to be extremely volatile, however, and I haven't been disappointed in that regard. You might think "value stocks" and think the exact opposite, but this Value portfolio isn't "value" in the traditional sense. These stocks were not selected for this portfolio because of low PE ratios, price-to-book-value multiples, and such. They represent "technical value" in that they were previously downtrending stocks that were significant relative underperformers that in their latest earnings report seemed to undergo a "character change" and perhaps turn things around. I expected that several of these stocks would continue their new-found relative strength, but that others would return to their underperforming ways. Owning a portfolio of 10 such stocks would help to offset relative weakness with relative strength. Week to week, that's exactly what we've been seeing. It will be interesting to see how the results stack up after three months and whether this strategy proves to outperform the S&P 500 over several quarters.
Summary
The best news, for all of us, is that U.S. equities are doing what they typically do during secular bull markets. They rise. And they seem to be rising every week without pause. It's confounding those with a perma-bearish bias. Our portfolios are all higher this quarter, but outperforming the benchmark will likely require a change in investor attitude and preference. Large caps remain a favored asset class. Small and mid caps have enjoyed returns that are approximately 1/2 of those generated by large caps since November 19th and that's part of the problem with 4 portfolios where 21 of 40 stocks are small and mid caps . Another consideration in the selection process in future quarters will be timing of purchase. Our buys are at the closing prices on February 19th, May 19th, August 19th, and November 19th. Historically, the 19th through the 25th of calendar months represent a weak period, perhaps allowing us to enter our portfolio stocks a bit cheaper, adding to portfolio performance. Given the new zero-commission trading environment, we will likely change our strategy of entering these stocks. I'll be planning that change over the next 5 weeks as we approach the February 19th portfolio selection date.
We'll continue to use fundamentals and technicals and tweak our strategy from time-to-time to produce portfolios that outperform over time.
Happy trading!
Tom Bowley, Chief Market Strategist
EarningsBeats.com
"Better timing. Better trades."