
EB Weekly Portfolio Report - Sunday, January 19, 2020
Upcoming Earnings Reports (New Feature)
The following companies will be reporting earnings this week and they're a component of one of our portfolios:
Tuesday, January 21: None
Wednesday, January 22: None
Thursday, January 23: INTC, ISRG
Friday, January 24: None
PLEASE NOTE: The above companies were provided after scanning the Zacks Earnings Calendar. My research is limited to what Zacks provides and I also can make a mistake from time to time, so please check for earnings dates for all companies that you own. We do hold our portfolio stocks through one earnings report, but every EarningsBeats.com member must make their own investing/trading decisions about holding stocks into their earnings reports as it's the most volatile time to own a stock.
Portfolio Rules and Objectives
Here are the common traits and objectives of each portfolio:
- There are 10 leading stocks from 10 leading industries in each portfolio (at the time of selection)
- They are held for an entire 90 day period, with generally no stops in place (KMX and UTHR were exceptions)
- Every stock will generally be held through ONE earnings report
- The expectation is that relative winners will carry the portfolio to outperformance
- They are all entered into as of February 19, May 19, August 19, and November 19 (these dates are used as we are generally past the majority of earnings reports by these dates)
- Primary objective is to outperform the benchmark S&P 500
Here are several considerations for EB members:
- I would expect the Value and Aggressive portfolios to be the riskiest, followed by the Model portfolio, and then the Income portfolio
- The Value portfolio is a new breed and is much different from the others; it's quite diversified, but how it ranks in volatility among the four remains to be seen - I would anticipate high volatility
- The Income portfolio stocks will all pay dividends, with the expected average dividend yield to be at least 1.5%
- Drawdowns (losses) should be much milder on the Income portfolio, with more volatility expected on the other three; please review inception-to-date charts to gain an idea of volatility associated with each
- You should own or trade these stocks in whatever manner is most comfortable for you; while we buy all 10 stocks as of the dates identified above, feel free to trade certain stocks or wait for pullbacks if the stocks are overbought
- We have no idea what risk each member is willing or able to take. We are not registered investment advisors so be sure you understand the risk you take.
- EarningsBeats.com shareholders/employees may own all or some of the portfolio stocks from time to time.
Snapshot
Here's a weekly recap:
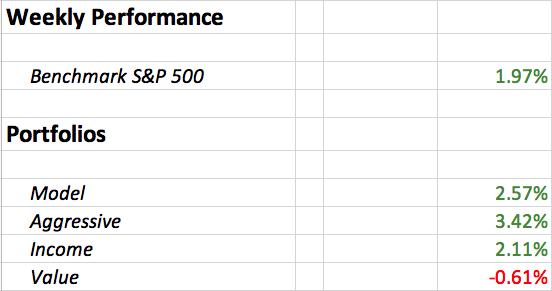
The wild volatility that has marked the Value portfolio continued last week with a couple stocks gaining substantially while a couple others were hit hard to the downside. Remember, this "Value" portfolio isn't value in the traditional sense. I want to keep reminding everyone of this. Stocks selected for this portfolio are based on technical turnarounds on their charts. The selection process has absolutely nothing to do with low PE ratios, low price-to-sales ratios, or any other traditional value measure.
I've received emails questioning if we should rename this portfolio and I believe that's a good idea. I'm accepting suggestions for a name. Turnaround Portfolio? I'm not in love with this. For those new to EarningsBeats.com or for those who haven't really followed this portfolio, it's represented by 10 stocks from 10 different industry groups that, until their latest quarterly earnings report, were mired in downtrending or sideways consolidating charts. In other words, they were "technically-challenged". After reporting quarterly results that beat Wall Street revenue and EPS estimates, they gapped higher and appeared to print a "character change" (breakaway gap) on their charts. This suggested to me that these companies could be primed to start a new uptrend, realizing that some would fail and return to their downtrending ways. The question was whether there would be enough BIG winners to outpace the losers and beat the benchmark S&P 500. It didn't happen last week, but I'm not ready to pass judgment for the long-term, so I'll continue selecting stocks and tracking results in 2020.
Sooooo.....
Do you have any thoughts for the name of this portfolio? If so, send them along to me at "[email protected]". You can put "New Portfolio Name" as the subject line. Let's come up with a more appropriate name. By the way, I won't agree with "Dumpster Fire Portfolio". :-)
Weekly Summary
Benchmark S&P 500:
The S&P 500 continued its very impressive secular bull market advance, rising another 1.97%. There's no stopping this freight train right now, despite all the warning signs that began flashing recently and that I discussed in an impromptu webinar earlier in the week. It is always so difficult to bet against one of these relentless rallies and usually a very frustrating shorting experience, if you take that route - which I have and would continue to strongly discourage.
The move in transports ($TRAN), small caps ($SML) and mid caps ($MID) to 52 week highs cannot be overemphasized. This type of market behavior is almost always associated with massive gains in the S&P 500. So while the charts might be flashing short-term warning signals, the long-term could not be any brighter.
Model Portfolio:
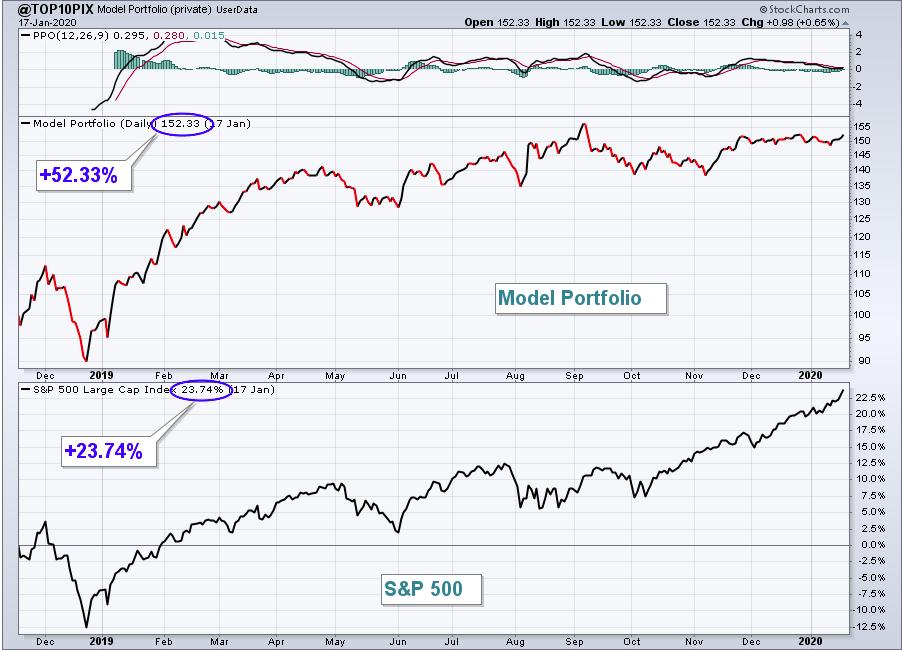
The Model portfolio rebounded nicely last week, gaining 2.57% for the week. Here's the updated inception-to-date chart of the portfolio:
Here are how the Model portfolio component stocks performed last week:
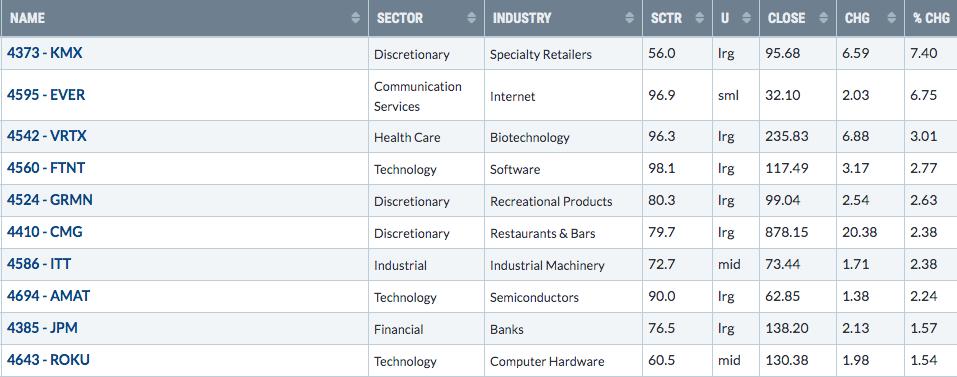
Our Model portfolio performance did not include the big gain in KMX. We placed a stop on KMX on any close below 90 and it was stopped out on December 23rd at 89.18. So our weekly results are not impacted by any future ups and downs in KMX (unfortunately). It's (along with the UTHR stop) taught me a lesson for these portfolios. Don't try to fix what ain't broken.
These portfolios were designed to be held for 90 days, with the underlying belief that outperformers would carry underperformers. This quarter, I tweaked the strategy and, as fate would have it, we've been stopped out of the rebounding stocks and have not had stops on those that have moved lower. In future portfolios, I will resist the temptation to approach these portfolios with stops. Our EarningsBeats.com members can choose to use them if they'd like, but for our calculation purposes, there will be no stops.
All 9 of our remaining Model portfolio stocks gained ground last week, which was nice.....and unusual. EVER and ROKU were the best and worst performers, respectively. VRTX, FTNT, GRMN, CMG, and AMAT all hit fresh new highs.
Aggressive Portfolio:
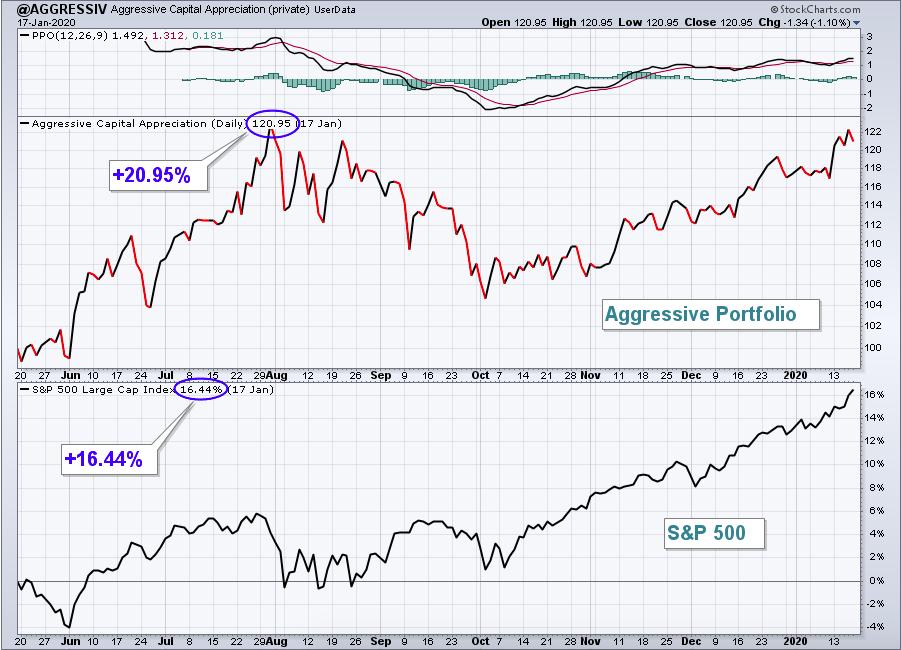
The Aggressive portfolio surged last week, rising 3.42%. Last week, both the S&P 600 Small Cap Index ($SML, +2.81%) and S&P 400 Mid Cap Index ($MID, +2.15%) broke out and that most certainly helped the Aggressive portfolio. Here's the Aggressive portfolio chart since its inception on May 19, 2019:
Here are how the Aggressive portfolio component stocks performed last week:
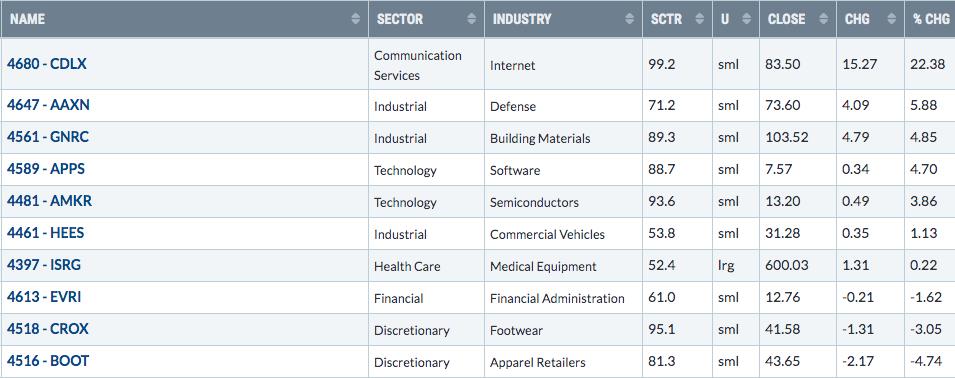
CDLX had another huge week, rising more than 22% and breaking out to an all-time high. Volume trends are extremely bullish, suggesting major accumulation on Wall Street. The big week in CDLX also masked a few stocks that underperformed, among them BOOT which is now nearing an important channel support line:
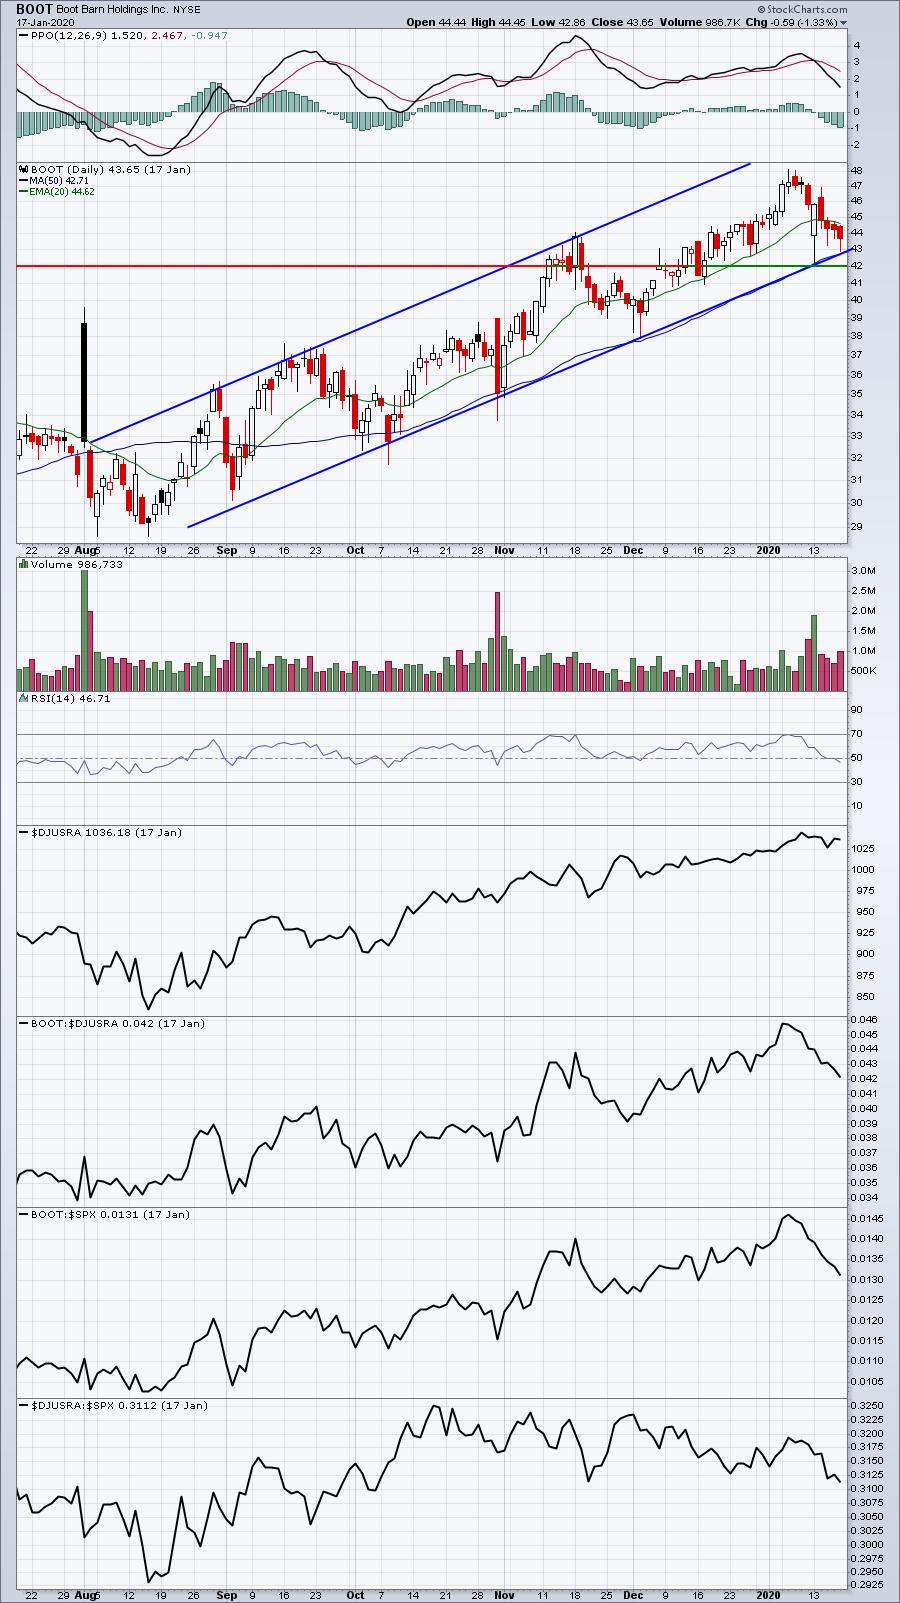
Relative strength has been deteriorating, but that typically occurs when stocks pull back and consolidate. At BOOT's recent price high, its relative strength was also at a 52 week high. BOOT remains technically sound, in my view.
Income Portfolio:
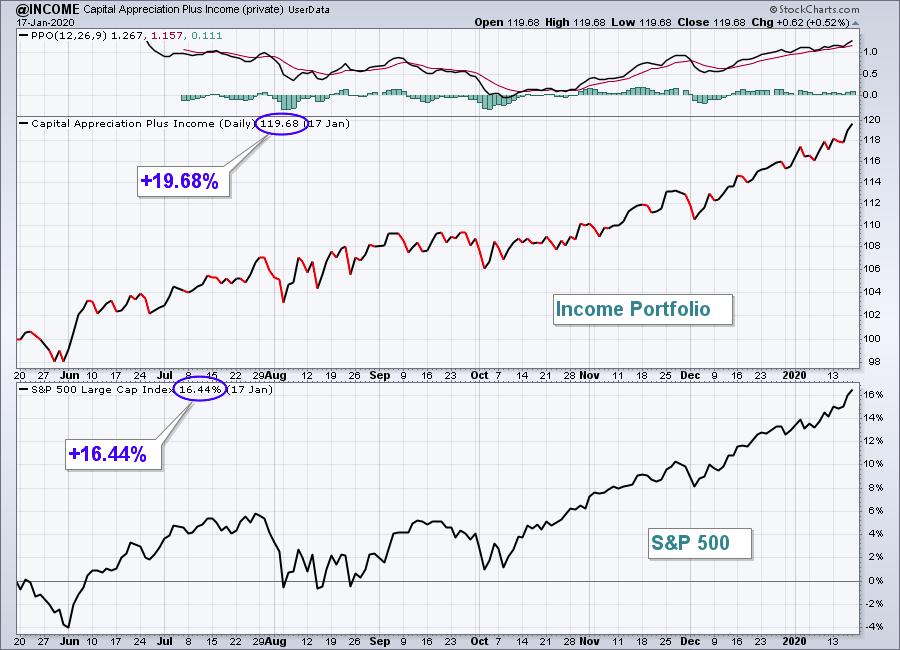
The Income portfolio slightly outperformed the S&P 500 last week, tacking on 2.11%. Here's a look at the inception-to-date chart:
Here are how the Income portfolio component stocks performed last week:
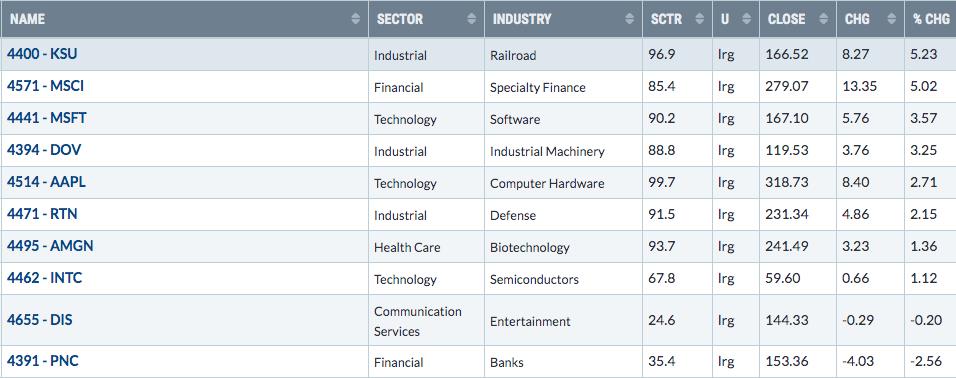
KSU was the best performer last week, despite missing its revenue estimate on Friday morning during pre-market action. It did beat its EPS estimate (1.82 vs 1.81), however, and buyers returned after a slight gap lower on the open. PNC was the other Model portfolio stock to report earnings. Despite easily beating revenue and EPS estimates, PNC fell victim to the "buy on rumor, sell on news" Wall Street adage. Technically, there was a negative divergence on its chart so a test of both PPO centerline support and its 50 day SMA was to be expected:
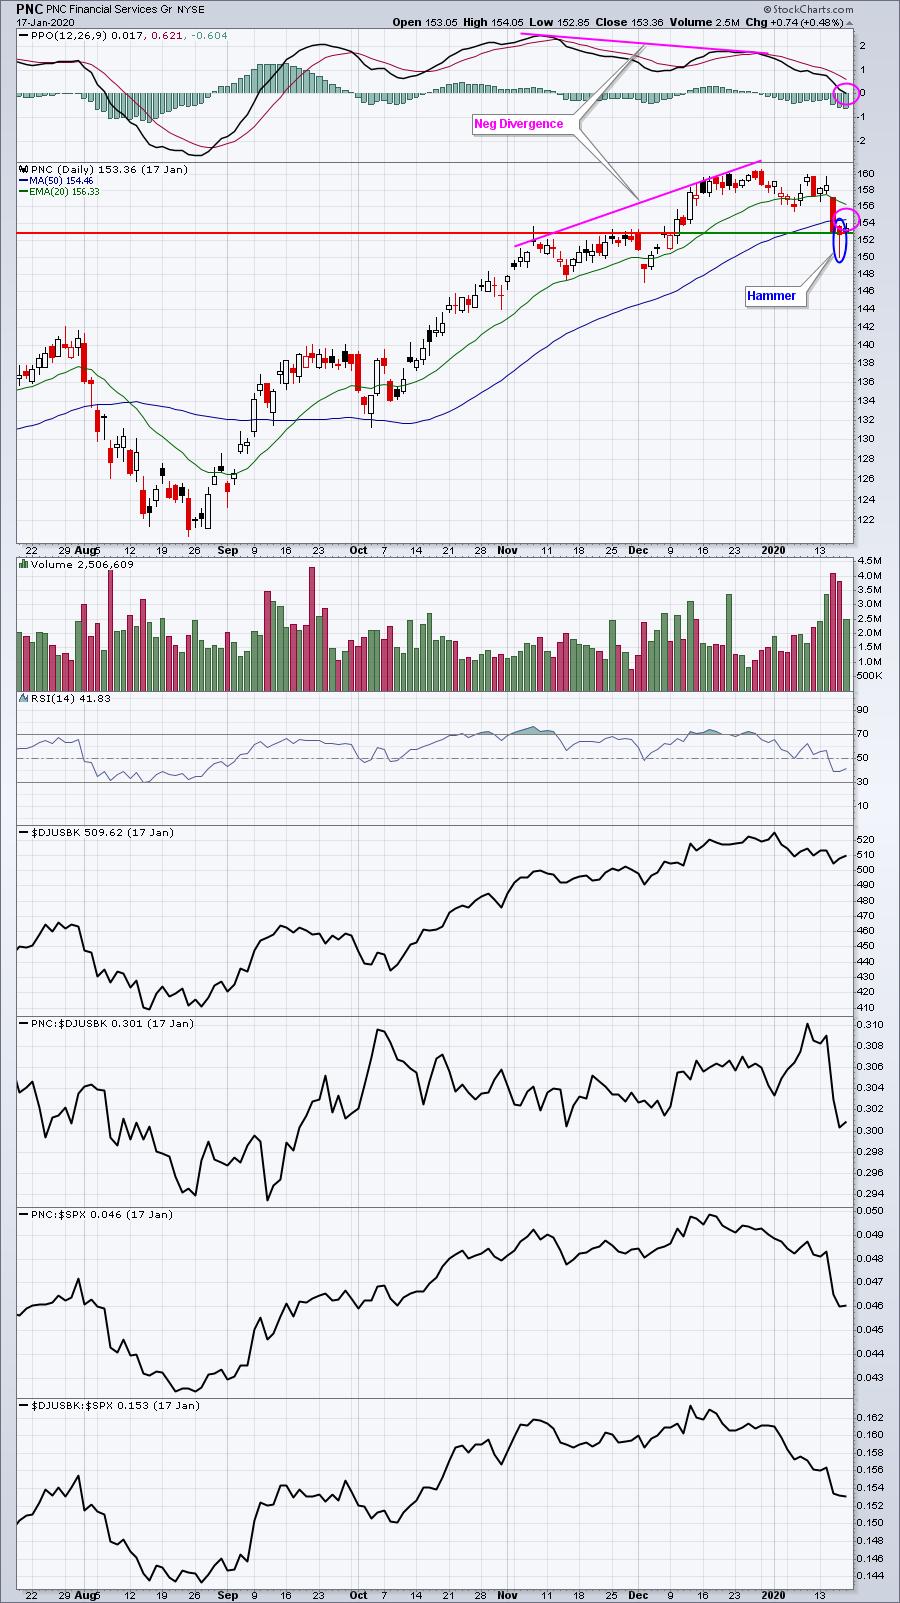
The hammer likely put in a key bottom, though PNC's 20 week EMA (not pictured above) is currently near 149. We can't rule out a 20 week EMA test.
Value Portfolio:
The Value portfolio had another volatile week, trailing the S&P 500 and ending with a 0.61% loss. Here is the inception-to-date chart since November 19, 2019:
Here are how the Value portfolio component stocks performed last week:
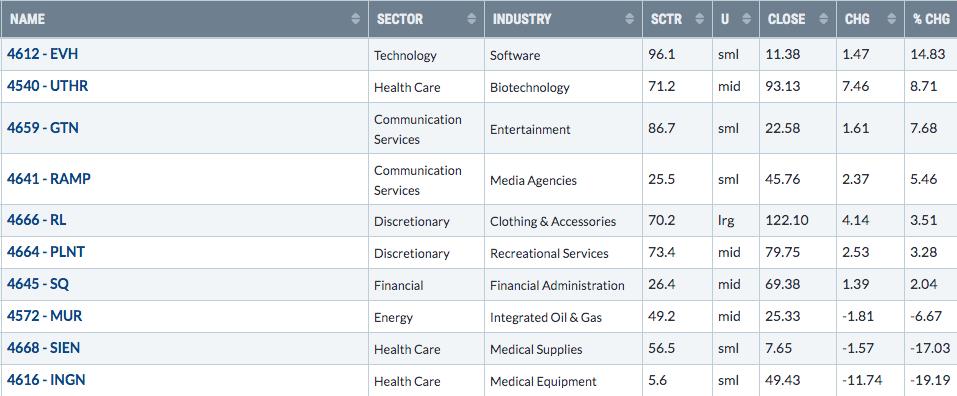
That is crazy volatility. UTHR has stopped out and its weekly gain was not included in this week's Value Portfolio performance. Three stocks were lower by more than 5% with two down 19% and 17%. But four were higher by more than 5% with EVH surging another 15%. EVH was added to the Value portfolio at 9.69 on November 19, 2019 hit an intra-quarter low at 5.67, and since has surged to its Friday close of 11.38 - all in the span of two months! Unfortunately, we have a Value portfolio stock, INGN, that's done the opposite:
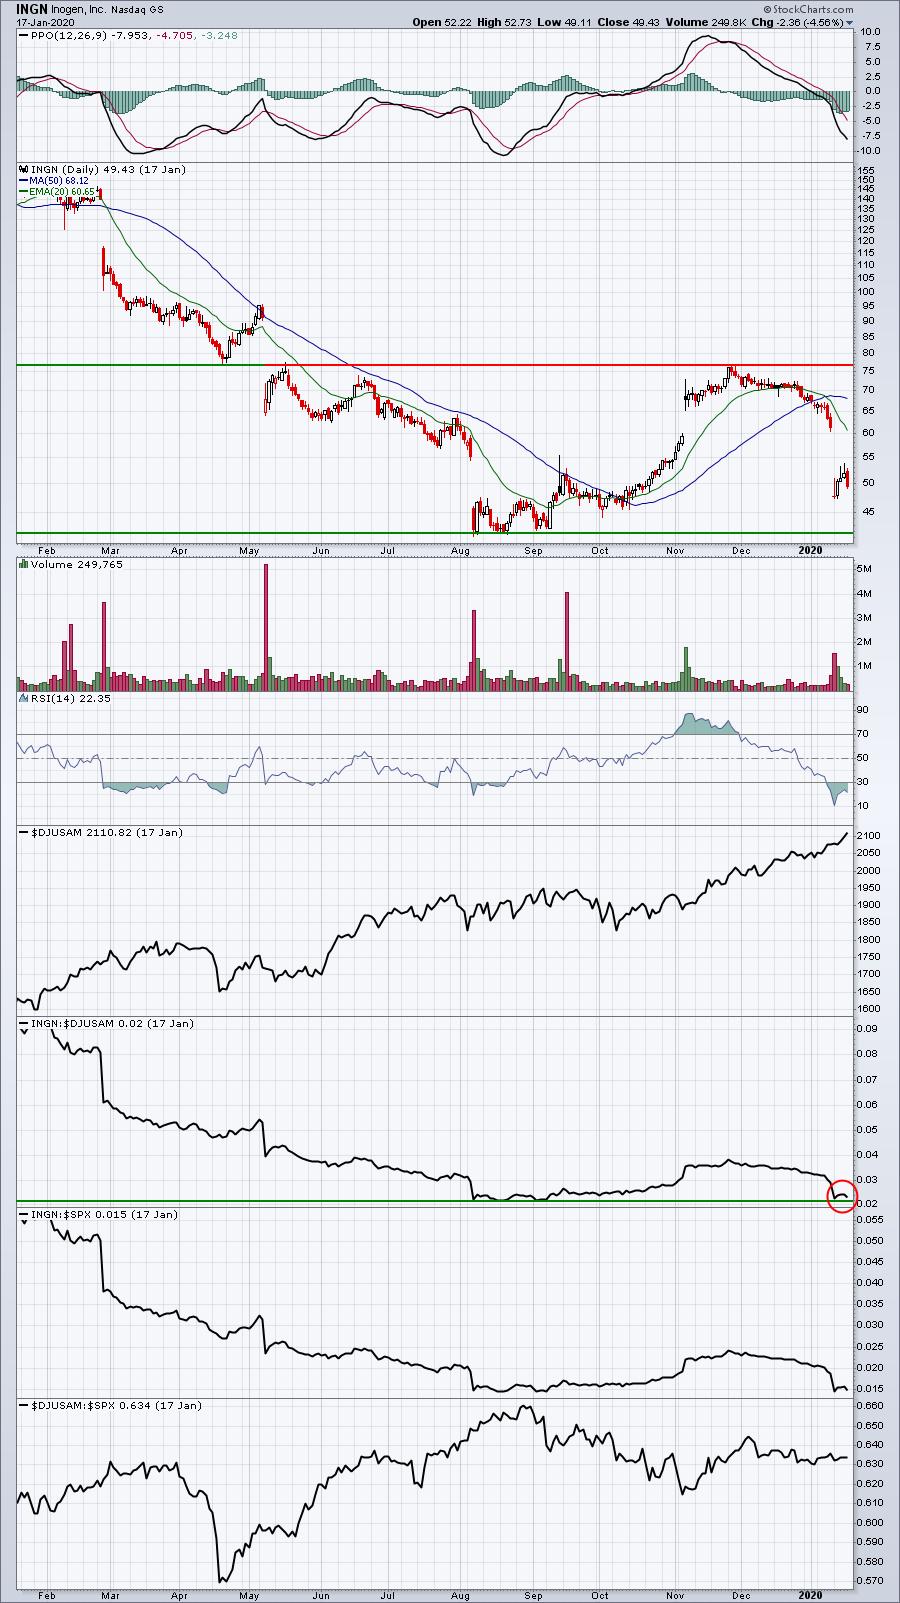
After gapping up with earnings, INGN ran another 10% before beginning a downtrend that accelerated big time last week when the company announced preliminary Q4 revenues that were much lower than anticipated. INGN is now at relative support, but if that's lost, then the August/September price low near 41 could come into play.
Summary
First, the U.S. stock market had another very solid week and looks poised for further gains in 2020. I had a January Effect webinar recently that shows the significance of January gains (or losses) has historically enjoyed a positive correlation with the balance of year performance. Currently, the S&P 500 is higher by 3.06% in January. To move into the top quadrant (25%) of Januarys since 1950, the S&P 500 would need to gain more than 4.15% for the month. That would require an S&P 500 close of 3365 or higher on January 31st. In such "top quadrant" years, the balance of the year has averaged moving higher by 15.27%. Therefore, quick math would say that a January 31st close of 3365 would result in a December 31st close of 3878. Considering that I'm on record predicting that the S&P 500 hits 4040 in 2020, the January Effect provides a path to potentially get there - or at least close.
Happy trading!
Tom Bowley, Chief Market Strategist
EarningsBeats.com
"Better timing. Better trades."