
EB Weekly Portfolio Report - Sunday, March 8, 2020
Upcoming Earnings Report
The following companies will be reporting earnings this week and each is a component of one of our portfolios:
Monday, March 9: None
Tuesday, March 10: None
Wednesday, March 11: None
Thursday, March 12: None
Friday, March 13: None
PLEASE NOTE: The above companies were provided after scanning the Zacks Earnings Calendar. My research is limited to what Zacks provides and I also can make a mistake from time to time, so please check for earnings dates for all companies that you own. We do hold our portfolio stocks through one earnings report, but every EarningsBeats.com member must make their own investing/trading decisions about holding stocks into earnings reports as it's the most volatile (risky) time to own a stock.
Portfolio Rules and Objectives
Here are the common traits and objectives of each portfolio, some of these were just changed for our February 19th "draft" day last week (changes for the upcoming quarter are in bold italics):
- There are 10 leading stocks from up to 10 leading industries in each portfolio (at the time of selection) - the change here is to allow a second stock within the same industry group
- They are held for an entire 90 day period, with no stops in place - there will be NO stops. All stocks will be held for the entire period (members may choose to have stops, but we will not)
- Every stock will generally be held through ONE earnings report
- The expectation is that relative winners will carry the portfolio to outperformance
- They were all entered into as of close on February 19th
- We decided against having multiple entries for our purposes, but members were encouraged to enter based on whatever felt most comfortable
- Primary objective is to outperform the benchmark S&P 500
Here are several considerations for EB members:
- I would expect the CC (Character Change, formerly Value portfolio) and Aggressive portfolios to be the riskiest, followed by the Model portfolio, and then the Income portfolio
- The CC portfolio's strategy and composition was changed a bit in it second quarter, as we decided to include companies that have broken out of a consolidation range, not just those with breakaway gaps to end a downtrend
- The Income portfolio stocks will all pay dividends, with the expected average dividend yield to be at least 1.5%
- Drawdowns (losses) should be much milder on the Income portfolio, with more volatility expected on the other three; please review inception-to-date charts below to gain an idea of the volatility associated with each
- You should own or trade these stocks in whatever manner is most comfortable for you; while we will buy all 10 stocks in the manner identified above, feel free to trade certain stocks or wait for pullbacks if the stocks are overbought
- We have no idea what risk each member is willing or able to take. We are not registered investment advisors so be sure you understand the risk you take. Please consult your financial advisor.
- EarningsBeats.com shareholders/employees may own all or some of the portfolio stocks from time to time.
Snapshot
Here's a weekly recap:
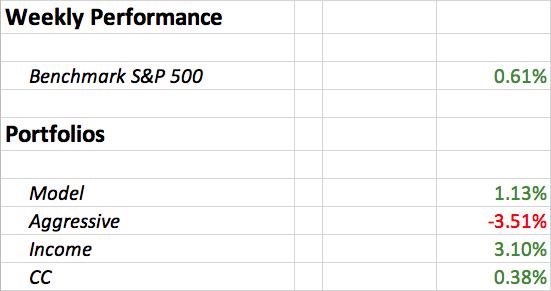
It was a wild week in terms of volatility as the VIX came into the week near 40, quickly dropped back to 25, then shot higher and hit 54 on Friday....before closing back near 42. It was truly a roller coaster ride. We saw tremendous volatility in our portfolios as well, with excellent performance in our Income portfolio, while our Aggressive portfolio was very weak. More on that below.
Weekly Summary
Benchmark S&P 500:
The S&P 500 traded in a wide 8% range this past week before finishing with a modest gain of 0.61%. I see plenty of positives and negatives each week. Last week, perhaps the biggest positive was the way we finished every day. The final hour or two of each day showed significant buying interest:
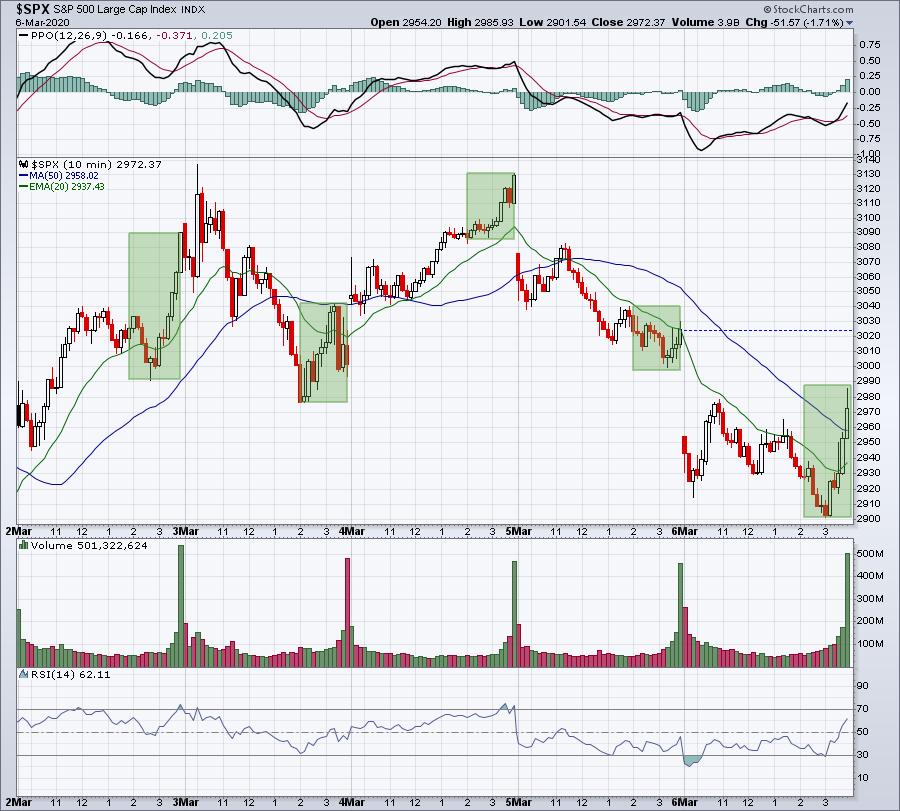
The green-shaded areas highlight trading during the final two hours of every day last week. Only Thursday showed weakness. Normally, in a bear market, we grow accustomed to selling at the end of the day as no one wants to hold overnight. That didn't seem to be an issue last week and will be something to keep watching in the days and weeks ahead.
Model Portfolio:
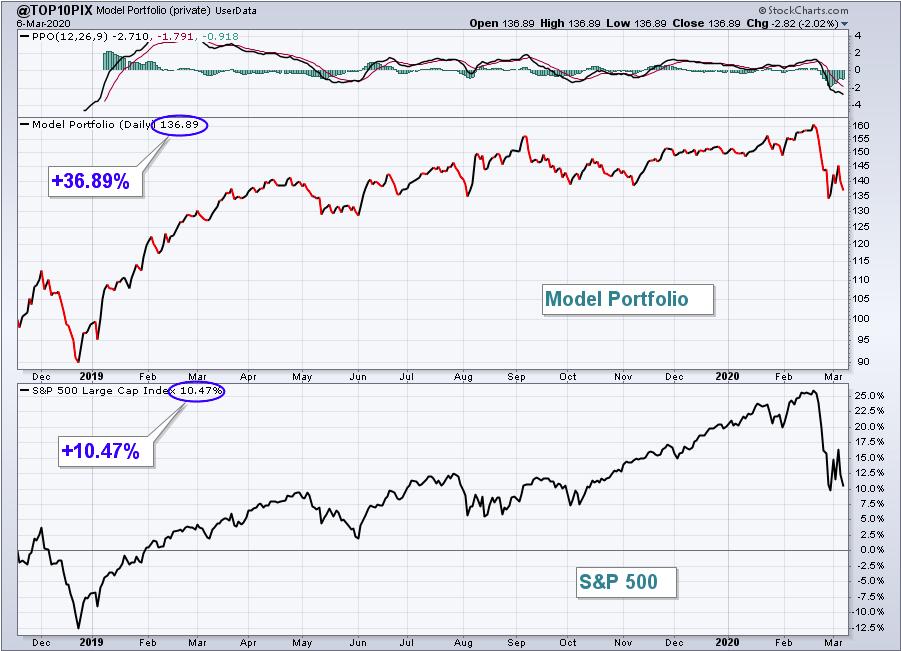
The Model portfolio rebounded and outperformed the S&P 500, gaining 1.13%. Here's the updated inception-to-date chart of the portfolio:
Here are how the Model portfolio component stocks performed last week:
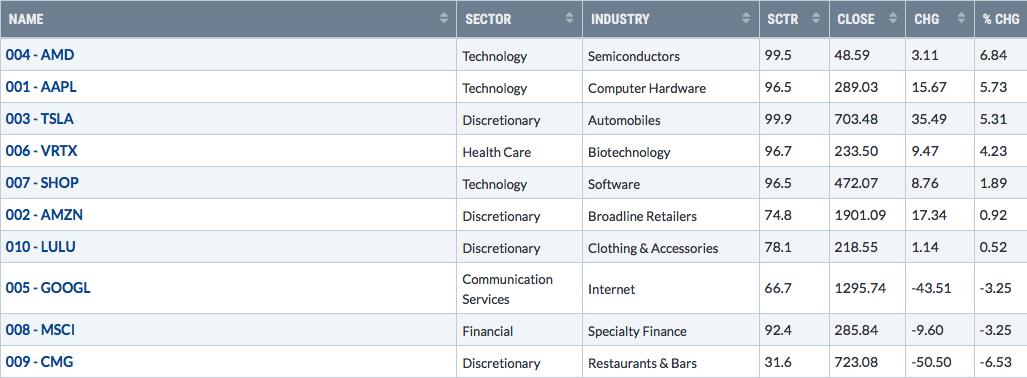
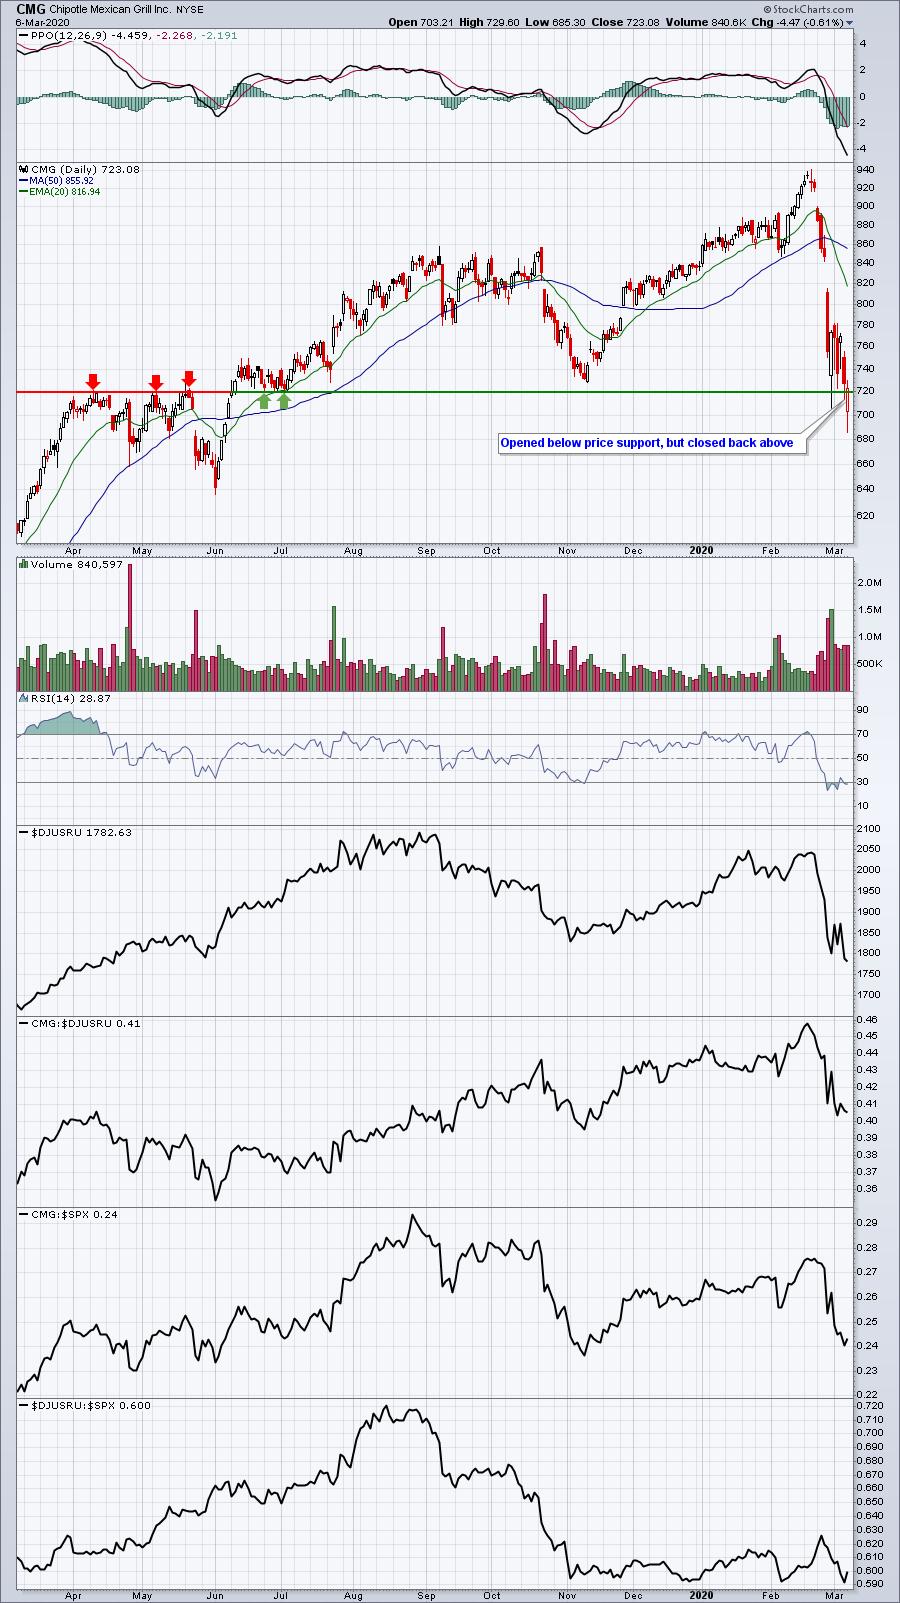
There was a mixture of gains and losses. Financials (XLF), communication services (XLC), and consumer discretionary (XLY) were among the worst performing sectors last week. Only energy (XLE) was worse. I am definitely worried about CMG, mostly because of coronavirus fears. Restaurants ($DJUSRU) would seem to be obvious candidates for selling if the fear continues to build. Here's the chart with CMG nearly losing a critical support level:
Aggressive Portfolio:
The Aggressive portfolio performed miserably for a couple different reasons and fell 3.51%. Here's the Aggressive portfolio chart since its inception on May 19, 2019:
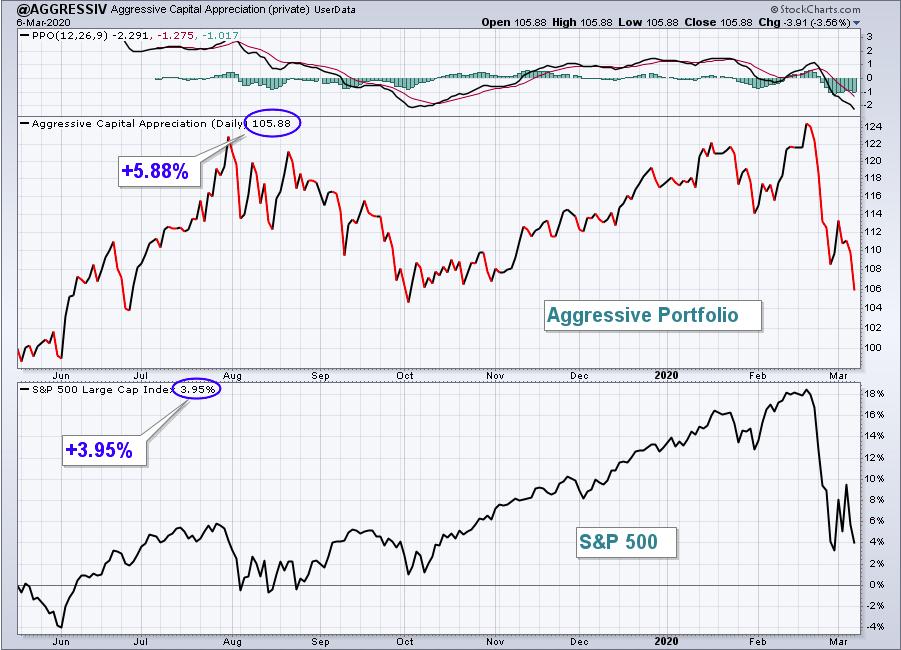
The Aggressive portfolio is home to two internet stocks ($DJUSNS) and the overall group performed poorly last week, dropping nearly 4% cumulatively. One of those stocks, CDLX, reported quarterly results and was crushed for lowering future revenue guidance. Based on the numbers I saw, it appears to be a major overreaction, but the price is what it is. CLDX is now down more than 50% from our February 19th portfolio selection date, which means it's contributed a 5 basis point drop in the Aggressive portfolio.
Adding fuel to the fire for this portfolio last week was the performance of both small caps ($SML) and mid caps ($MID), which lost 1.99% and 0.89%, respectively. Our Aggressive portfolio is comprised by small and mid caps.
Here are how the Aggressive portfolio component stocks performed last week:
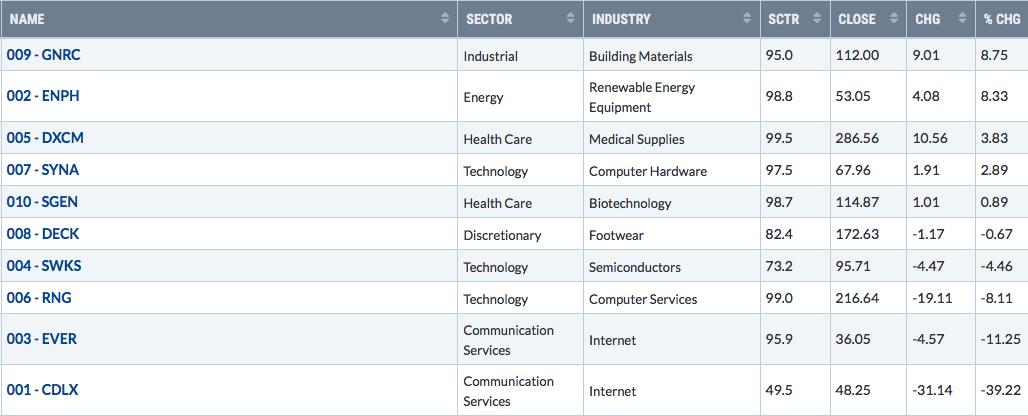
There were solid winners, but the extreme weakness of CDLX and EVER, the two internet stocks, overshadowed any strength being shown elsewhere. Here's the current look at CDLX on a longer-term weekly chart:
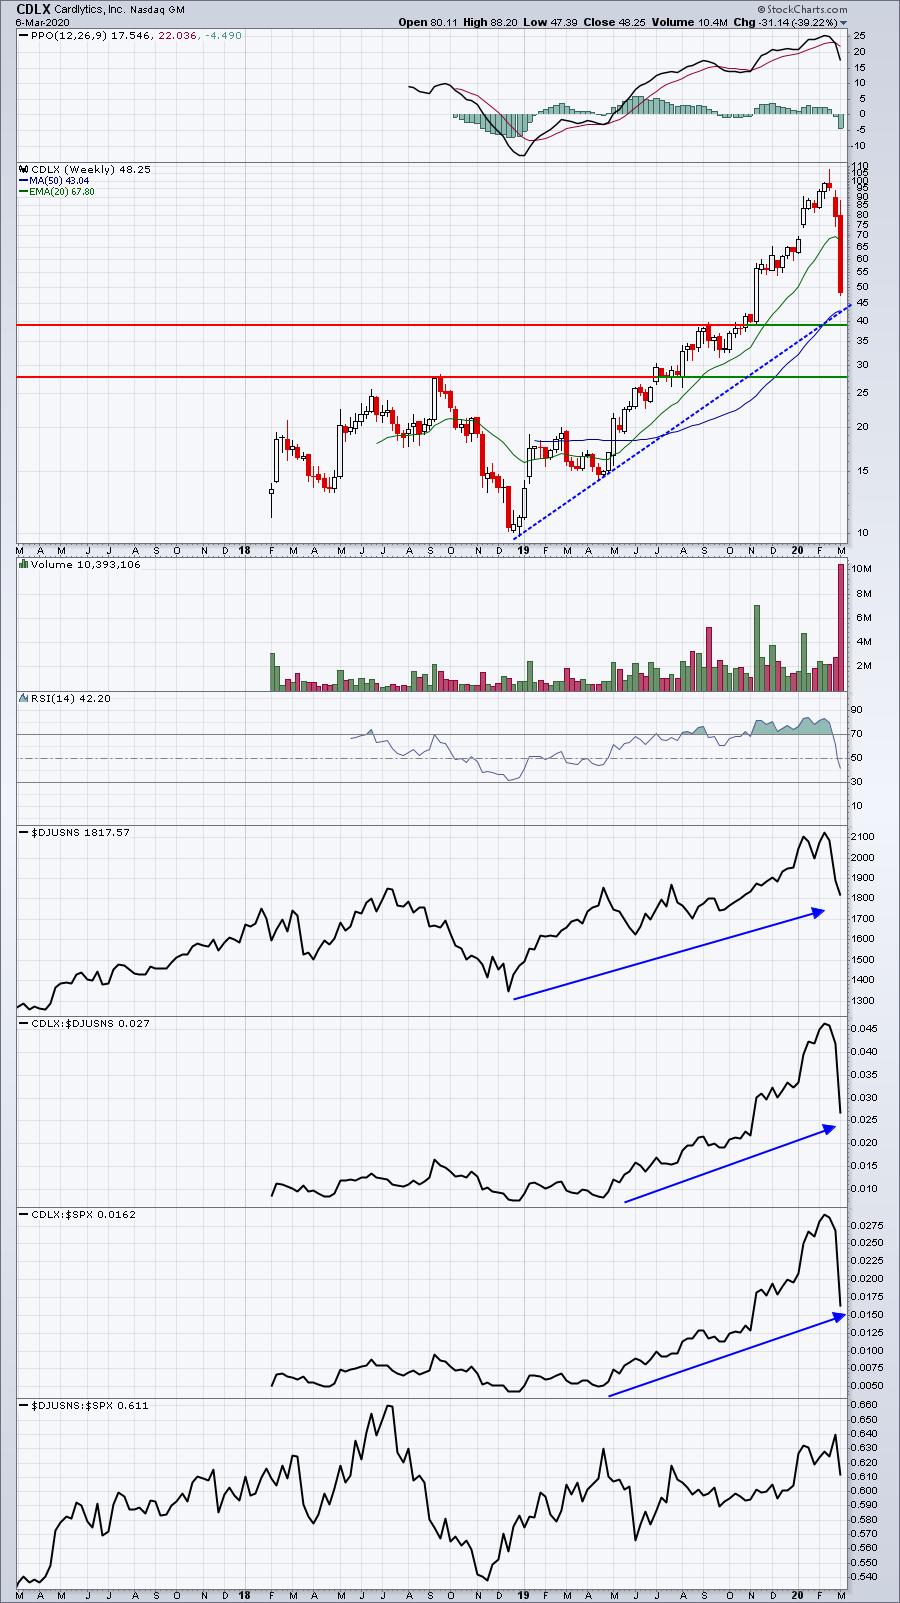
It's been a rough two weeks for CDLX, but this stock is not alone. High growth companies that show any signs whatsoever of slowing growth take hits similar to this. In the history of our portfolios, we've seen a couple of these, namely Enphase Energy (ENPH) and Alteryx (AYX), both of which were trampled in our portfolios. They both recovered to set new highs. I'm not providing any sort of guarantee on CDLX future performance. I just want to point out that hiccups in the charts of strong companies do happen. Hopefully, we'll see some recovery in this stock before the portfolio's quarter ends on May 19th.
Income Portfolio:
The Income portfolio had an outstanding week, surging 3.10% . Here's a look at the inception-to-date chart:
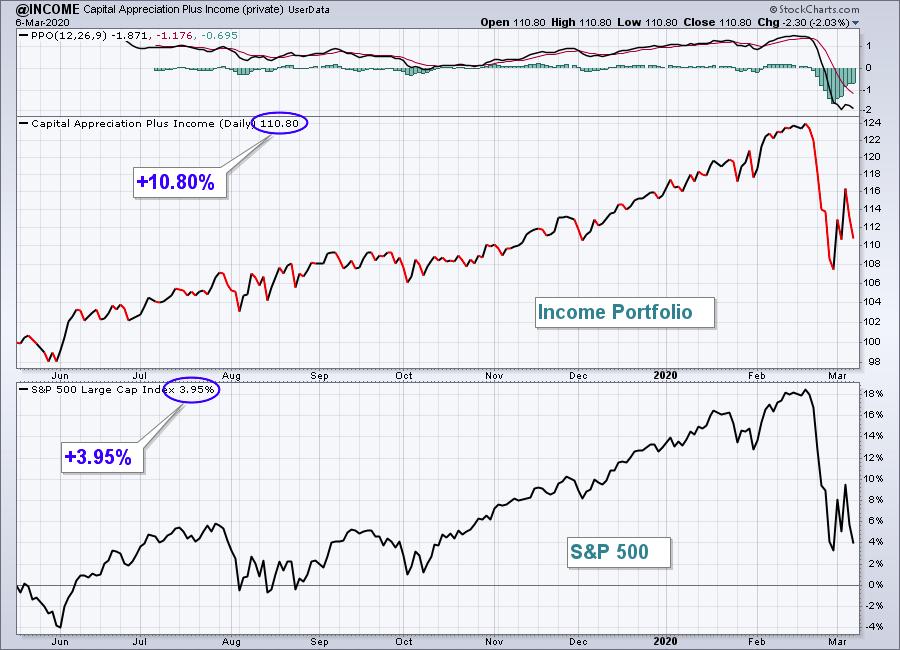
The Income portfolio has been strong and consistent throughout its existence. It was surprisingly strong last week with 7 of its 10 components easily outpacing the S&P 500.
Here are how the Income portfolio component stocks performed last week:
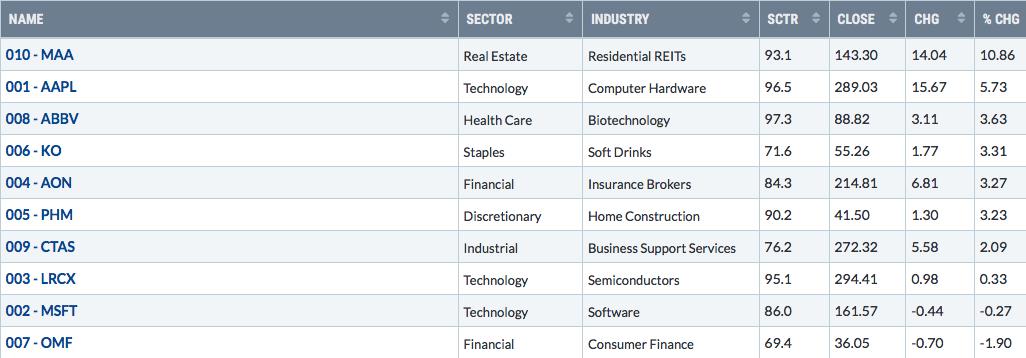
Avoiding energy (XLE) and owning just 3 stocks in the XLF, XLC, and XLY helped to contribute to the portfolio's strong performance last week. MAA rebounded strongly after printing a hammer last Friday at key price support and on heavy volume:
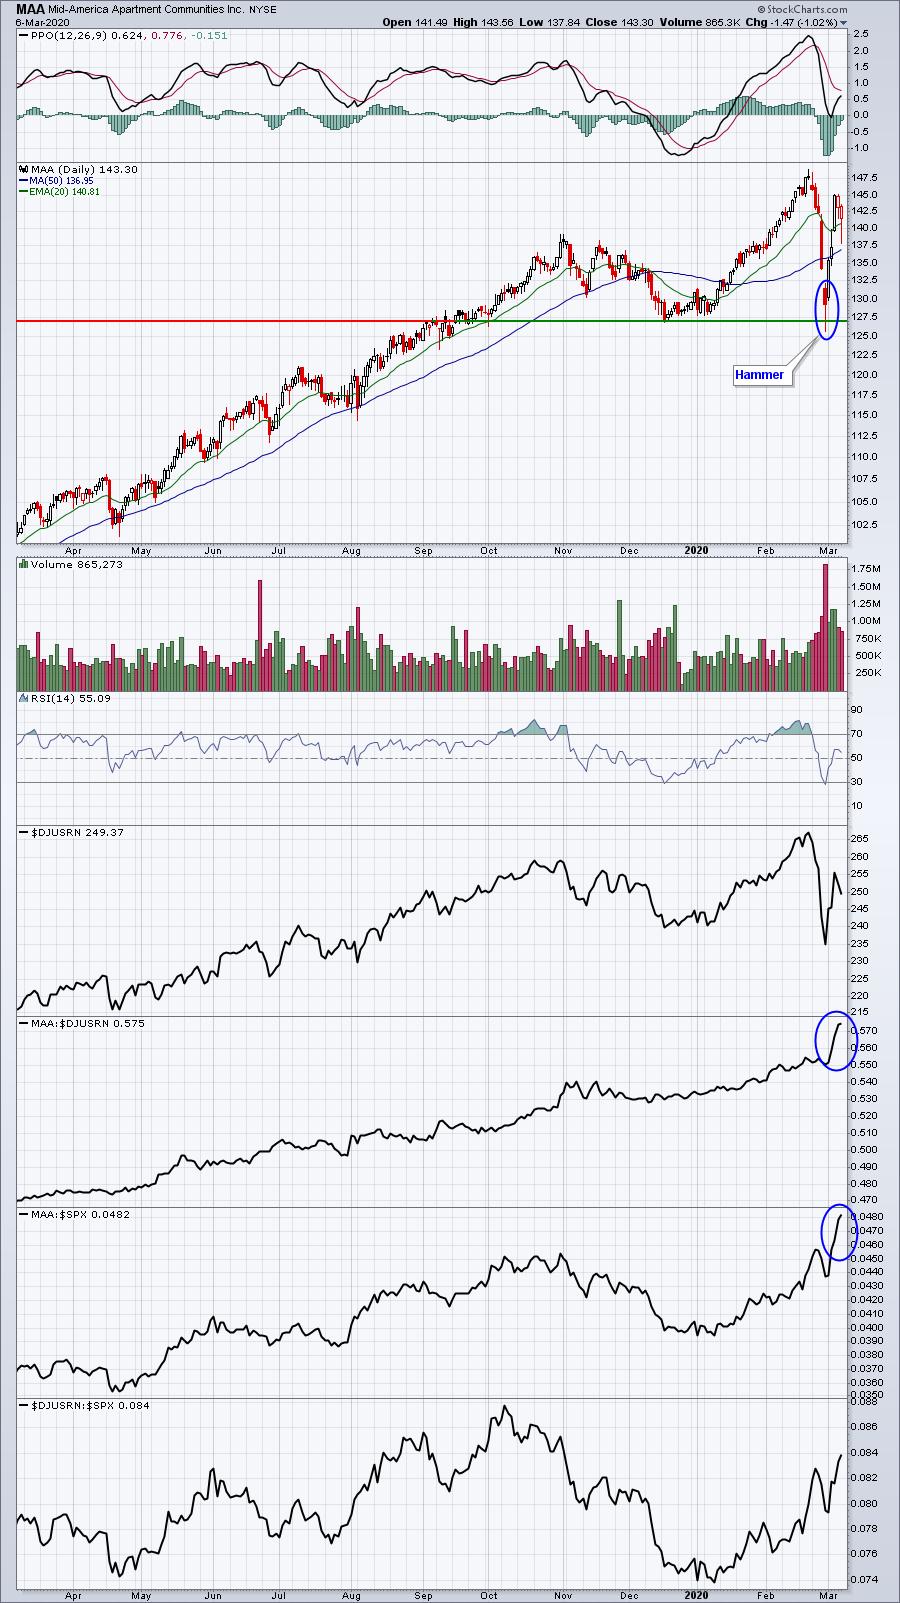
MAA's peer group tumbled in the prior week, causing a big drop in the stock. But the really encouraging part here is that MAA's relative strength vs. its peers and the benchmark S&P 500 both moved to new highs.
Character Change Portfolio:
The CC portfolio gained 0.38%, but still fell just shy of the S&P 500 rise. Here is the inception-to-date chart since November 19, 2019:
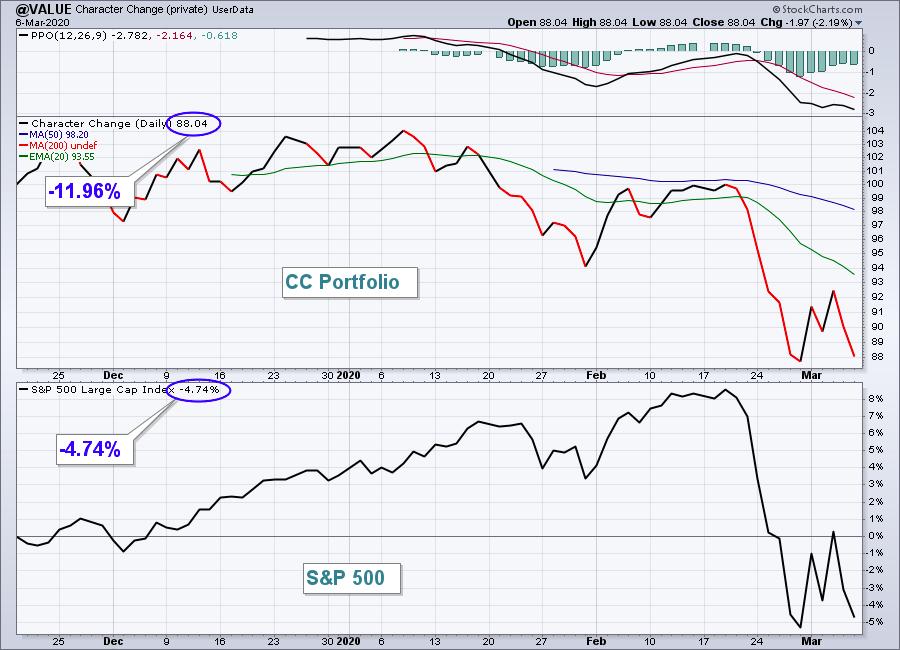
This portfolio still has a lot of ground to make up. It has held above the February low, like the S&P 500, so at least we haven't seen any further deterioration. Like the other portfolios, there was a mixture of strength and weakness among individual components.
Here are how the CC portfolio component stocks performed last week:
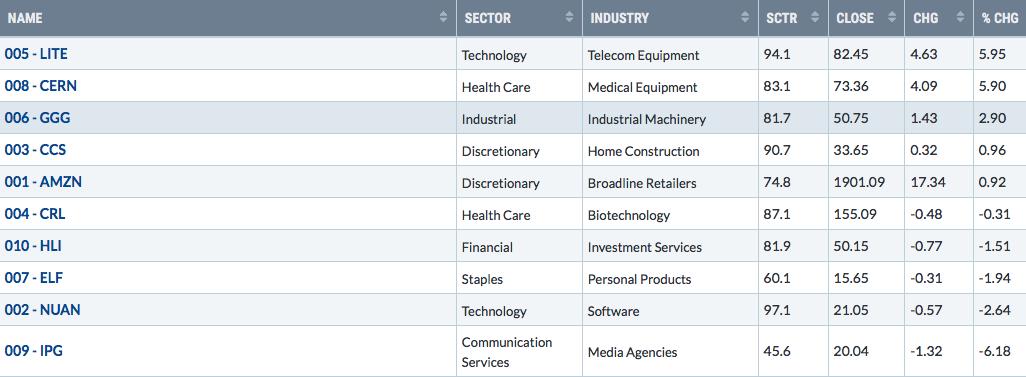
LITE rebounded strongly, living up to its SCTR score of 94. Here's the current view on one of the better looking stocks in our entire Strong Earnings ChartList (SECL):
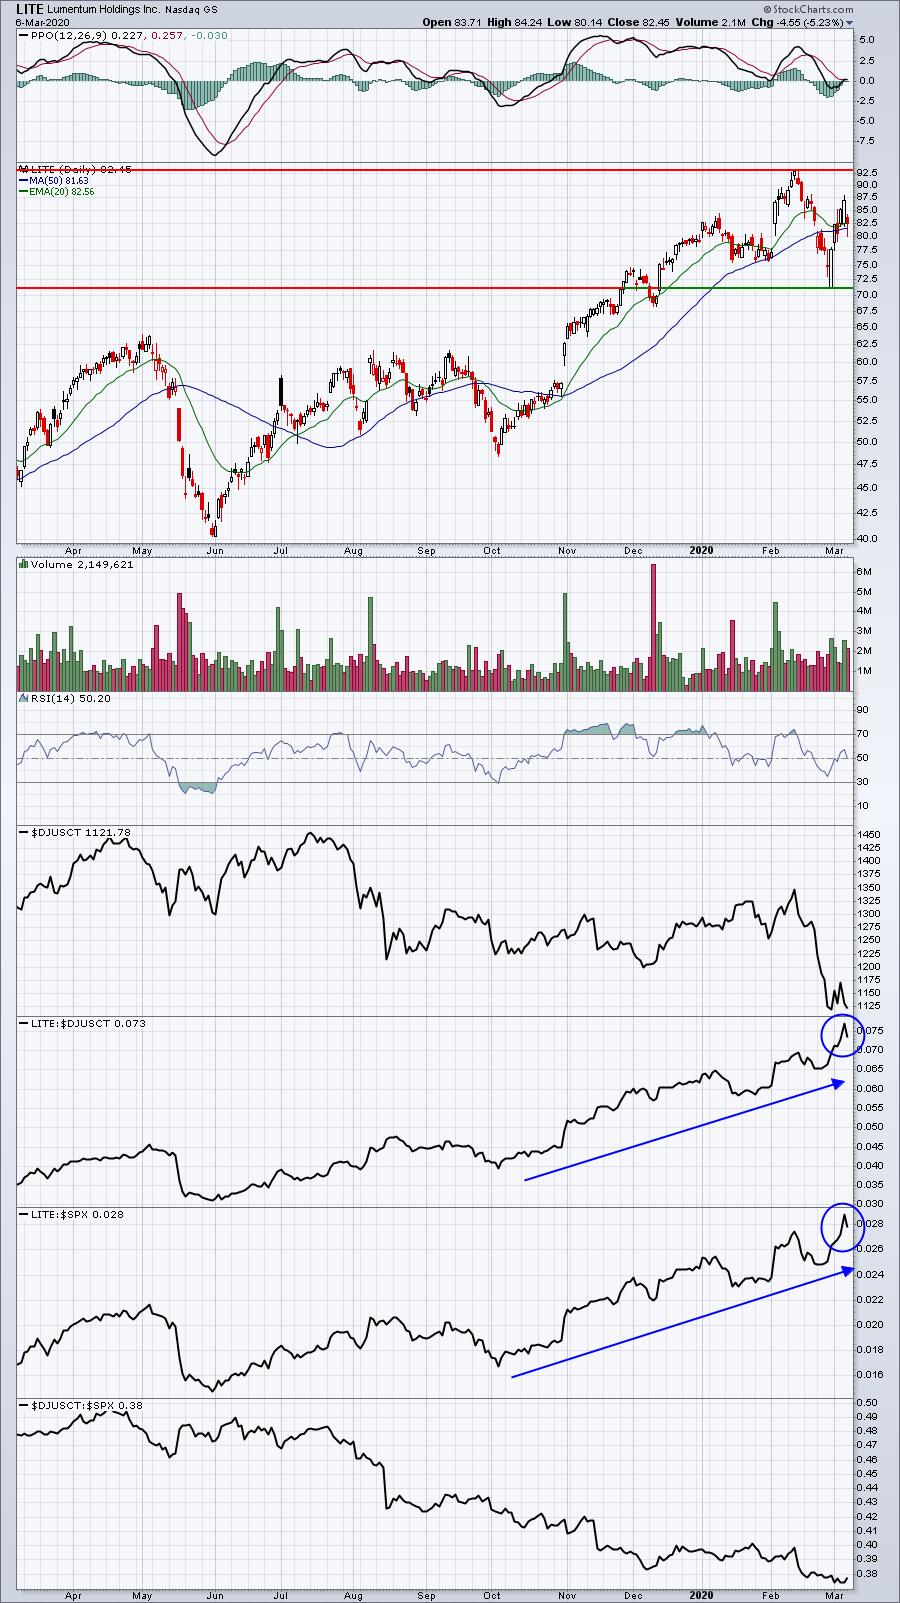
Just like MAA in the Income portfolio, LITE is showing tremendous relative strength vs. its peers and the SPX, despite being part of a very weak telecom equipment group ($DJUSCT).
Summary
I firmly believe that our secular bull market remains alive and well. You need to remember that even the 1987 crash occurred within a secular bull market. Bull markets don't mean that we go up every week. Conditions are ripe for this latest scare to eventually wind up in our rear view mirror. But there's no doubt it's going to take a strong stomach to ignore all the media hype of how bad our economy will be. The stock market is pricing in mild economic weakness at this point. It remains to be seen whether fear will manifest itself enough to send the U.S. economy into a recession. Even a recession would not point to the end of the secular bull market. We've endured several recessions during secular bull markets. But a recession, if priced in, would likely take the S&P 500 down closer to 2700. Whether we get there is anyone's guess, but when the fear is this high and the S&P 500 is losing 100 points at a time, it wouldn't take much more selling to get us there.
If I had to bet, I'd expect to see strength this week simply because we've now had two bottoms set with the Volatility Index ($VIX) at 50. Those types of readings tend to mark at least short-term bottoms.
Happy trading!
Tom Bowley, Chief Market Strategist
EarningsBeats.com
"Better timing. Better trades."