
EB Weekly Portfolio Report - Sunday, March 15, 2020
Upcoming Earnings Report
The following companies will be reporting earnings this week and each is a component of one of our portfolios:
Monday, March 16: None
Tuesday, March 17: None
Wednesday, March 18: None
Thursday, March 19: CTAS
Friday, March 20: None
PLEASE NOTE: The above companies were provided after scanning the Zacks Earnings Calendar. My research is limited to what Zacks provides and I also can make a mistake from time to time, so please check for earnings dates for all companies that you own. We do hold our portfolio stocks through one earnings report, but every EarningsBeats.com member must make their own investing/trading decisions about holding stocks into earnings reports as it's the most volatile (risky) time to own a stock.
Portfolio Rules and Objectives
Here are the common traits and objectives of each portfolio, some of these were just changed for our February 19th "draft" day last week (changes for the upcoming quarter are in bold italics):
- There are 10 leading stocks from up to 10 leading industries in each portfolio (at the time of selection) - the change here is to allow a second stock within the same industry group
- They are held for an entire 90 day period, with no stops in place - there will be NO stops. All stocks will be held for the entire period (members may choose to have stops, but we will not)
- Every stock will generally be held through ONE earnings report
- The expectation is that relative winners will carry the portfolio to outperformance
- They were all entered into as of close on February 19th
- We decided against having multiple entries for our purposes, but members were encouraged to enter based on whatever felt most comfortable
- Primary objective is to outperform the benchmark S&P 500
Here are several considerations for EB members:
- I would expect the CC (Character Change, formerly Value portfolio) and Aggressive portfolios to be the riskiest, followed by the Model portfolio, and then the Income portfolio
- The CC portfolio's strategy and composition was changed a bit in it second quarter, as we decided to include companies that have broken out of a consolidation range, not just those with breakaway gaps to end a downtrend
- The Income portfolio stocks will all pay dividends, with the expected average dividend yield to be at least 1.5%
- Drawdowns (losses) should be much milder on the Income portfolio, with more volatility expected on the other three; please review inception-to-date charts below to gain an idea of the volatility associated with each
- You should own or trade these stocks in whatever manner is most comfortable for you; while we will buy all 10 stocks in the manner identified above, feel free to trade certain stocks or wait for pullbacks if the stocks are overbought
- We have no idea what risk each member is willing or able to take. We are not registered investment advisors so be sure you understand the risk you take. Please consult your financial advisor.
- EarningsBeats.com shareholders/employees may own all or some of the portfolio stocks from time to time.
Snapshot
Here's a weekly recap:
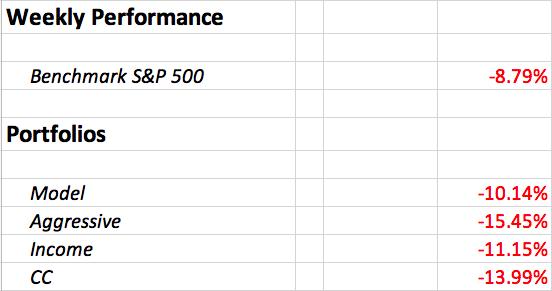
It was a bad week all around. Not only did the S&P 500 have one of its worst weeks ever, all four of our portfolios trailed the benchmark. As of Thursday's close, the Model portfolio was outperforming the S&P 500 last week. The other three trailed, but minimally. The majority of the underperformance came on Friday. While our major indices enjoyed a solid final hour on Friday, it was not indiscriminate buying - at least not like the indiscriminate selling that took place prior to that. For instance, consumer discretionary (XLY) did not rebound anywhere close to the benchmark S&P 500. Autos ($DJUSAU) and home construction ($DJUSHB) both struggled badly on a relative basis on Friday. Healthcare (XLV) was weak on a relative basis on Friday as well.
Weekly Summary
Benchmark S&P 500:
The S&P 500 traded down 8.79%, one of its worst weeks in history, and the second time in three weeks that we've seen at least an 8% weekly drop. We've now moved into bear market territory, which, by definition, is a drop of more than 20% from the high. I'm viewing it as a cyclical bear market within a secular bull market. It's yet to be seen whether we fall into a recession. That's not a slam dunk just because the stock market has dropped 20%. Q4 2018 was an example of a 20% drop without a single quarter showing negative GDP. A recession requires two consecutive such quarters.
Model Portfolio:
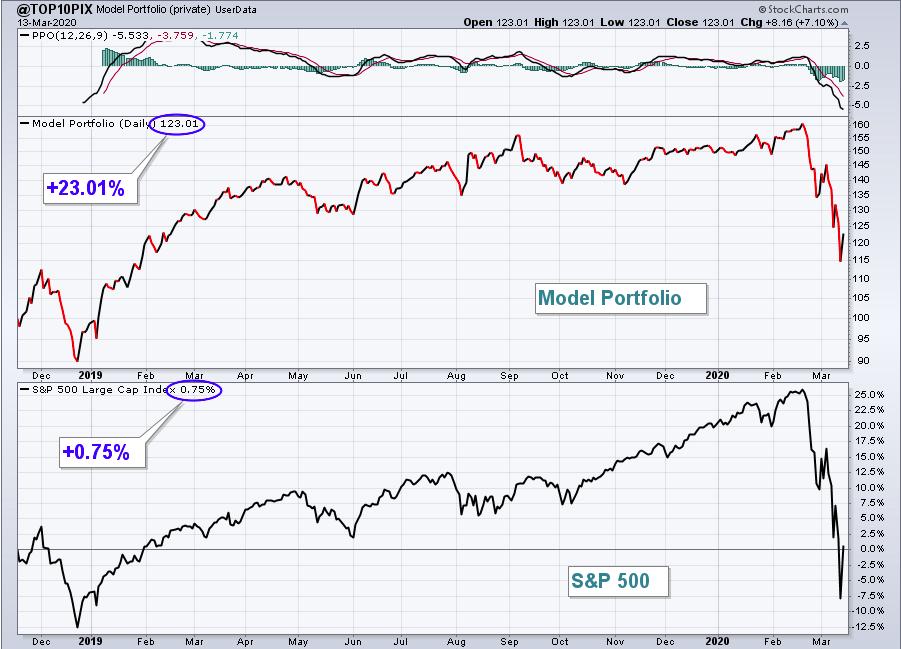
The Model portfolio tumbled 10.14%. Here's the updated inception-to-date chart of the portfolio:
Here are how the Model portfolio component stocks performed last week:
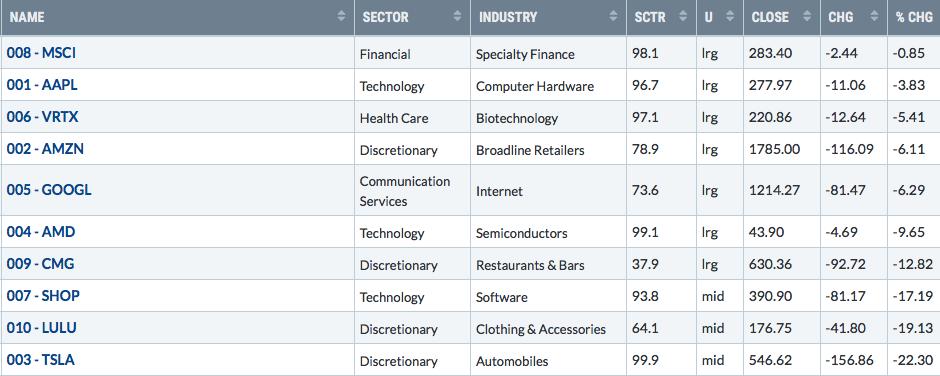
Considering that the Model portfolio owns 4 discretionary stocks, the slight relative weakness last week actually wasn't too bad. It could have been a lot worse.
Aggressive Portfolio:
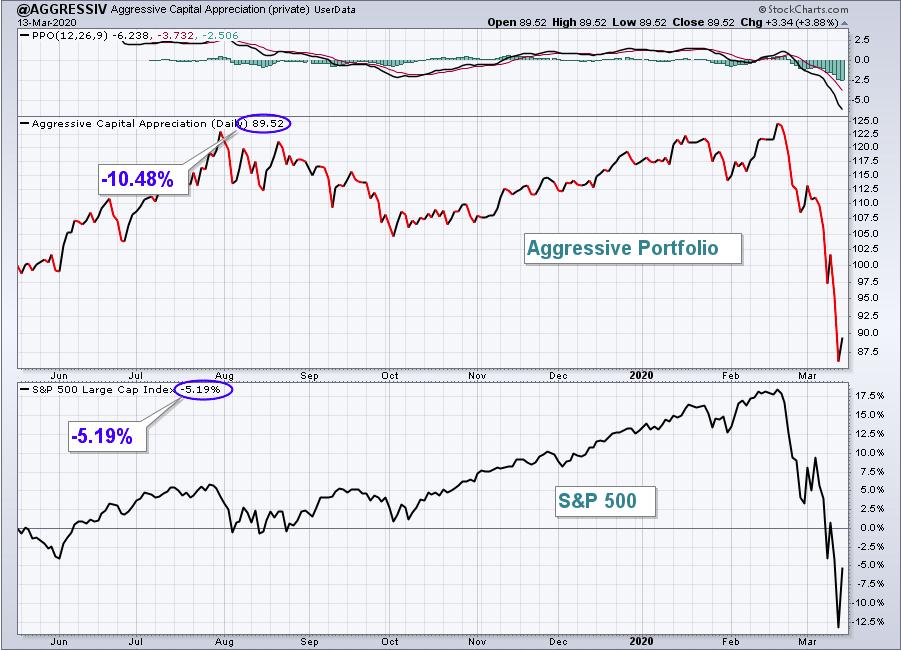
The Aggressive portfolio lost almost twice that of the S&P 500, dropping 15.45%. Here's the Aggressive portfolio chart since its inception on May 19, 2019:
Here are how the Aggressive portfolio component stocks performed last week:
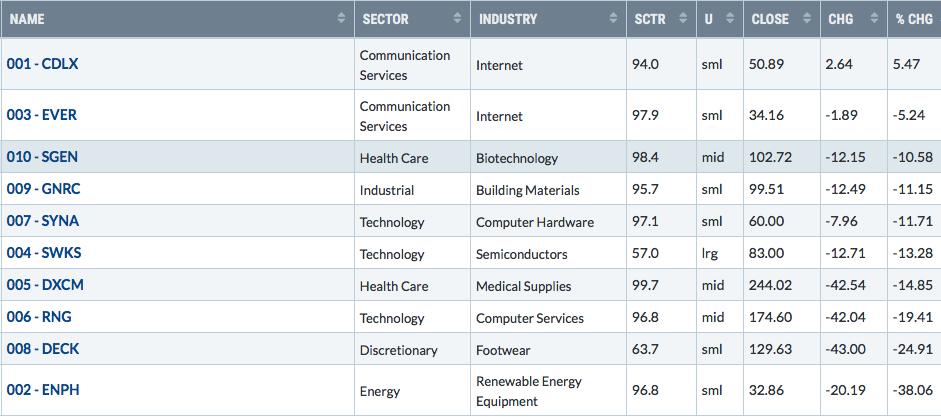
It was a very ugly week here and there were a few reasons. First, only two of the ten stocks outperformed the S&P 500 - they were the two internet stocks that had badly lagged recently. Second, two stocks - ENPH and DECK - lost a tremendous amount on a relative basis. ENPH had held up extremely well until last week, but one stock losing 38% in a week can take down a portfolio and ENPH did exactly that. I believe ENPH's long-term weekly chart remains in a solid, confirmed uptrend, but that still doesn't alter last week's pain. Finally, mid caps ($MID, -13.96%) and small caps ($SML, -16.34%) also nearly doubled the S&P 500's loss last week. The Aggressive portfolio continues to suffer from owning component stocks from these two asset classes. At some point, that will change, but for now, it's definitely a big head wind.
Income Portfolio:
The Income portfolio fell 11.15% and was unable to keep pace with the S&P 500. Here's a look at the inception-to-date chart:
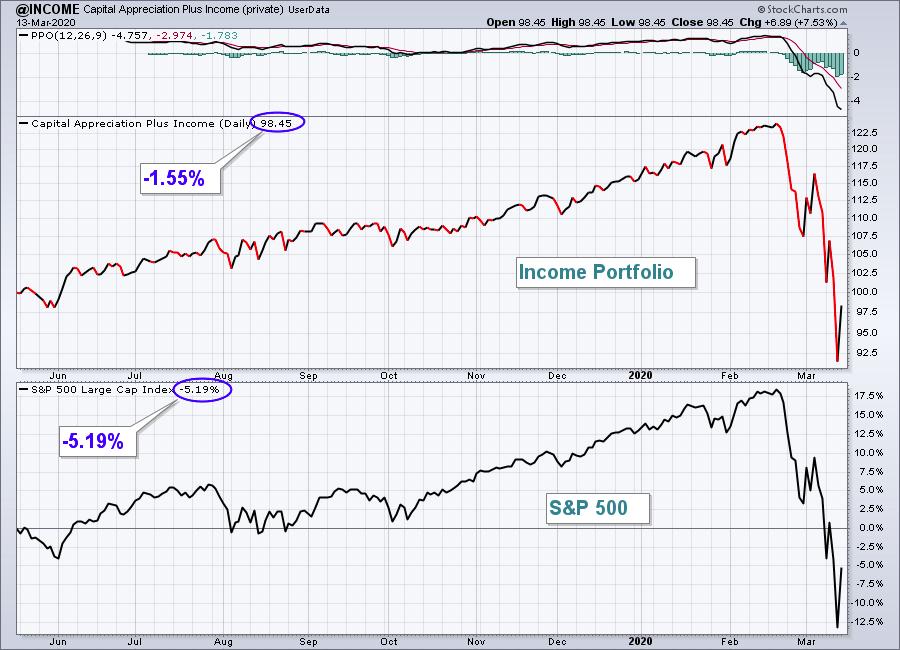
Here are how the Income portfolio component stocks performed last week:
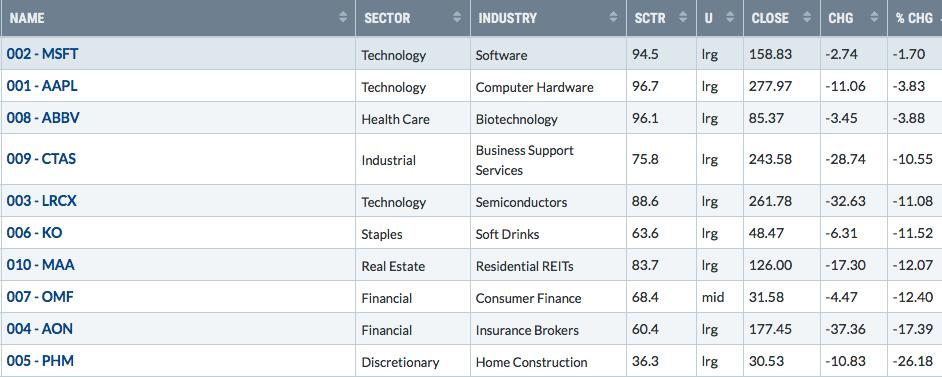
There were a few stocks that did their part to hold up the Income portfolio (MSFT, AAPL, ABBV), but home construction ($DJUSHB, -26.68%) was devastated last week and PHM suffered right along with its peers.
Character Change Portfolio:
The CC portfolio lost another 13.99% and once again underperformed the benchmark S&P 500. Here is the inception-to-date chart since November 19, 2019:
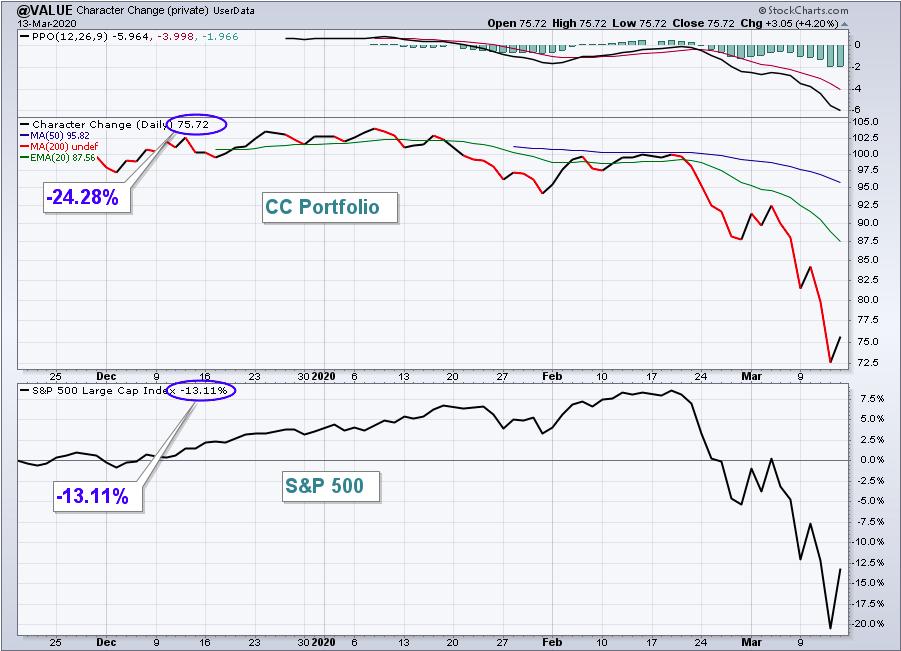
Here are how the CC portfolio component stocks performed last week:
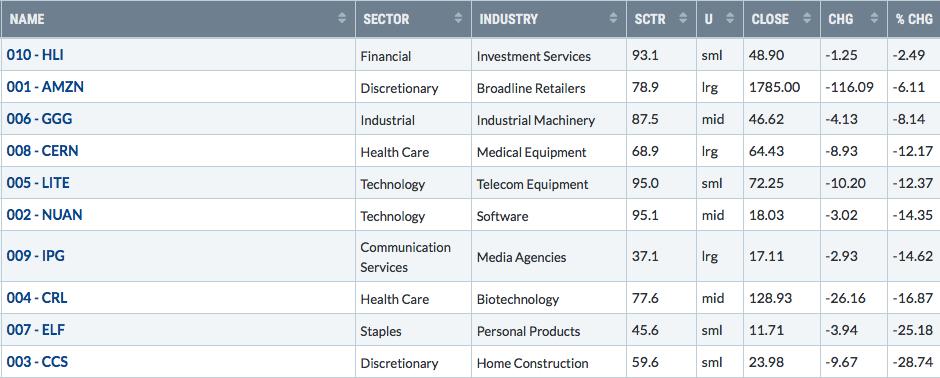
Two consumer stocks, CCS and ELF, were primarily responsible for the relative weakness of this portfolio. Like the Aggressive portfolio, there are a number of small cap and mid cap names in this portfolio and wild selling in those assets classes contributed to further weakness in our beleaguered portfolio.
Summary
It was an awful week. There's no other way to describe it. Fear spiraled out of control with the Volatility Index ($VIX) closing at 75 on Thursday, the 4th highest reading since the index was established. The other three closing readings above 75 occurred during the financial meltdown in October and November 2008. The equity only put call ratio ($CPCE) hit its second highest daily reading ever at 1.28, also on Thursday. Its 5 day SMA is at 1.03, the highest reading on record. There's a ton of panic on Wall Street right now and MAJOR lows are established when panicked readings are set. But I guess the big question is.....can extreme pessimism top the financial crisis of 2008? After all, prior to that, extreme sentiment readings were not nearly that high. So will we create a new standard for fear?
If you'd like to see a chart that shows both the extremely pessimistic VIX and CPCE readings from last week and how they measure up historically, check out my ChartWatchers article published this weekend.
I deliberately waited to send out today's report until this evening so that I could check out futures. Despite the Federal Reserve slashing the fed funds rate by 100 basis points to zero today and announcing a $700 billion quantitative easing program, futures are lock limit down with Dow futures down more than 1000 points. While Friday afternoon's rally felt great while it lasted, it doesn't appear it will last long. Instead, we'll be back dealing with what currently appears to be another big opening gap lower tomorrow morning - we've certainly had our fair share of these. Then we'll see what happens after the open. Do we see buyers as we have throughout much of this downtrend? Or does the opening weakness beget more selling?
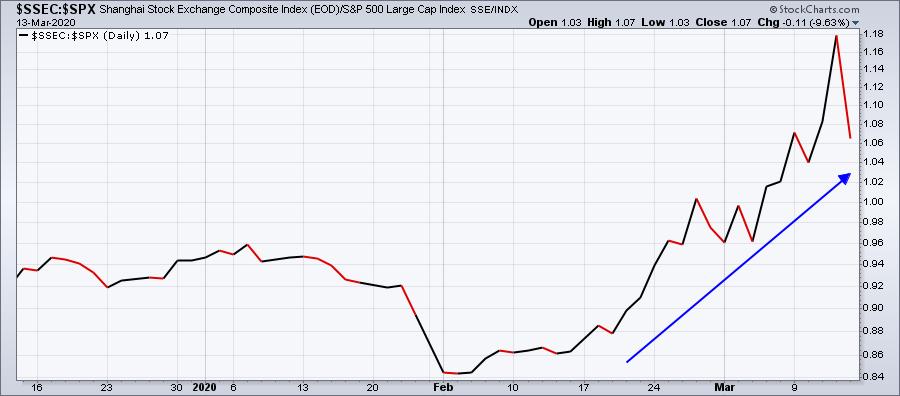
It will be another difficult week with tons of volatility I'm sure. I wouldn't be surprised at all if our financial markets are closed for 2-3 weeks to allow time for things to settle down and to try to ease the panic. China did this with quite a bit of success. In fact, and it's ironic, the coronavirus originated in China, yet China's Shanghai Composite ($SSEC) has been outperforming the S&P 500 throughout much of this crisis. As a final thought for tonight, consider the following SSEC:SPX relative chart over the past 3 months:
Happy trading!
Tom Bowley, Chief Market Strategist
EarningsBeats.com
"Better timing. Better trades."