
EB Weekly Portfolio Report - Sunday, March 22, 2020
Upcoming Earnings Report
The following companies will be reporting earnings this week and each is a component of one of our portfolios:
Monday, March 23: None
Tuesday, March 24: None
Wednesday, March 25: None
Thursday, March 26: LULU
Friday, March 27: None
PLEASE NOTE: The above companies were provided after scanning the Zacks Earnings Calendar. My research is limited to what Zacks provides and I also can make a mistake from time to time, so please check for earnings dates for all companies that you own. We do hold our portfolio stocks through one earnings report, but every EarningsBeats.com member must make their own investing/trading decisions about holding stocks into earnings reports as it's the most volatile (risky) time to own a stock.
Portfolio Rules and Objectives
Here are the common traits and objectives of each portfolio, some of these were just changed for our February 19th "draft" day last week (changes for the upcoming quarter are in bold italics):
- There are 10 leading stocks from up to 10 leading industries in each portfolio (at the time of selection) - the change here is to allow a second stock within the same industry group
- They are held for an entire 90 day period, with no stops in place - there will be NO stops. All stocks will be held for the entire period (members may choose to have stops, but we will not)
- Every stock will generally be held through ONE earnings report
- The expectation is that relative winners will carry the portfolio to outperformance
- They were all entered into as of close on February 19th
- We decided against having multiple entries for our purposes, but members were encouraged to enter based on whatever felt most comfortable
- Primary objective is to outperform the benchmark S&P 500
Here are several considerations for EB members:
- I would expect the CC (Character Change, formerly Value portfolio) and Aggressive portfolios to be the riskiest, followed by the Model portfolio, and then the Income portfolio
- The CC portfolio's strategy and composition was changed a bit in it second quarter, as we decided to include companies that have broken out of a consolidation range, not just those with breakaway gaps to end a downtrend
- The Income portfolio stocks will all pay dividends, with the expected average dividend yield to be at least 1.5%
- Drawdowns (losses) should be much milder on the Income portfolio, with more volatility expected on the other three; please review inception-to-date charts below to gain an idea of the volatility associated with each
- You should own or trade these stocks in whatever manner is most comfortable for you; while we will buy all 10 stocks in the manner identified above, feel free to trade certain stocks or wait for pullbacks if the stocks are overbought
- We have no idea what risk each member is willing or able to take. We are not registered investment advisors so be sure you understand the risk you take. Please consult your financial advisor.
- EarningsBeats.com shareholders/employees may own all or some of the portfolio stocks from time to time.
Snapshot
Here's a weekly recap:
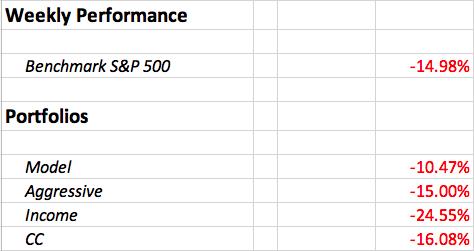
It was a truly horrific week across the board, adding to already mounting losses in 2020. The S&P 500's nearly 15% drop last week easily topped the 11.49% drop during the last week of February as the S&P 500 had its worst week since the 2008 financial crisis. All of our portfolios struggled as well, with relative outperformance in the Model portfolio, while the Income portfolio was hit hard on a relative basis for the first time in awhile.
Weekly Summary
Benchmark S&P 500:
The S&P 500 lost 14.98% last week, its worst week in a dozen years - since the financial crisis of 2008. So many areas were hit hard as efforts-to-date to limit the economic damage of the coronavirus have fallen short. It certainly appears that more dramatic steps will need to be taken to slow the spread of the disease. In the meantime, Wall Street has grown incredibly fearful with a closing VIX reading above 65 every day last week. Monday's close of 82.69 was the highest on record. Unfortunately, our financial markets are being driven by irrational behavior and panic. Until we see capitulation, it'll be very difficult to call a definitive bottom. Personally, I would have thought that VIX readings at current levels would have done the trick, but we ended the day Friday at the lowest close on the S&P 500 since February 2017.
It's very difficult to say when a bottom is in, because honestly I believe America's financial future, at least in 2020, is in the hands of our lawmakers and the American people to do whatever we need to do to slow the spread of this virus. This really isn't an exercise in technical analysis, unfortunately.
Model Portfolio:
The Model portfolio fell 10.47% which was terrible, but it did considerably outperform the benchmark- mostly due to a flat day on Friday while the S&P 500 dropped 4.34%. Here's the updated inception-to-date chart of the portfolio:
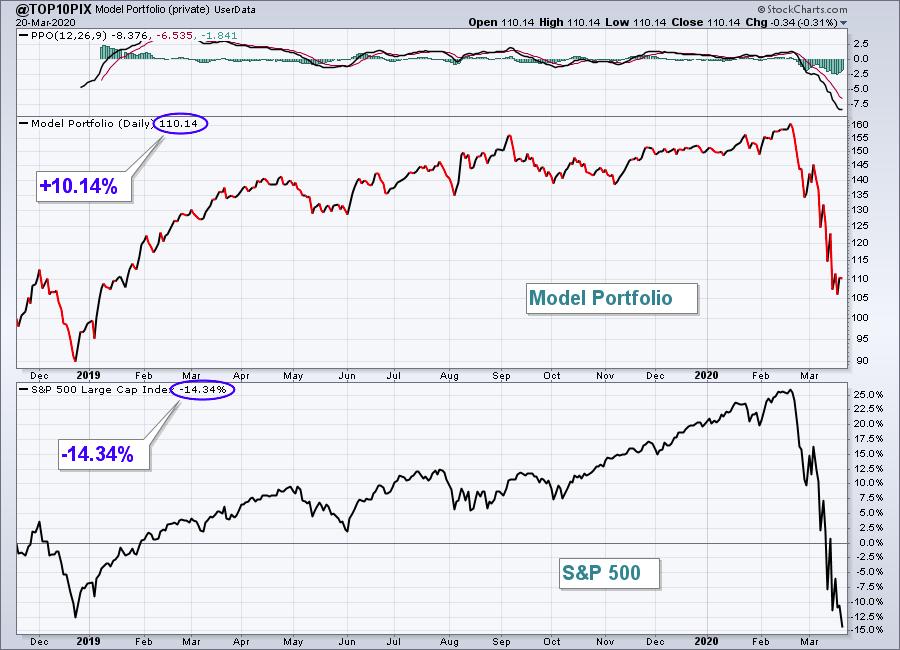
Here are how the Model portfolio component stocks performed last week:
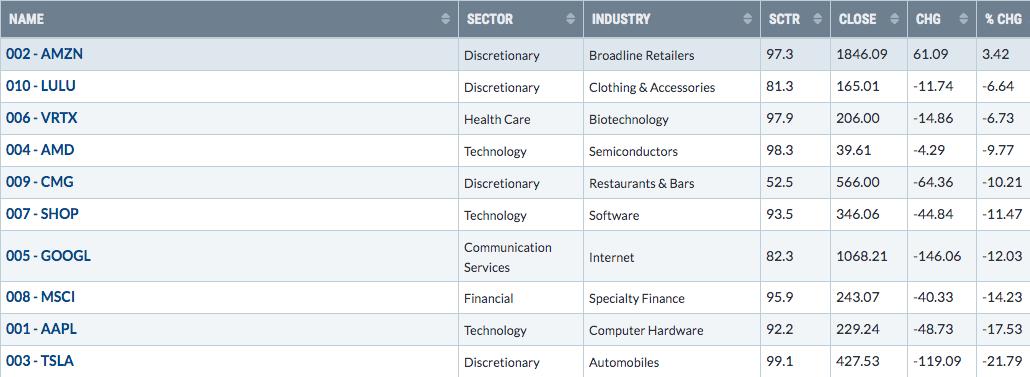
See the Summary at the bottom of this report for a brief discussion about portfolio component stocks.
Aggressive Portfolio:
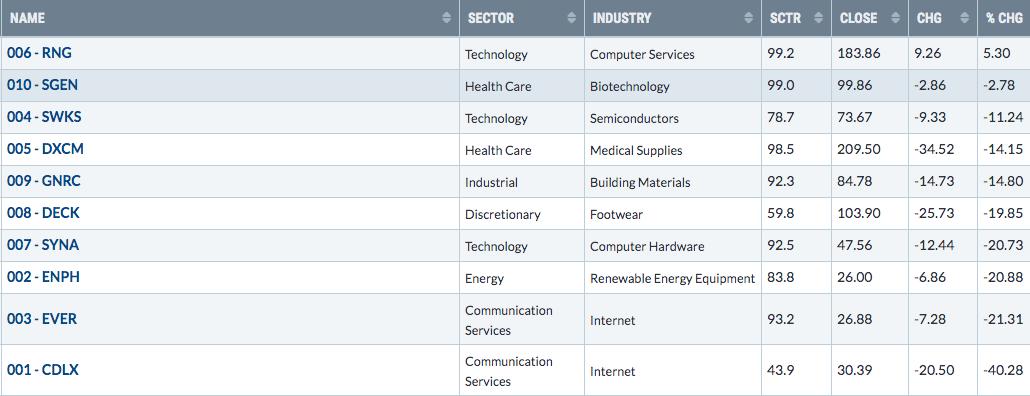
The Aggressive portfolio fell 15% last week, which was quite solid compared to the performance of the S&P 400 Mid Cap Index ($MID, -18.68%) and the S&P 600 Small Cap Index ($SML, -16.64%). Here's the Aggressive portfolio chart since its inception on May 19, 2019:
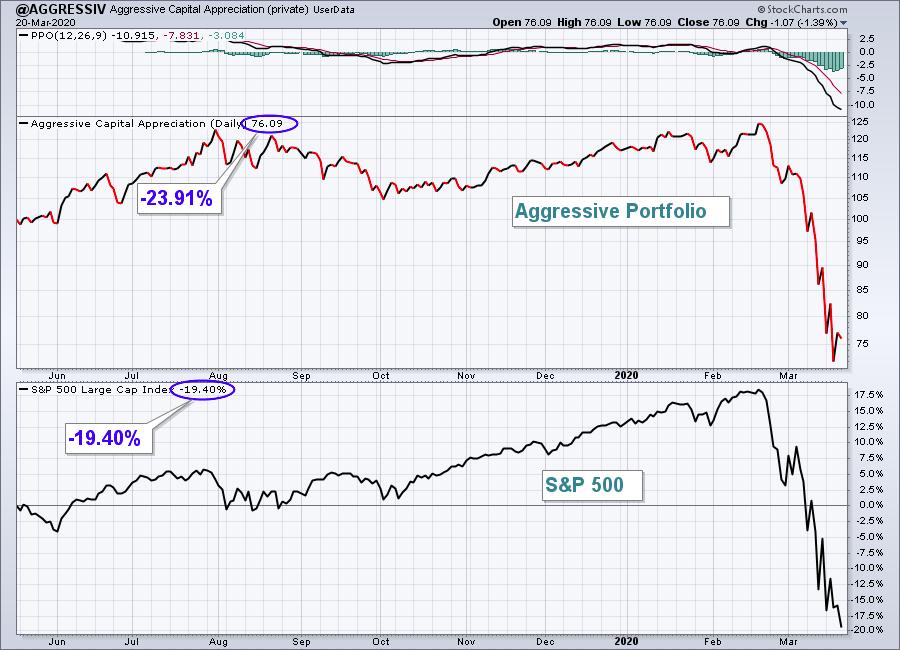
Here are how the Aggressive portfolio component stocks performed last week:
See the Summary at the bottom of this report for a brief discussion about portfolio component stocks.
Income Portfolio:
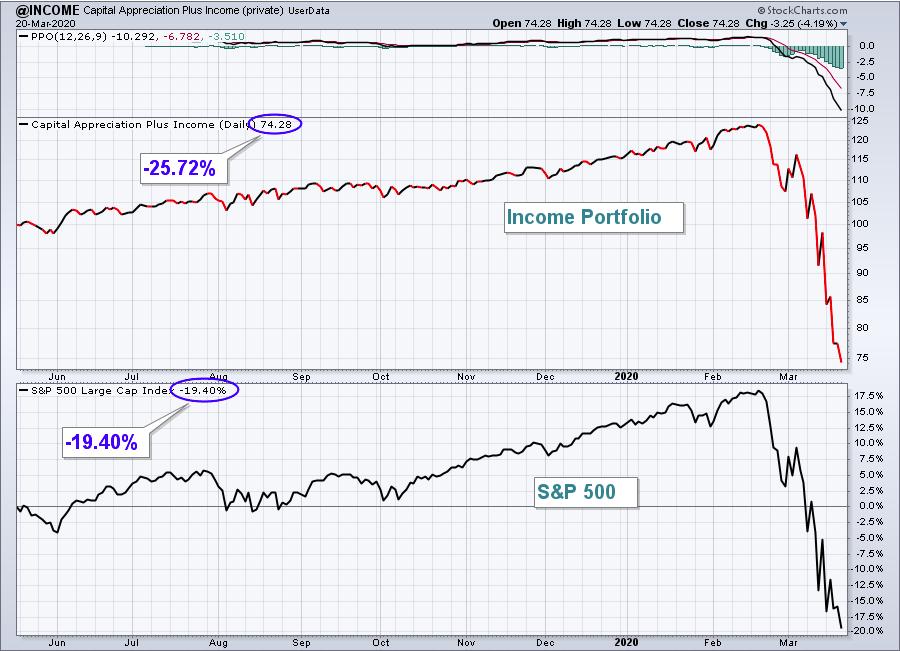
The Income portfolio had easily its worst week ever, falling a staggering 24.55%. Here's a look at the inception-to-date chart:
Here are how the Income portfolio component stocks performed last week:
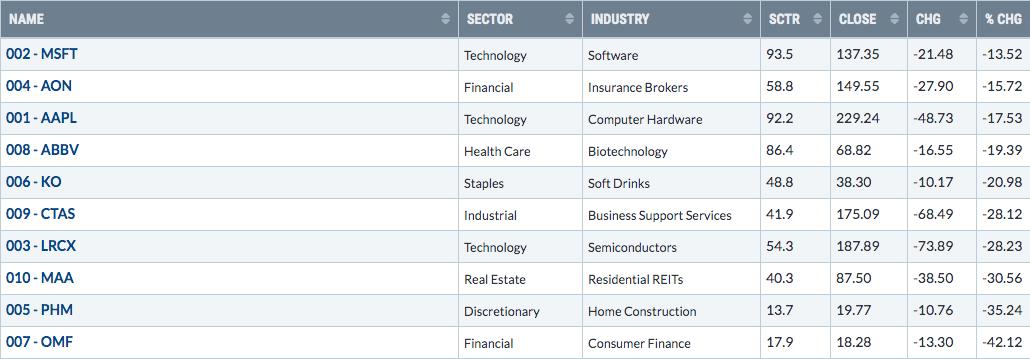
See the Summary at the bottom of this report for a brief discussion about portfolio component stocks.
Character Change Portfolio:
The CC portfolio lost 16.08%, losing a bit more than the S&P 500. Here is the inception-to-date chart since November 19, 2019:
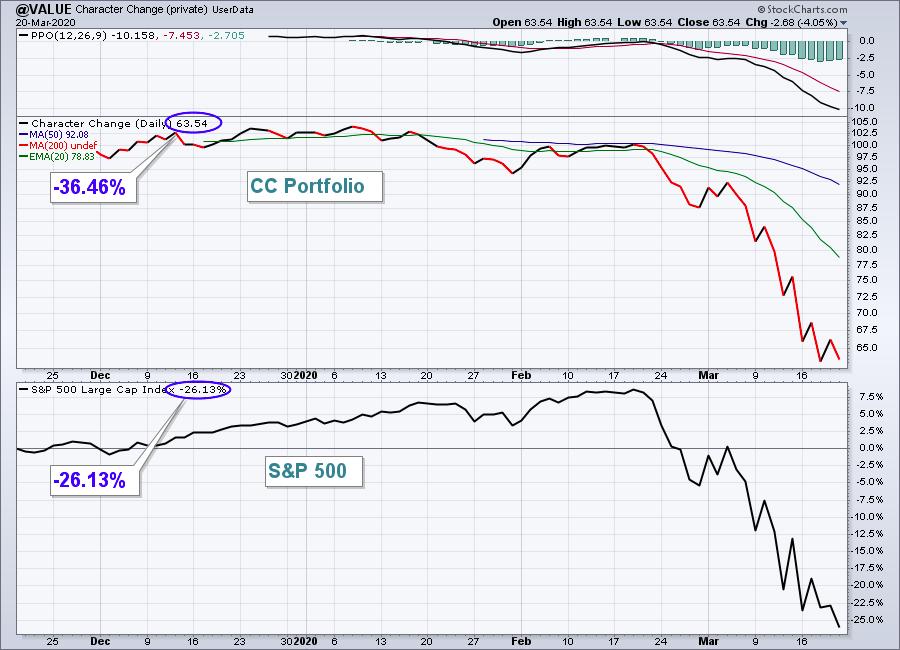
Here are how the CC portfolio component stocks performed last week:
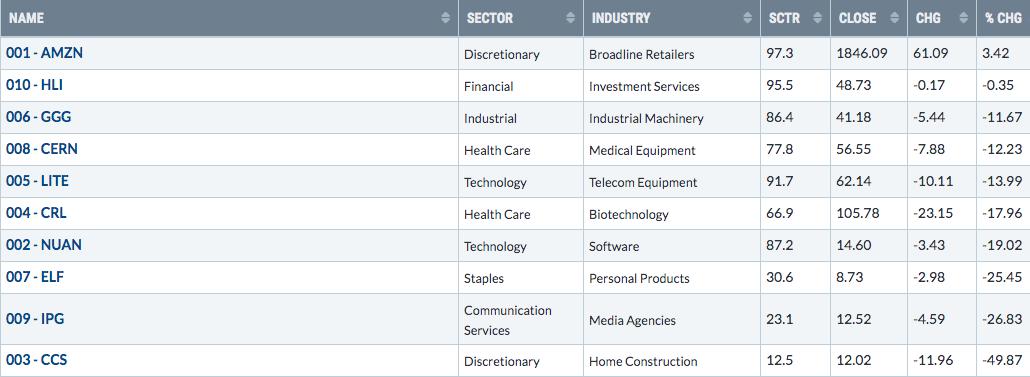
See the Summary at the bottom of this report for a brief discussion about portfolio component stocks.
Summary
It was another very damaging week with weakness across every index, every sector. The destruction certainly varied as consumer staples (XLP, -10.97%) and real estate (XLRE, -23.08%) were the best and worst performing sectors last week and you can see that they were separated by more than 12 percentage points. In terms of industry groups, truckers ($DJUSTK, +0.39%) were the only industry group that advanced last week AND had a SCTR score above 50. The other groups that advanced, led by tires ($DJUSTR, +11.56%) and gambling ($DJUSCA, +9.56%), represented areas of the market that have been devastated recently and, quite honestly, probably represented market maker involvement paving the way to higher prices into options expiration.
So what will next week hold? Well, I waited to send out this weekend's report so that I could check out futures. They're not good. They temporarily touched "lock limit" down of 5%, but have since rallied a bit. Currently, they're trading close to 4% down. As far as the outlook ahead for this week, it remains very uncertain. It's difficult to see the stock market with any clarity when we have no idea as to the ultimate impact of the coronavirus.
While our strategy at EarningsBeats.com is to seek out the best companies in terms of both technical and fundamental considerations (ie, relative strength, bullish technical patterns, better than expected revenues and EPS, etc), the stock market is really not paying much attention to those characteristics, especially earnings. In fact, we've seen a countless number of companies withdraw guidance and they're doing so because they literally have no idea what to expect. Not from the government. And certainly not from the consumer. Initial jobless claims this week will skyrocket and the numbers over the next several weeks will be staggering. The stock market is pricing in a TON of bad news. What the stock market needs right now is more clarity, even if it means horrific news. We can and will pick up the pieces, but how many pieces will there be?
While a long-term investing strategy is just that - a long-term investing strategy, traders must remain extremely nimble with an emphasis on cash. Thus far, the futures are reminding us of what we've seen now for a month - that traders do not want to be long overnight. Therefore, we'll need to pick our spots for trading purposes and be willing to take smaller losses quickly, if necessary.
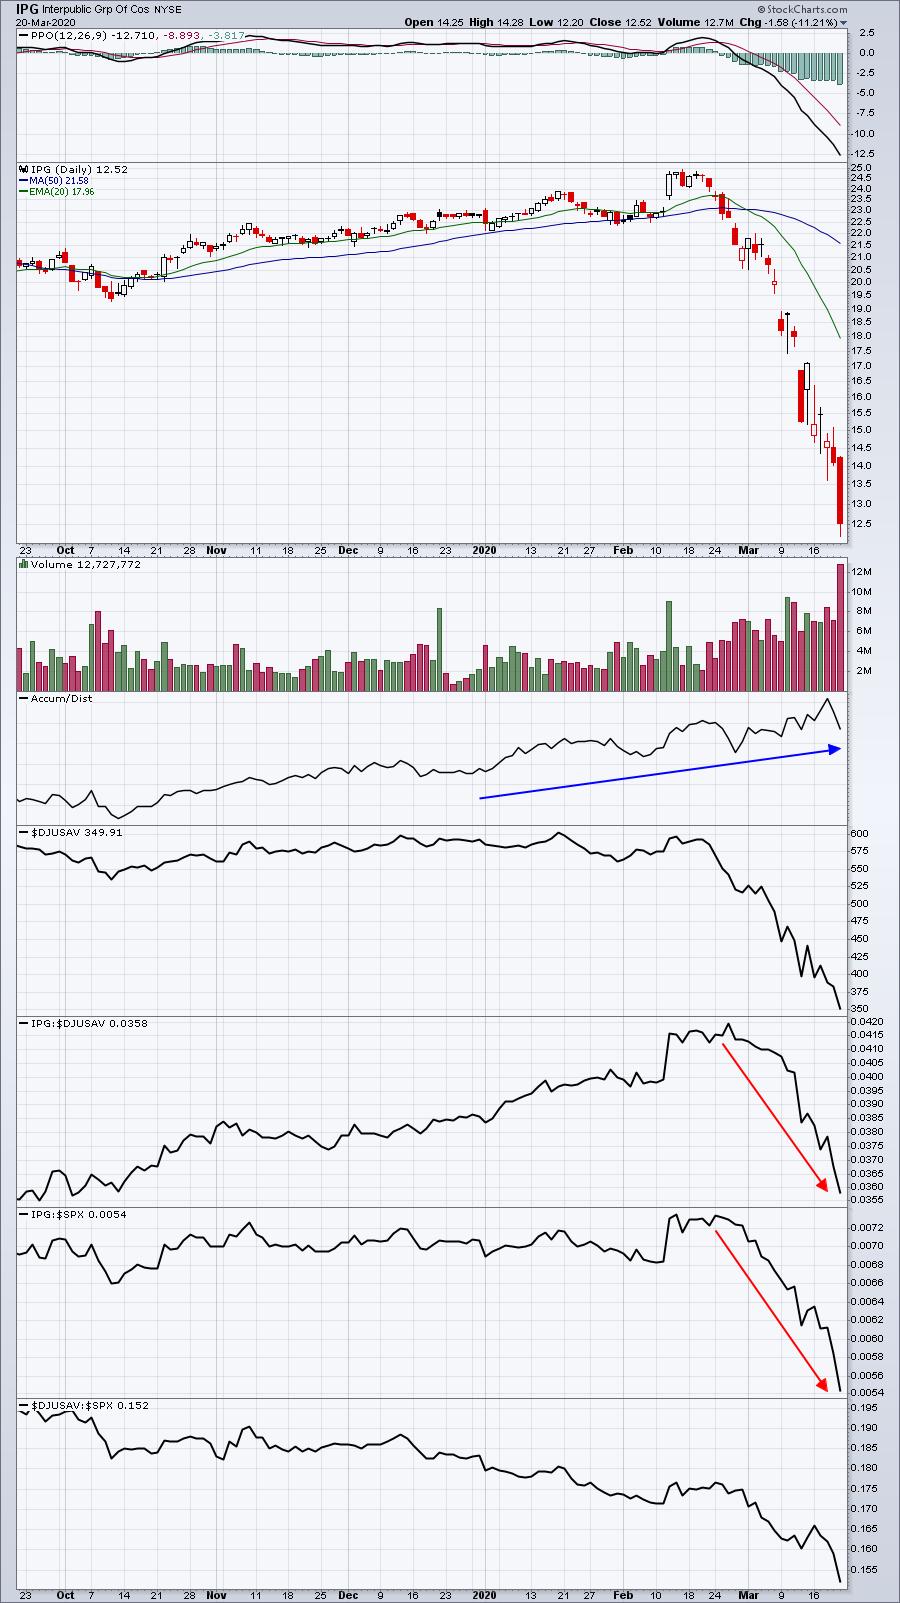
Lately, I've been discussing a technical indicator that I believe can be very useful in the current market environment. It's the accumulation/distribution line ("AD Line"). It measures the true amount of buying and selling pressure during the trading day. It ignores these massive gaps at the opening bell and focuses exclusively on what happens throughout the trading day. When the AD Line is rising while prices are falling, it's a form of a positive divergence and CAN suggest a reversal ahead. In the current market environment, it might not be a reversal, it might simply result in relative strength. So I've been looking for stocks showing those two things: (1) relative strength vs. its peers and the S&P 500 and (2) a rising AD Line.
When I looked through the stocks in our 4 portfolios, these are the names that I'll be looking to trade based on those two criteria I just listed:
Model portfolio: LULU, AMD, VRTX, MSCI, AAPL, GOOGL, AMZN
Income portfolio: MSFT, AAPL
Aggressive portfolio: RNG, SGEN, DXCM, EVER, GNRC
CC portfolio: AMZN, HLI, LITE, GGG, CERN
I want to make sure that BOTH criteria are met. For instance, IPG (CC portfolio) shows tremendous strength on the AD Line, but its relative strength vs. its peers is awful. It's difficult to argue a stock is being accumulated when it can't even keep up with its peers. As an example, look at the chart:
But if we look at AMD (Model portfolio), I think you'll see a much different picture:
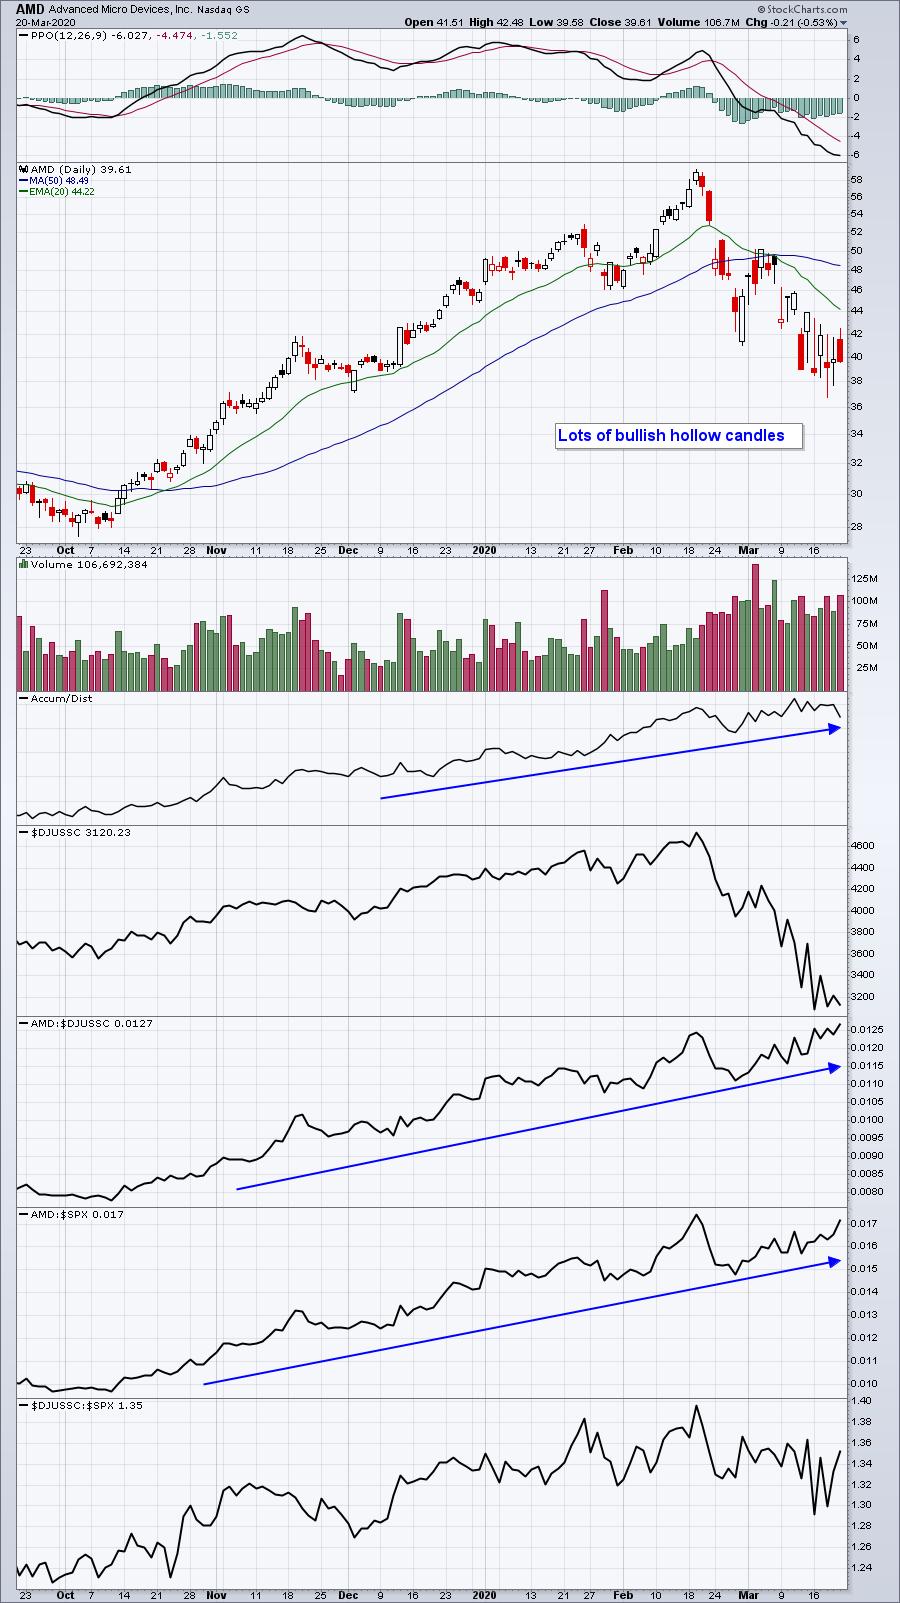
Yes, AMD is moving lower, but we see few red "filled" candles. Filled candles indicate that a stock closes below its open. In other words, there's distribution throughout the trading day. Hollow candles, however, represent days where AMD closes above its open. That gives me more comfort to try to trade the stock during the trading day. Holding stocks overnight has been the biggest problem by far. Until that changes, if you're a trader, I think you have to really think about holding at the close.
Happy trading!
Tom Bowley, Chief Market Strategist
EarningsBeats.com
"Better timing. Better trades."