
EB Weekly Portfolio Report - March 29, 2020
Upcoming Earnings Report
The following companies will be reporting earnings this week and each is a component of one of our portfolios:
Monday, March 30: None
Tuesday, March 31: None
Wednesday, April 1: None
Thursday, April 2: None
Friday, April 3: None
PLEASE NOTE: The above companies were provided after scanning the Zacks Earnings Calendar. My research is limited to what Zacks provides and I also can make a mistake from time to time, so please check for earnings dates for all companies that you own. We do hold our portfolio stocks through one earnings report, but every EarningsBeats.com member must make their own investing/trading decisions about holding stocks into earnings reports as it's the most volatile (risky) time to own a stock.
Portfolio Rules and Objectives
Here are the common traits and objectives of each portfolio, some of these were just changed for our February 19th "draft" day last week (changes for the upcoming quarter are in bold italics):
- There are 10 leading stocks from up to 10 leading industries in each portfolio (at the time of selection) - the change here is to allow a second stock within the same industry group
- They are held for an entire 90 day period, with no stops in place - there will be NO stops. All stocks will be held for the entire period (members may choose to have stops, but we will not)
- Every stock will generally be held through ONE earnings report
- The expectation is that relative winners will carry the portfolio to outperformance
- They were all entered into as of close on February 19th
- We decided against having multiple entries for our purposes, but members were encouraged to enter based on whatever felt most comfortable
- Primary objective is to outperform the benchmark S&P 500
Here are several considerations for EB members:
- I would expect the CC (Character Change, formerly Value portfolio) and Aggressive portfolios to be the riskiest, followed by the Model portfolio, and then the Income portfolio
- The CC portfolio's strategy and composition was changed a bit in it second quarter, as we decided to include companies that have broken out of a consolidation range, not just those with breakaway gaps to end a downtrend
- The Income portfolio stocks will all pay dividends, with the expected average dividend yield to be at least 1.5%
- Drawdowns (losses) should be much milder on the Income portfolio, with more volatility expected on the other three; please review inception-to-date charts below to gain an idea of the volatility associated with each
- You should own or trade these stocks in whatever manner is most comfortable for you; while we will buy all 10 stocks in the manner identified above, feel free to trade certain stocks or wait for pullbacks if the stocks are overbought
- We have no idea what risk each member is willing or able to take. We are not registered investment advisors so be sure you understand the risk you take. Please consult your financial advisor.
- EarningsBeats.com shareholders/employees may own all or some of the portfolio stocks from time to time.
Snapshot
Here's a weekly recap:
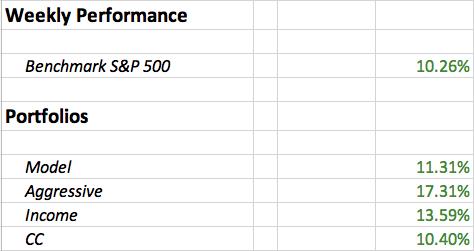
The S&P 500 finally found a tradable bottom and snapped back like a rubber band last week, surging 10.26%. Despite that rally, however, the S&P 500 still hasn't even reached the first Fibonacci retracement level at 38.2%:
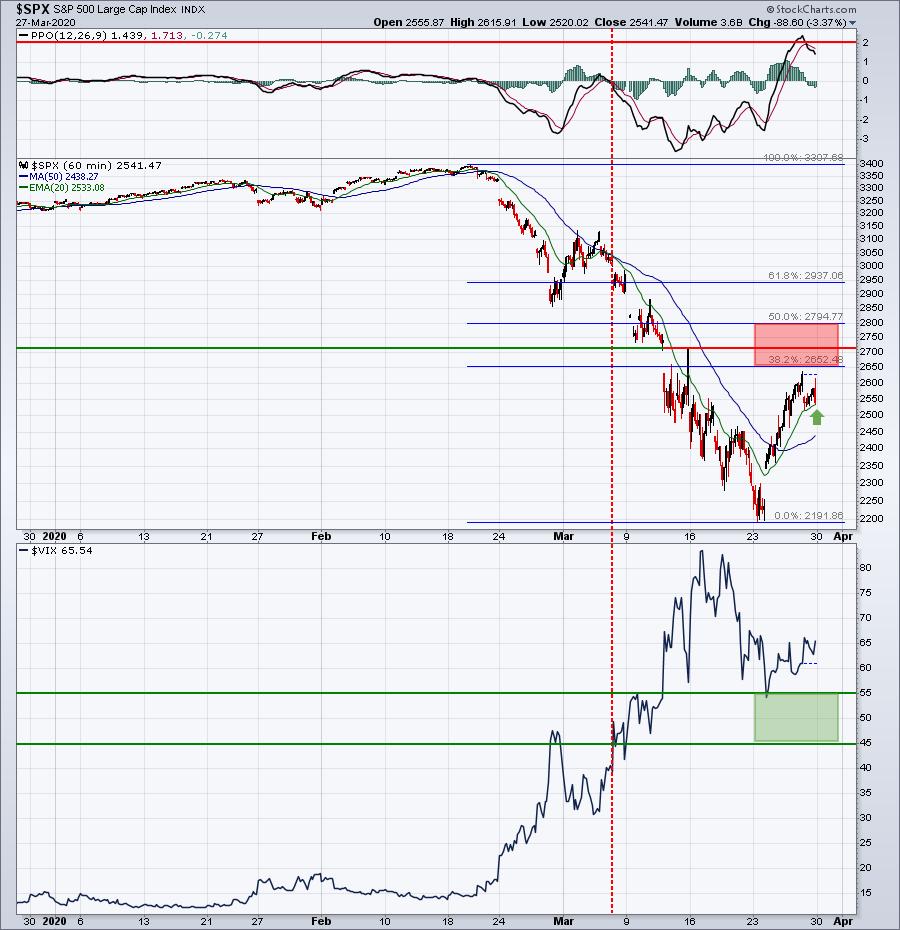
I wouldn't begin to even contemplate that a confirmed bottom is in place until we clear the Fibonacci 50% retracement level (red-shaded area) and see the Volatility Index ($VIX) fall back below 45 (green-shaded area). I would expect that we'll see a retest of the prior price low before that area of price resistance and VIX support is cleared.
Weekly Summary
Benchmark S&P 500:
The S&P 500 had a very solid week, as illustrated above, rising 10.26% on the week. Obviously, we have to keep perspective in place. It was a nice bounce after a devastating month of declining prices.
Model Portfolio:
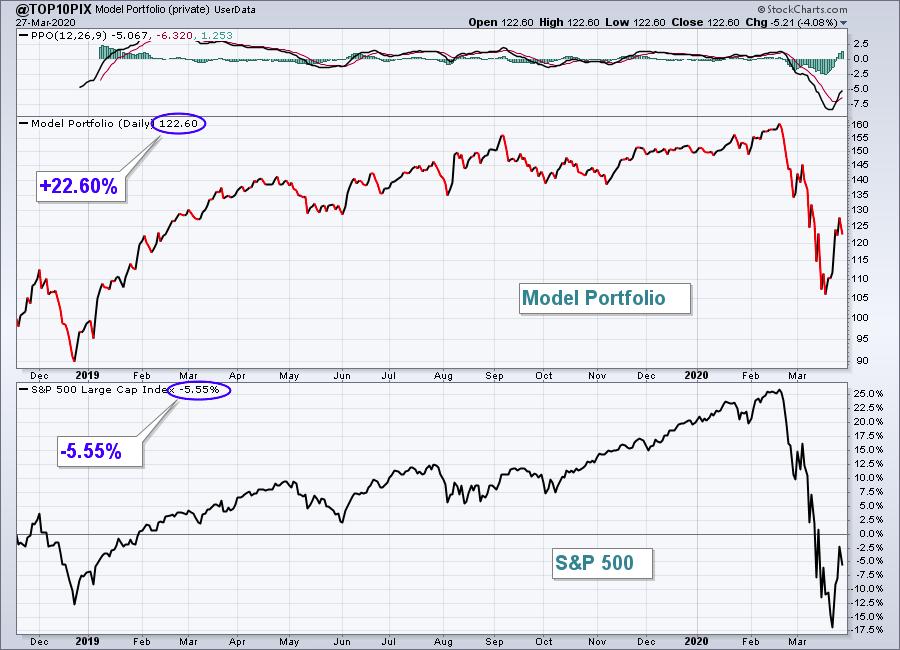
The Model portfolio gained 11.31%, outpacing the benchmark S&P 500. Here's the updated inception-to-date chart of the portfolio:
Here are how the Model portfolio component stocks performed last week:
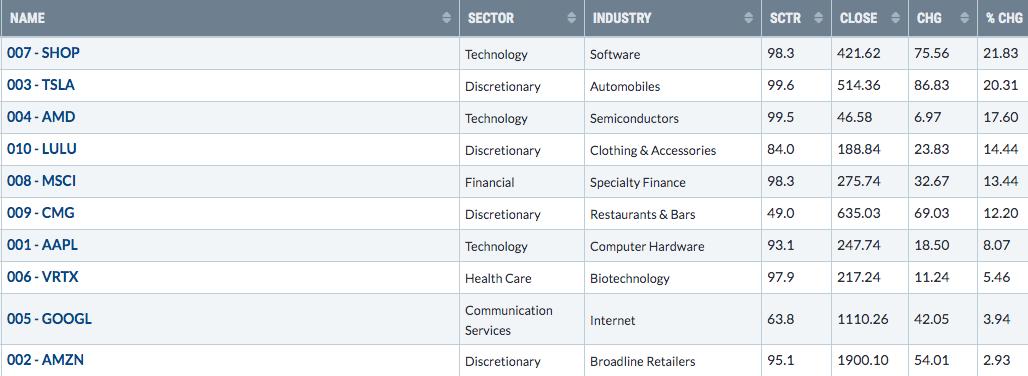
One encouraging sign for the stocks in the Model portfolio is that all but one (CMG) still have SCTR scores above 50. 7 of those has SCTR scores in the 90s.
Aggressive Portfolio:
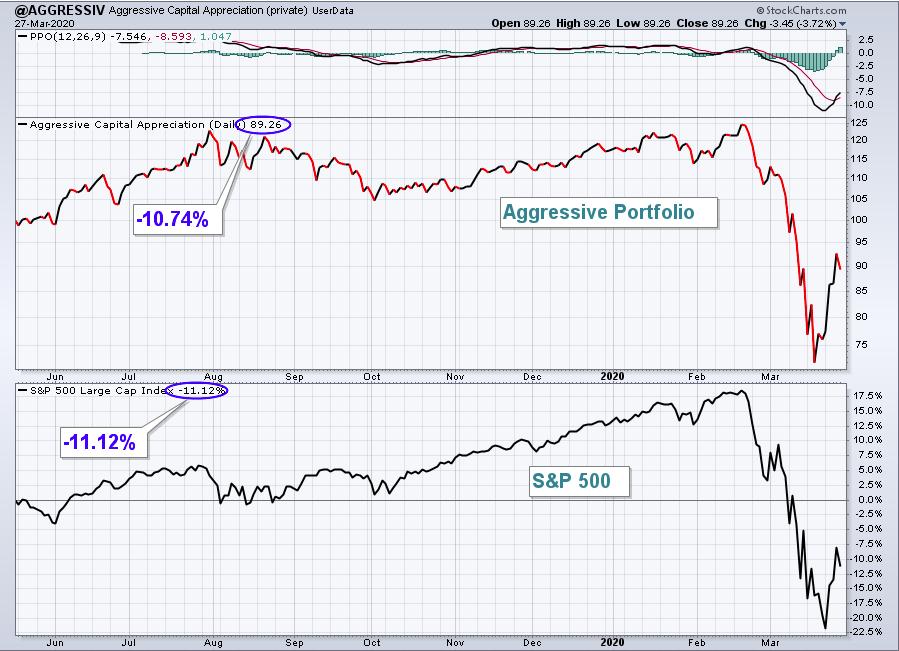
The Aggressive portfolio rebounded strongly, gaining 17.31%. Here's the Aggressive portfolio chart since its inception on May 19, 2019:
Here are how the Aggressive portfolio component stocks performed last week:
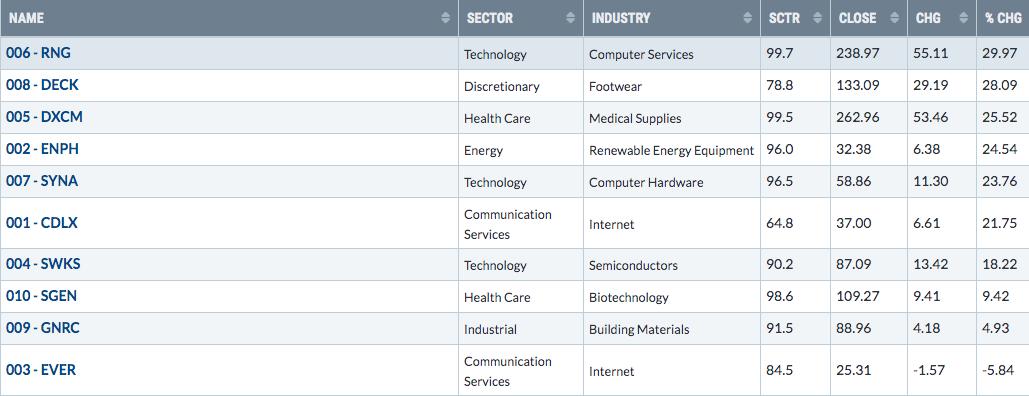
6 of the 10 component stocks gained more than 20%, or more than doubled the S&P 500 return from last week. That was nice to see, but with future earnings guidance so murky, it's simply impossible to have confidence that any degree of outperformance will continue.
Income Portfolio:
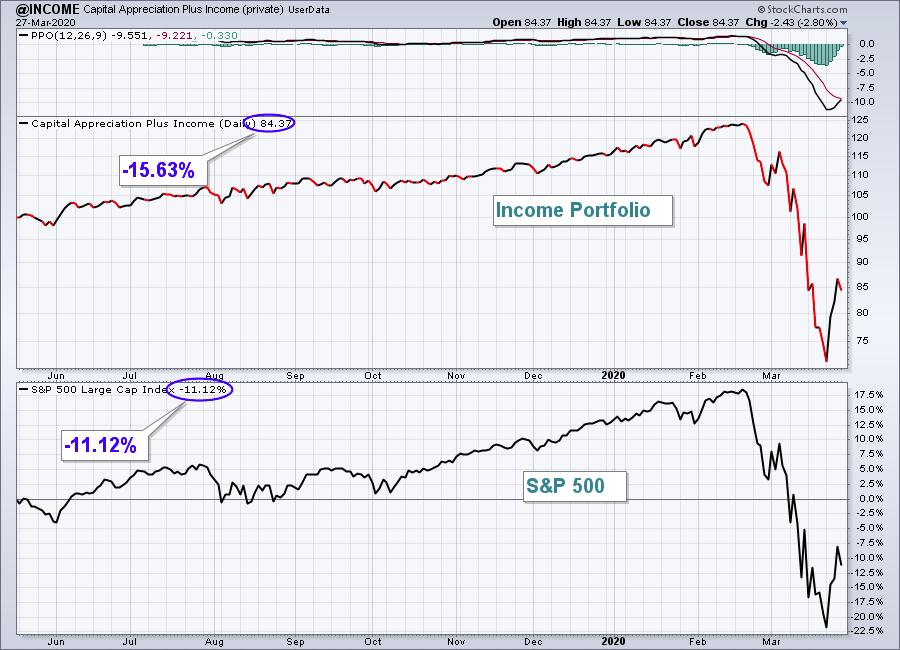
The Income portfolio also had a strong week, jumping 13.59%. Here's a look at the inception-to-date chart:
Here are how the Income portfolio component stocks performed last week:
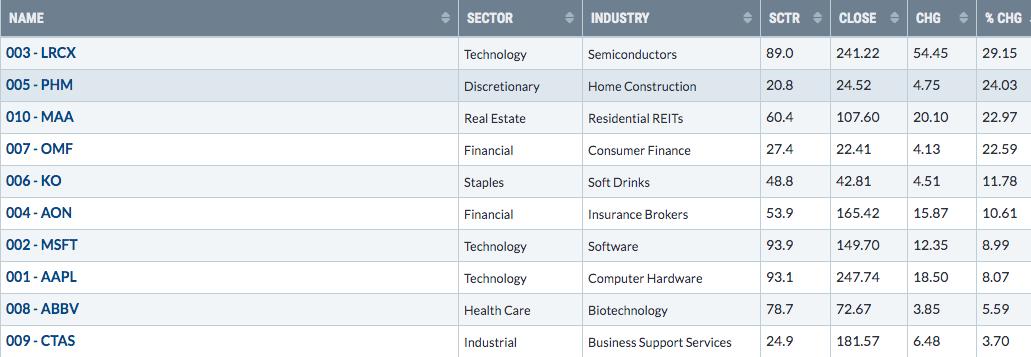
Again, there were several component stocks that outperformed the benchmark by a wide margin, lifting the entire portfolio up for the week.
Character Change Portfolio:
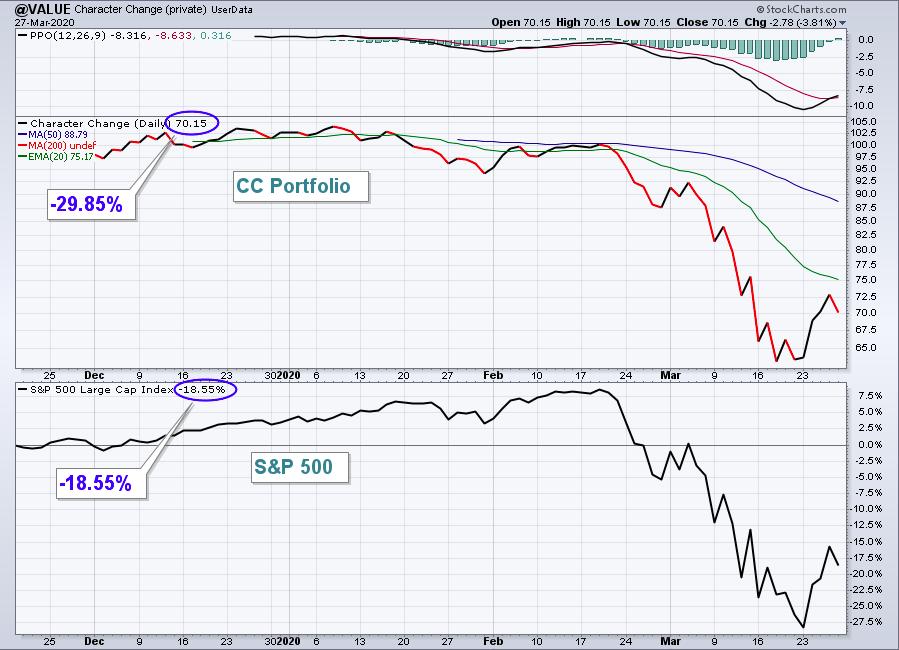
The CC portfolio barely outgained the S&P 500, rising 10.40%. Here is the inception-to-date chart since November 19, 2019:
Here are how the CC portfolio component stocks performed last week:
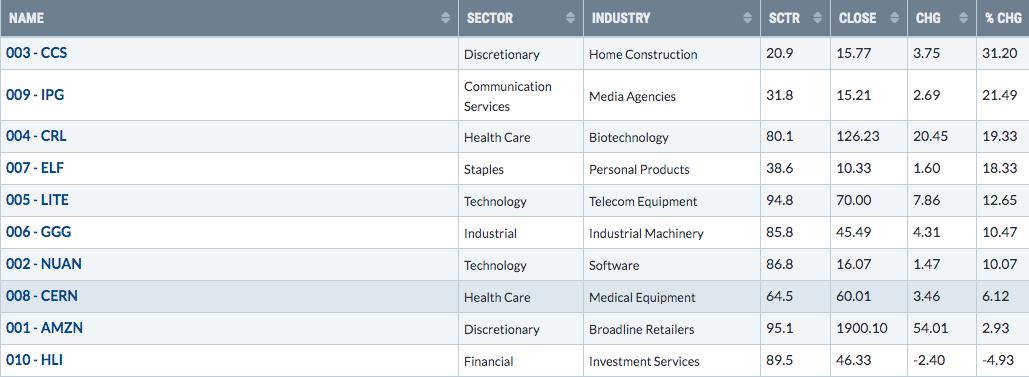
Home construction ($DJUSHB) rallied 21% and was the 12th best performing industry group last week. Among home construction stocks, CCS rebounded more than most of its peers and that certainly aided our CC portfolio.
Summary
There was a collective sigh of relief last week as many stocks, industries, sectors and key indices finally rebounded for more than just a day. We saw sustained buying for three consecutive days, although late day selling on Friday did cut into even more substantial weekly gains and dampen the enthusiasm. The U.S. stock market's biggest problem right now - and global markets for that matter - is that no one has any clue how the coronavirus will ultimately play out. There are so many possibilities with the end economic result quite different in each. Uncertainty on Wall Street leads to fear, and right now that fear has translated into some of the highest Volatility Index (VIX) readings on record.
I am not a health expert, but I'd have to say the best short-term scenario for equities would be the warmer Spring weather suddenly results in a significant drop in cases. That would buy us a lot of time to develop test kits and build stockpiles of medical equipment and safety gear in the event we have another round of this in the fall and winter. But the other side of this would be that social distancing measures do not have the desired impact and that further, more drastic measures are needed. I can't possibly know how this will unfold and that's the reason for the wild market swings and volatility over the past month. No one else can predict this either. If I knew for sure that the number of cases would go down dramatically, stock prices would be a HUGE buy at current levels.
One advantage that we now have that we did not have one week ago is that price support has been established with a VIX in the 80s. That now marks a very important price support level on the S&P 500 near 2200. I'm not saying the stock market cannot move to fresh lows, but I am saying that 2200 will be a psychologically-important support level that will bear watching in the days and weeks ahead.
Long-term money should stay the course. Short-term money will need to remain very nimble.
Happy trading!
Tom Bowley, Chief Market Strategist
EarningsBeats.com
"Better timing. Better trades."