
EB Weekly Portfolio Report - Sunday, April 12, 2020
Upcoming Earnings Report
The following companies will be reporting earnings this week and each is a component of one of our portfolios:
Monday, April 13: None
Tuesday, April 14: None
Wednesday, April 15: None
Thursday, April 16: None
Friday, April 17: None
PLEASE NOTE: The above companies were provided after scanning the Zacks Earnings Calendar. My research is limited to what Zacks provides and I also can make a mistake from time to time, so please check for earnings dates for all companies that you own. We do hold our portfolio stocks through one earnings report, but every EarningsBeats.com member must make their own investing/trading decisions about holding stocks into earnings reports as it's the most volatile (risky) time to own a stock.
Portfolio Rules and Objectives
Here are the common traits and objectives of each portfolio, some of these were just changed for our February 19th "draft" day last week (changes for the upcoming quarter are in bold italics):
- There are 10 leading stocks from up to 10 leading industries in each portfolio (at the time of selection) - the change here is to allow a second stock within the same industry group
- They are held for an entire 90 day period, with no stops in place - there will be NO stops. All stocks will be held for the entire period (members may choose to have stops, but we will not)
- Every stock will generally be held through ONE earnings report
- The expectation is that relative winners will carry the portfolio to outperformance
- They were all entered into as of close on February 19th
- We decided against having multiple entries for our purposes, but members were encouraged to enter based on whatever felt most comfortable
- Primary objective is to outperform the benchmark S&P 500
Here are several considerations for EB members:
- I would expect the CC (Character Change, formerly Value portfolio) and Aggressive portfolios to be the riskiest, followed by the Model portfolio, and then the Income portfolio
- The CC portfolio's strategy and composition was changed a bit in it second quarter, as we decided to include companies that have broken out of a consolidation range, not just those with breakaway gaps to end a downtrend
- The Income portfolio stocks will all pay dividends, with the expected average dividend yield to be at least 1.5%
- Drawdowns (losses) should be much milder on the Income portfolio, with more volatility expected on the other three; please review inception-to-date charts below to gain an idea of the volatility associated with each
- You should own or trade these stocks in whatever manner is most comfortable for you; while we will buy all 10 stocks in the manner identified above, feel free to trade certain stocks or wait for pullbacks if the stocks are overbought
- We have no idea what risk each member is willing or able to take. We are not registered investment advisors so be sure you understand the risk you take. Please consult your financial advisor.
- EarningsBeats.com shareholders/employees may own all or some of the portfolio stocks from time to time.
Snapshot
Here's a weekly recap:
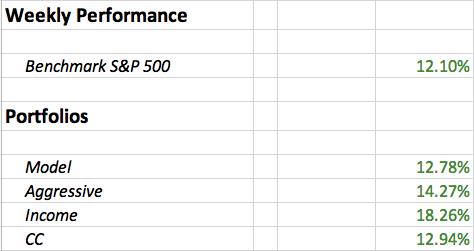
Overall, it was a solid week for the portfolios, especially the Income and Aggressive portfolios. The Income portfolio definitely benefited from a strong rebound in real estate (XLRE) and financial (XLF) stocks. The Aggressive portfolio outperformed largely as a result of weekly relative strength in small caps ($SML) and mid caps ($MID).
Weekly Summary
Benchmark S&P 500:
The S&P 500 gained 12.10%, which was its largest weekly gain since 1974. Of course, we need to keep that in perspective as it comes on the heels of one of the worst four week collapses in stock market history. Still, it was welcome relief and creates much more of a buffer between current price and the March 23rd bottom. We were able to sustain a rally last week that's now carried us to a very important Fibonacci 50% retracement level:
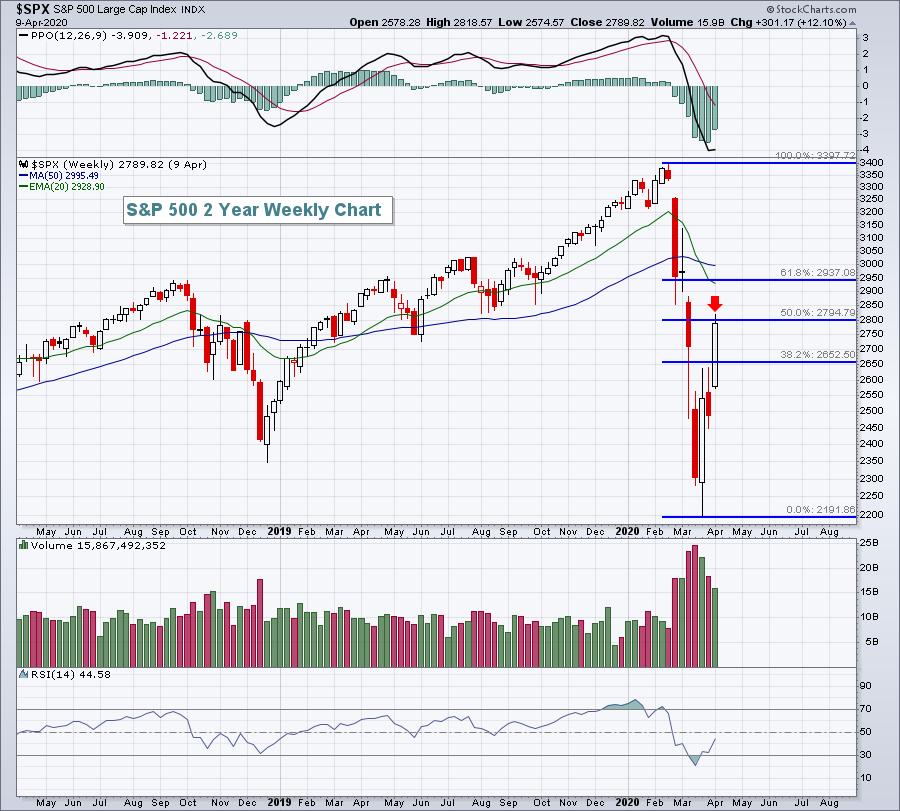
In addition to the key Fibonacci retracement area reflected, it's time for another options expiration Friday as well. We've seen two major reversals occur during or just after Friday options expiration in February and March. I believe we could see more fireworks this week as well. If we were to open the week higher, I would absolutely expect a very significant selloff to end the week. I would be shocked to see another week next week like the one we just had. That would result in a TON of net in-the-money call premium and I doubt that market makers will allow that to occur.
Model Portfolio:
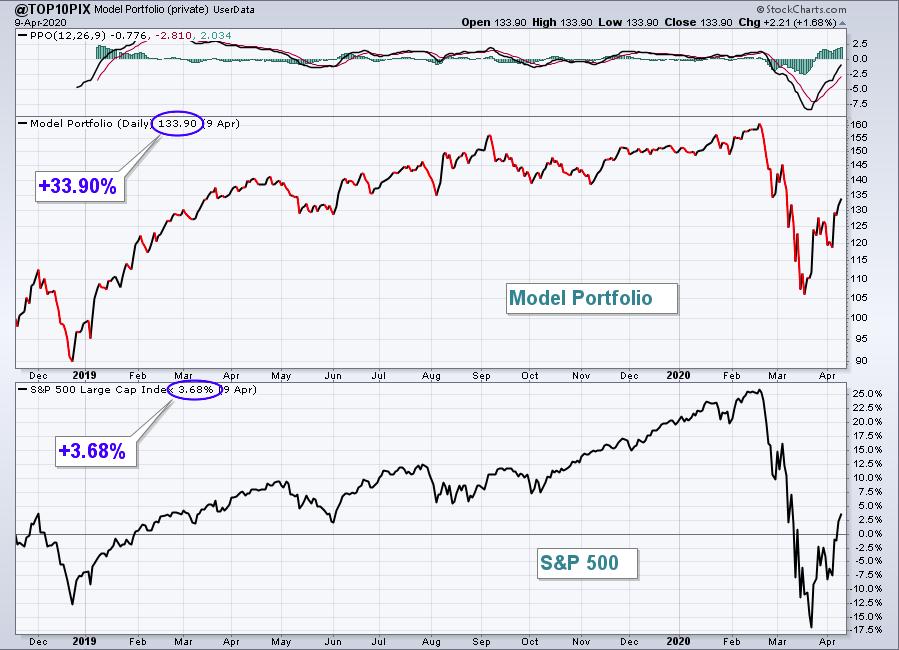
The Model portfolio fell gained 12.78% and managed to outperform the S&P 500 by a slight margin. Here's the updated inception-to-date chart of the portfolio:
Here are how the Model portfolio component stocks performed last week:
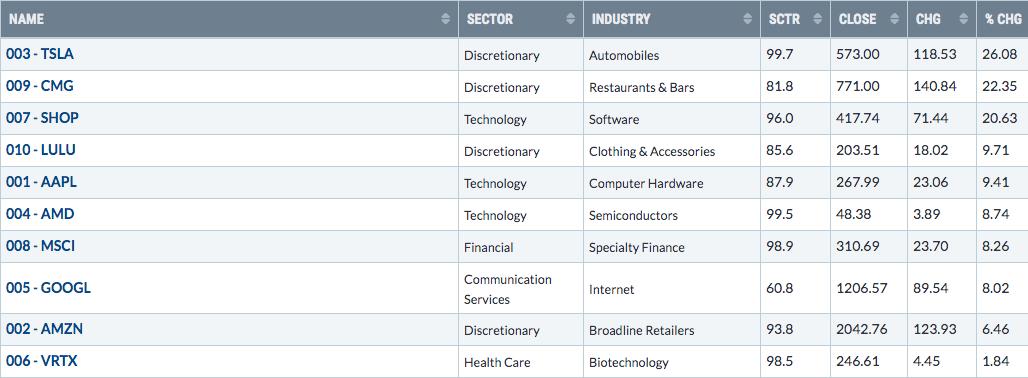
9 of the 10 component stocks still have SCTR scores above 80, which is fortunate in this market environment and it's a big reason why the Model portfolio has outperformed the S&P 500 since the February 19th top.
Aggressive Portfolio:
The Aggressive portfolio had a big week, climbing 14.27% and easily surpassing the S&P 500's strong gain. Here's the Aggressive portfolio chart since its inception on May 19, 2019:
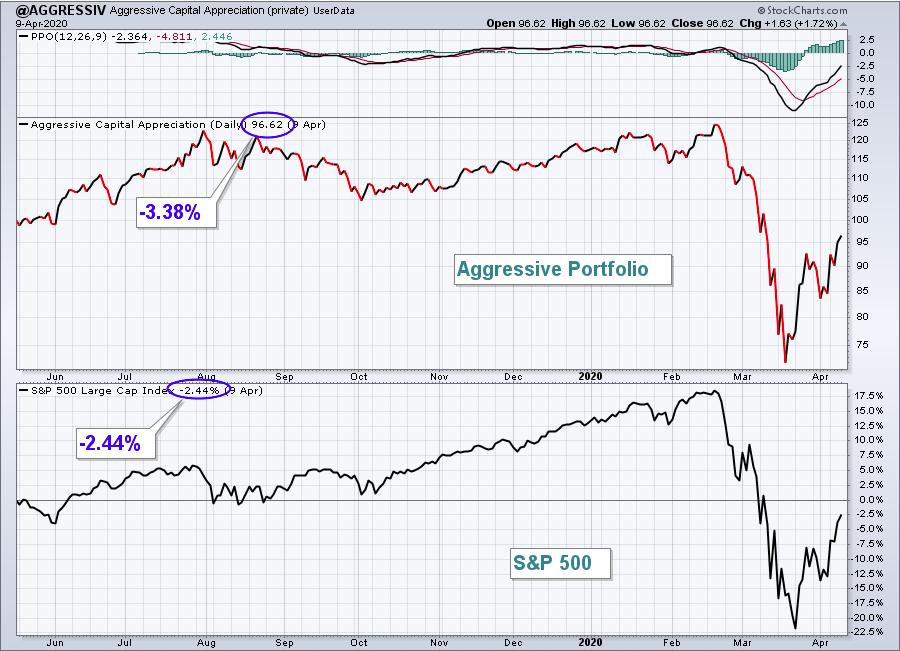
Here are how the Aggressive portfolio component stocks performed last week:
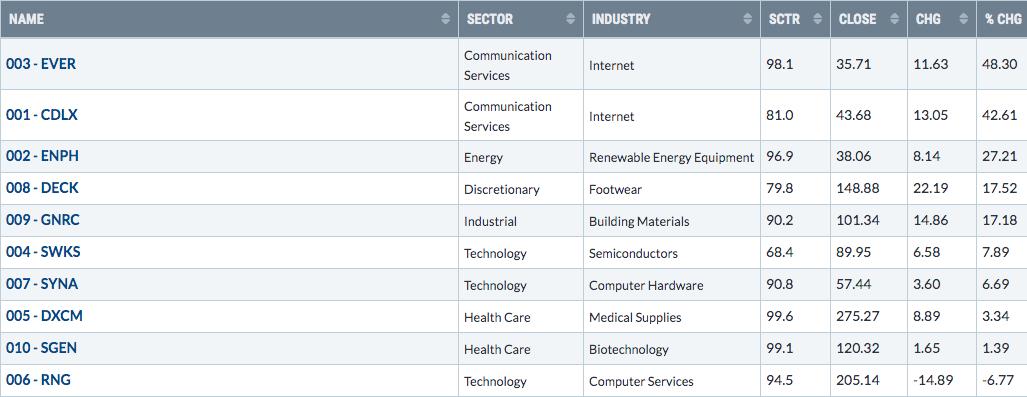
There weren't consistent gains across the board, but the two beaten-down internet names on this list each soared more than 40% and helped to lift the overall portfolio. Meanwhile, RNG, one of the portfolio's strongest component stocks, lost ground during a very bullish week.
Income Portfolio:
The Income portfolio surged 18.26%, making up for some of its recent losses vs. the S&P 500. Here's a look at the inception-to-date chart:
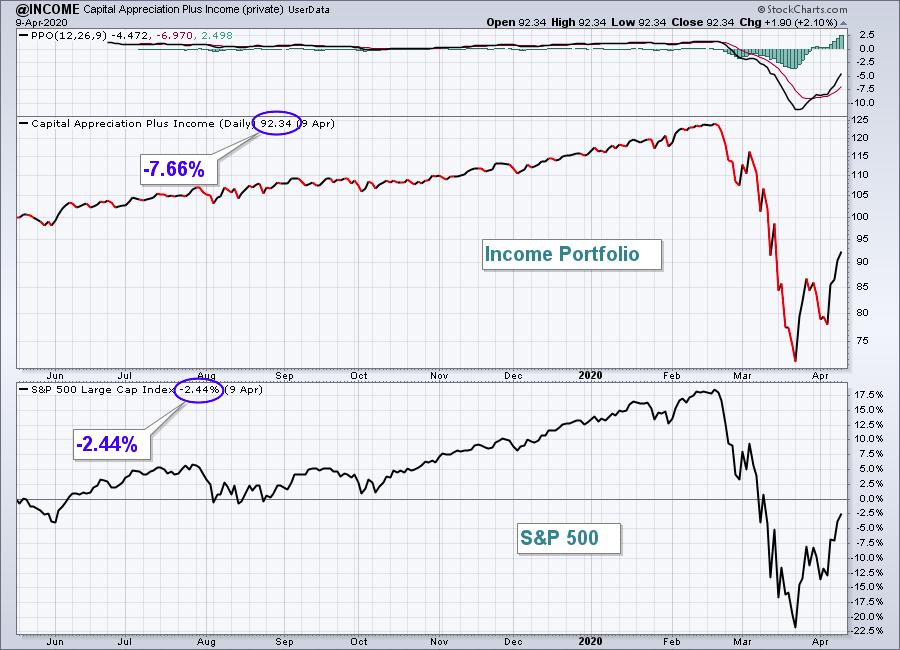
Here are how the Income portfolio component stocks performed last week:
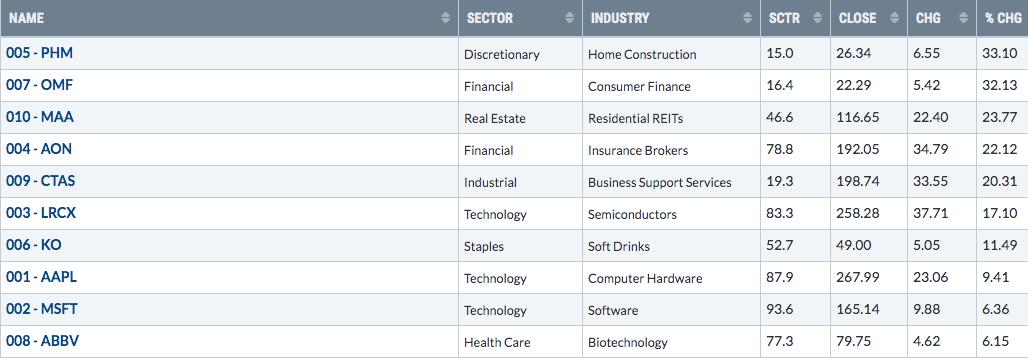
The Income portfolio surged last week with half of its components (5) posting a weekly gain of 20% or more, led by two that gained more than 30%. These two also happen to be the two stocks with the lowest SCTR scores in the portfolio. Much of last week's gains in the stock market came from areas that were badly-beaten up during the initial 35% drop in the S&P 500. It was no different here in our Income portfolio.
Character Change Portfolio:
The CC portfolio %. Here is the inception-to-date chart since November 19, 2019:
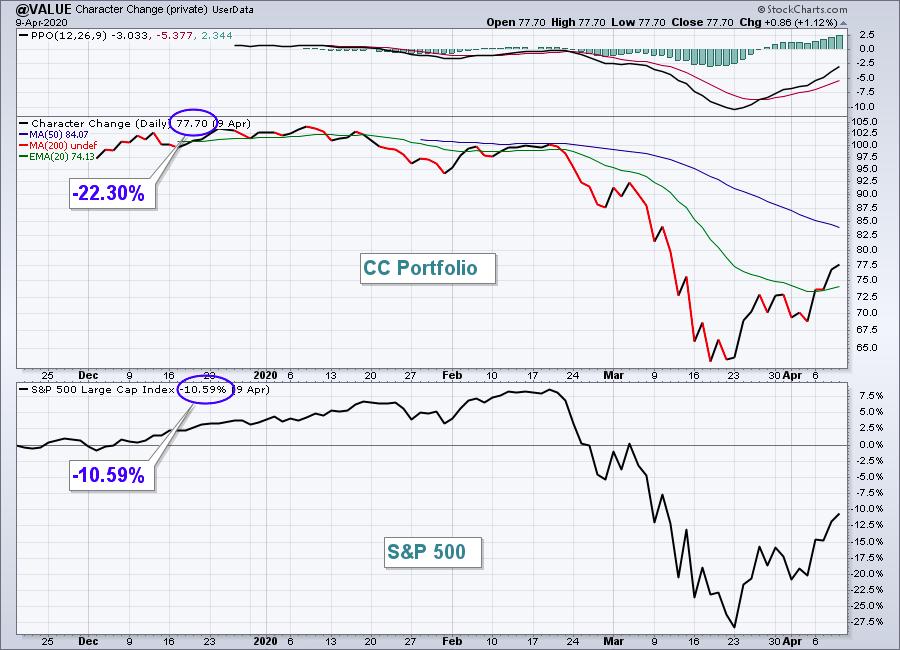
Here are how the CC portfolio component stocks performed last week:
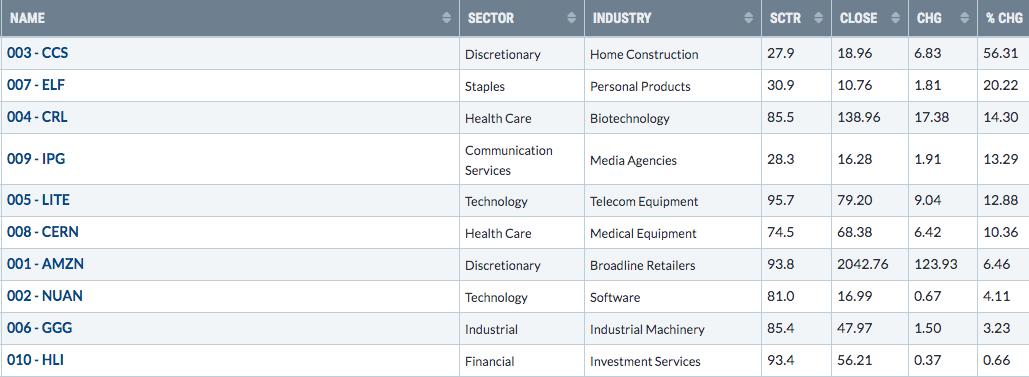
The CC portfolio, despite outperforming the benchmark S&P 500, was clearly the most disappointing portfolio last week. It's comprised of several small and mid cap stocks and those asset classes performed very well last week. We should have seen a much better reaction in our component stocks. While CCS's 56.31% gain was a tremendous boost from the home construction area, it was needed for the portfolio to simply keep pace with the S&P 500. HLI was a drag on the portfolio last week, but it's been an excellent performer throughout the quarter, actually hitting an all-time high on Monday.
Summary
It's been an unbelievably volatile last 7 weeks and with options expiration on deck this week, I can only imagine that volatility will pick back up again. I do believe we remain in a secular bull market and, while I'm not placing 100% certainty on it, I believe the March 23rd bottom is THE bottom. I've been discussing the Fibonacci retracement levels as key price resistance. Now that we've seen a 25%+ rebound off the major low, I'd view the following support levels as critical:
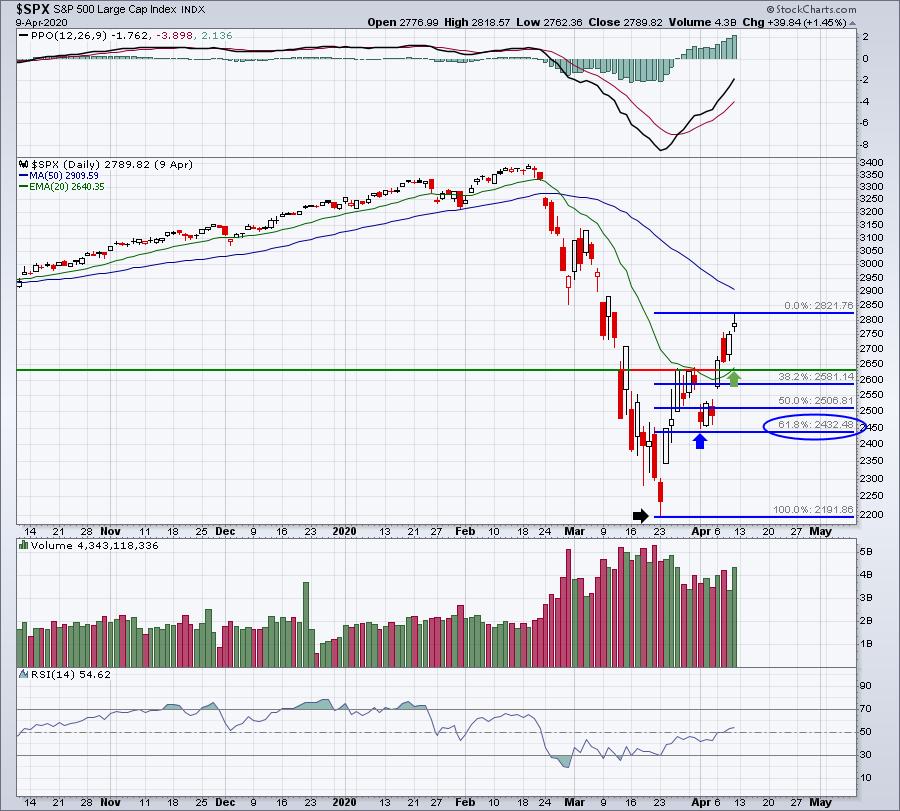
Initial support: The 20 day EMA (green arrow) currently resides at 2640. The late-March closing high on that initial three day rebound attempt was at 2630. When we broke and closed above that level on April 6th, it created support at 2630. Finally, we can also use Fibonacci to mark key support levels on any pullback. That first 38.2% Fibonacci support level is at 2581. Therefore, I believe the initial price support range is from 2581-2640.
Next support: The pullback in early-April established a price low of 2447 (blue arrow). That's where buyers re-emerged. The final 61.8% Fibonacci retracement level is currently at 2432. Therefore, if 2581 support is lost, I'd look to 2432-2447 as the next major level of support.
Final MAJOR support: The March 23rd low of 2191.86 was established after we saw extreme fear envelope the stock market. These types of price lows typically represent MAJOR long-term bottoms. A retest of 2191 would technically be a huge win for the bulls, though getting there would obviously result in a lot more short-term pain. I believe the next bout of selling, perhaps options-related this week, will help us determine whether we ever hit that 2191 level. I don't believe we're going back down there. We've already seen the VIX fall back to 41 at Thursday's close. During the October 2008 financial meltdown, the subsequent rebound never saw the VIX fall below 45. So we're already beginning to see the level of panic drop faster in 2020. In my opinion, we'll need another significant ramping up of the VIX in order to challenge the 2191 price support. I believe 2400-2500 is quite possible, but dropping below that carries much lower odds, especially if options-expiration week does not trigger more impulsive selling.
Happy trading!
Tom Bowley, Chief Market Strategist
EarningsBeats.com
"Better timing. Better trades."