
EB Weekly Portfolio Report - Sunday, April 19, 2020
Upcoming Earnings Reports
According to Zacks.com, the following companies will be reporting earnings this week and each is a component of one of our portfolios:
Monday, April 20: None
Tuesday, April 21: KO, CMG
Wednesday, April 22: LRCX, GGG
Thursday, April 23: PHM
Friday, April 24: IPG
PLEASE NOTE: The above companies were provided after scanning the Zacks Earnings Calendar. My research is limited to what Zacks provides and I also can make a mistake from time to time, so please check for earnings dates for all companies that you own. We do hold our portfolio stocks through one earnings report, but every EarningsBeats.com member must make their own investing/trading decisions about holding stocks into earnings reports as it's the most volatile (risky) time to own a stock.
Portfolio Rules and Objectives
Here are the common traits and objectives of each portfolio, some of these were just changed for our February 19th "draft" day last week (changes for the upcoming quarter are in bold italics):
- There are 10 leading stocks from up to 10 leading industries in each portfolio (at the time of selection) - the change here is to allow a second stock within the same industry group
- They are held for an entire 90 day period, with no stops in place - there will be NO stops. All stocks will be held for the entire period (members may choose to have stops, but we will not)
- Every stock will generally be held through ONE earnings report
- The expectation is that relative winners will carry the portfolio to outperformance
- They were all entered into as of close on February 19th
- We decided against having multiple entries for our purposes, but members were encouraged to enter based on whatever felt most comfortable
- Primary objective is to outperform the benchmark S&P 500
Here are several considerations for EB members:
- I would expect the CC (Character Change, formerly Value portfolio) and Aggressive portfolios to be the riskiest, followed by the Model portfolio, and then the Income portfolio
- The CC portfolio's strategy and composition was changed a bit in it second quarter, as we decided to include companies that have broken out of a consolidation range, not just those with breakaway gaps to end a downtrend
- The Income portfolio stocks will all pay dividends, with the expected average dividend yield to be at least 1.5%
- Drawdowns (losses) should be much milder on the Income portfolio, with more volatility expected on the other three; please review inception-to-date charts below to gain an idea of the volatility associated with each
- You should own or trade these stocks in whatever manner is most comfortable for you; while we will buy all 10 stocks in the manner identified above, feel free to trade certain stocks or wait for pullbacks if the stocks are overbought
- We have no idea what risk each member is willing or able to take. We are not registered investment advisors so be sure you understand the risk you take. Please consult your financial advisor.
- EarningsBeats.com shareholders/employees may own all or some of the portfolio stocks from time to time.
Snapshot
Here's a weekly recap:
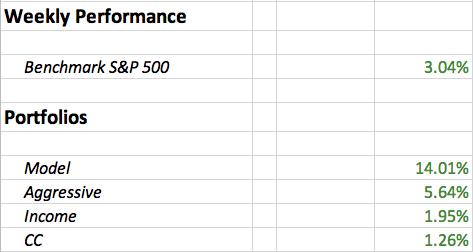
It was another strong week for U.S. equities and our Model portfolio took full advantage, outperforming the benchmark S&P 500 by nearly 11 percentage points - very strong indeed.
Weekly Summary
Benchmark S&P 500:
The S&P 500 gained 3.04% last week and managed to close above its 50 day SMA on Friday.
Surprisingly, the S&P 500 continued to march higher. Last week when I wrote this report, the S&P 500 had reached its 50.0% Fibonacci retracement level. That resistance marked key tops in the panicked markets of both 2008 and 1987. As a result, and with options expiring last week, I felt any early week strength would be met with a concerted selling effort. We saw early selling on Monday morning and a significant gap lower on Wednesday, but otherwise the bulls were out in full force and even intraday charts are reflecting continuing accumulation. Here's a 10 day, 10 minute chart to show the past two week's action:
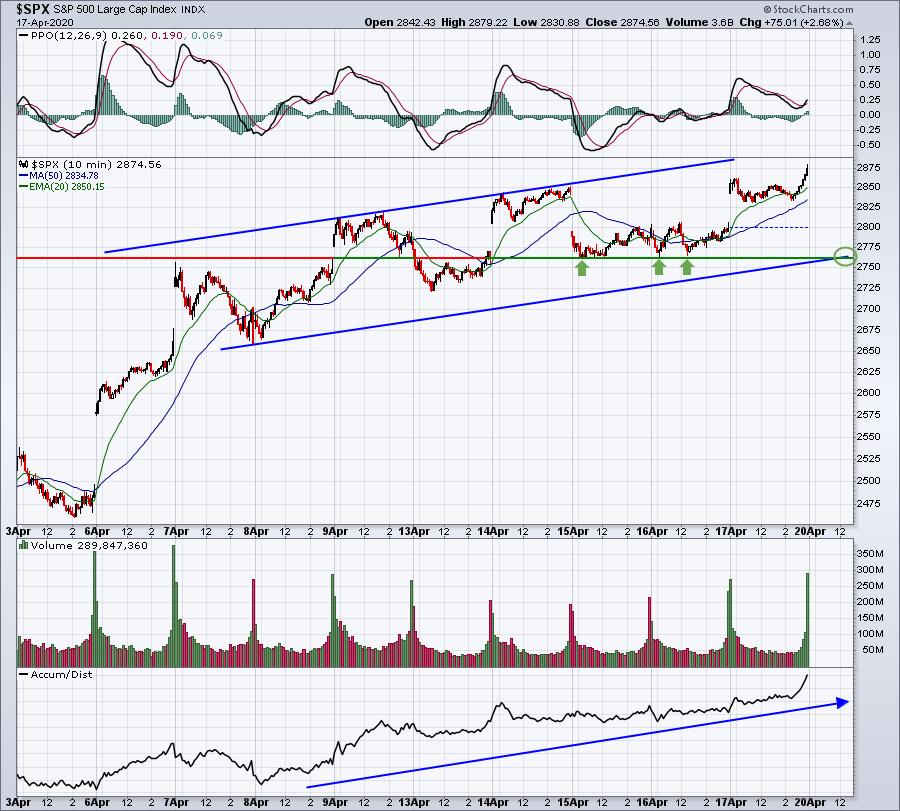
We all must remember that the secular (long-term) bull market remains perfectly intact despite the February 19th top and the recent cyclical (short-term) bear market. Because of that, I give the benefit of the doubt to the bulls and fully expect that we will return to all-time highs. My only question is whether it happens in 2020 or 2021.
Model Portfolio:
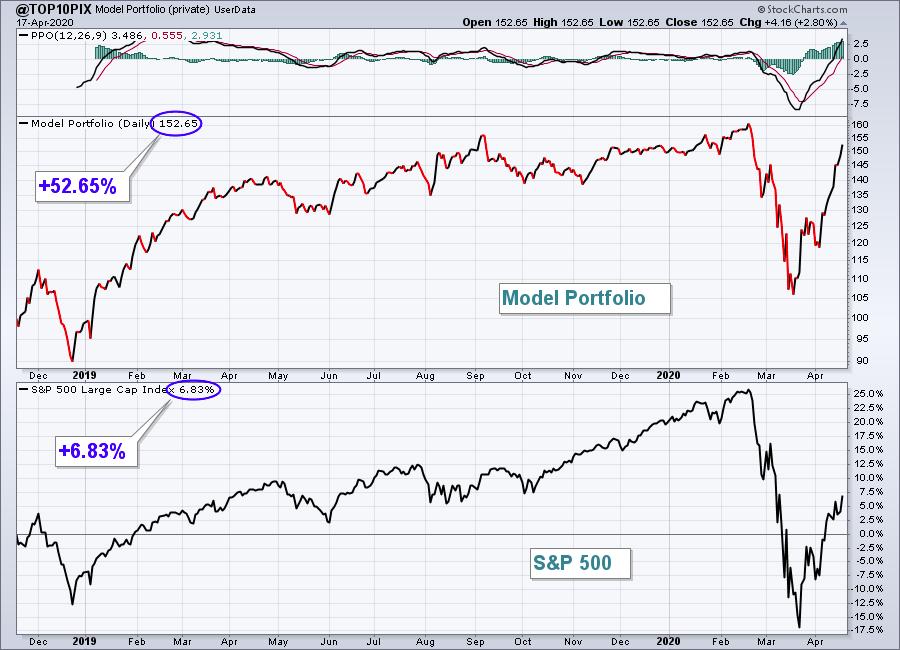
The Model portfolio rocketed higher by 14.01% last week, annihilating the benchmark S&P 500. Here's the updated inception-to-date chart of the portfolio:
Here are how the Model portfolio component stocks performed last week:
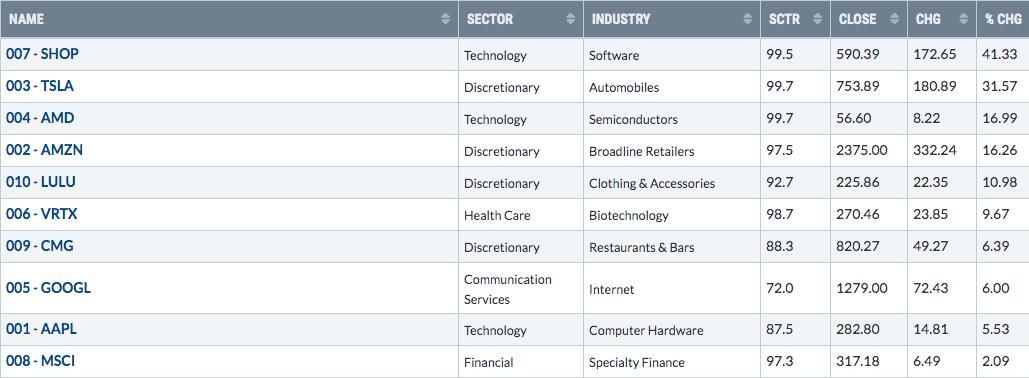
Ok, this was absolutely astounding performance by our flagship Model portfolio. SHOP and TSLA both soared last week, but three others - AMD, AMZN and LULU - all gained more than 10%. This entire group of stocks simply crushed the S&P 500. It's difficult to pick a favorite stock in this portfolio, but it's easy to find the most surprising - LULU:
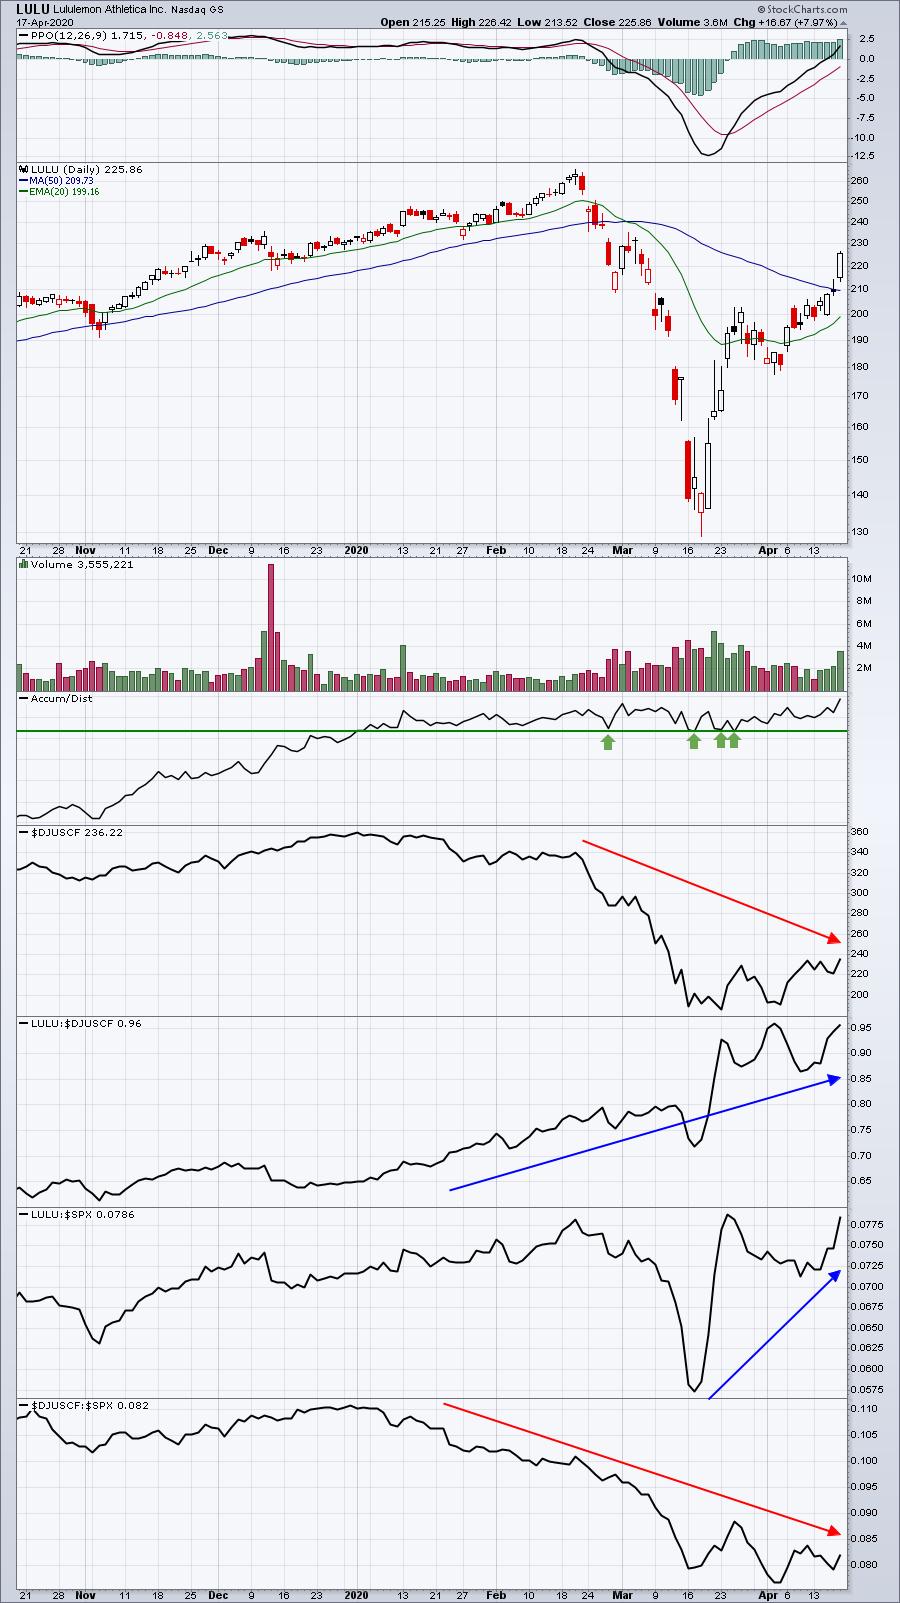
Clothing & accessories ($DJUSCF) have simply not been good in 2020...period. The pandemic only added to the woes of this industry group. In fact, the DJUSCF ranks 74th out of 104 industry groups since the February 19th market top and is down just over 30% in these past two months. Yet LULU is down less than half that and has managed to outperform the S&P 500 throughout it all. Yes, LULU has definitely been a welcome surprise.
Aggressive Portfolio:
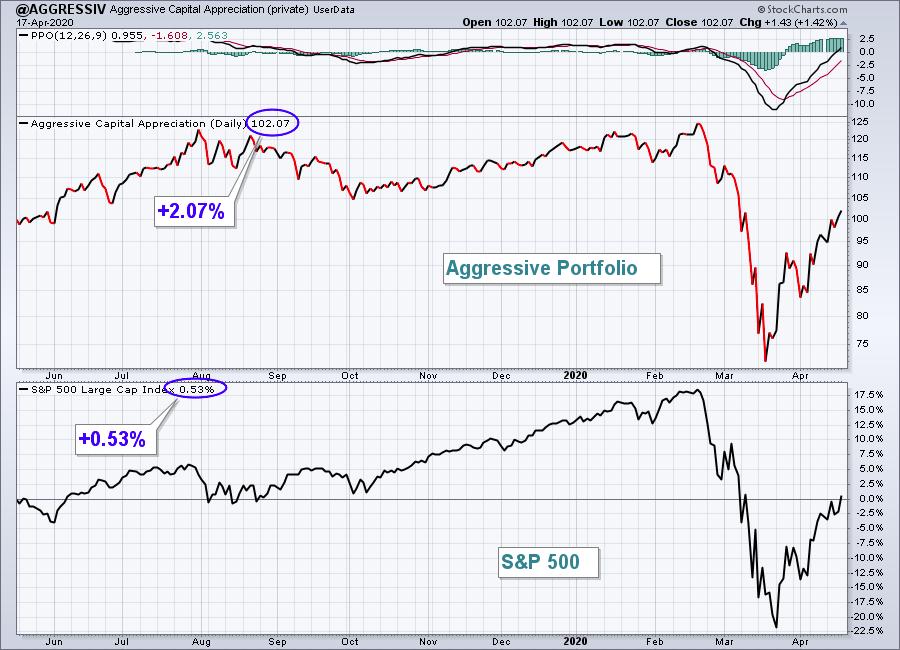
The Aggressive portfolio nearly doubled the performance of the S&P 500, surging 5.64% last week. Here's the Aggressive portfolio chart since its inception on May 19, 2019:
Here are how the Aggressive portfolio component stocks performed last week:
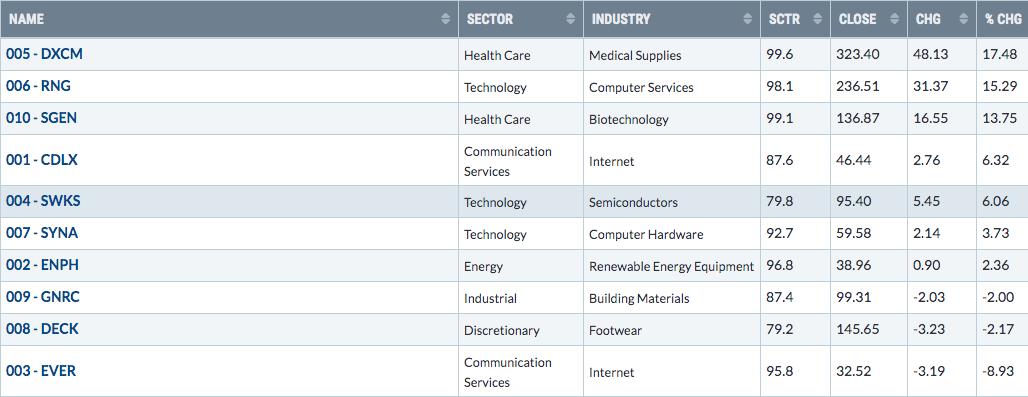
DXCM gained almost 20% last week and its SCTR score ranks it as one of the best stocks in the market. The strength shines through in the following chart:
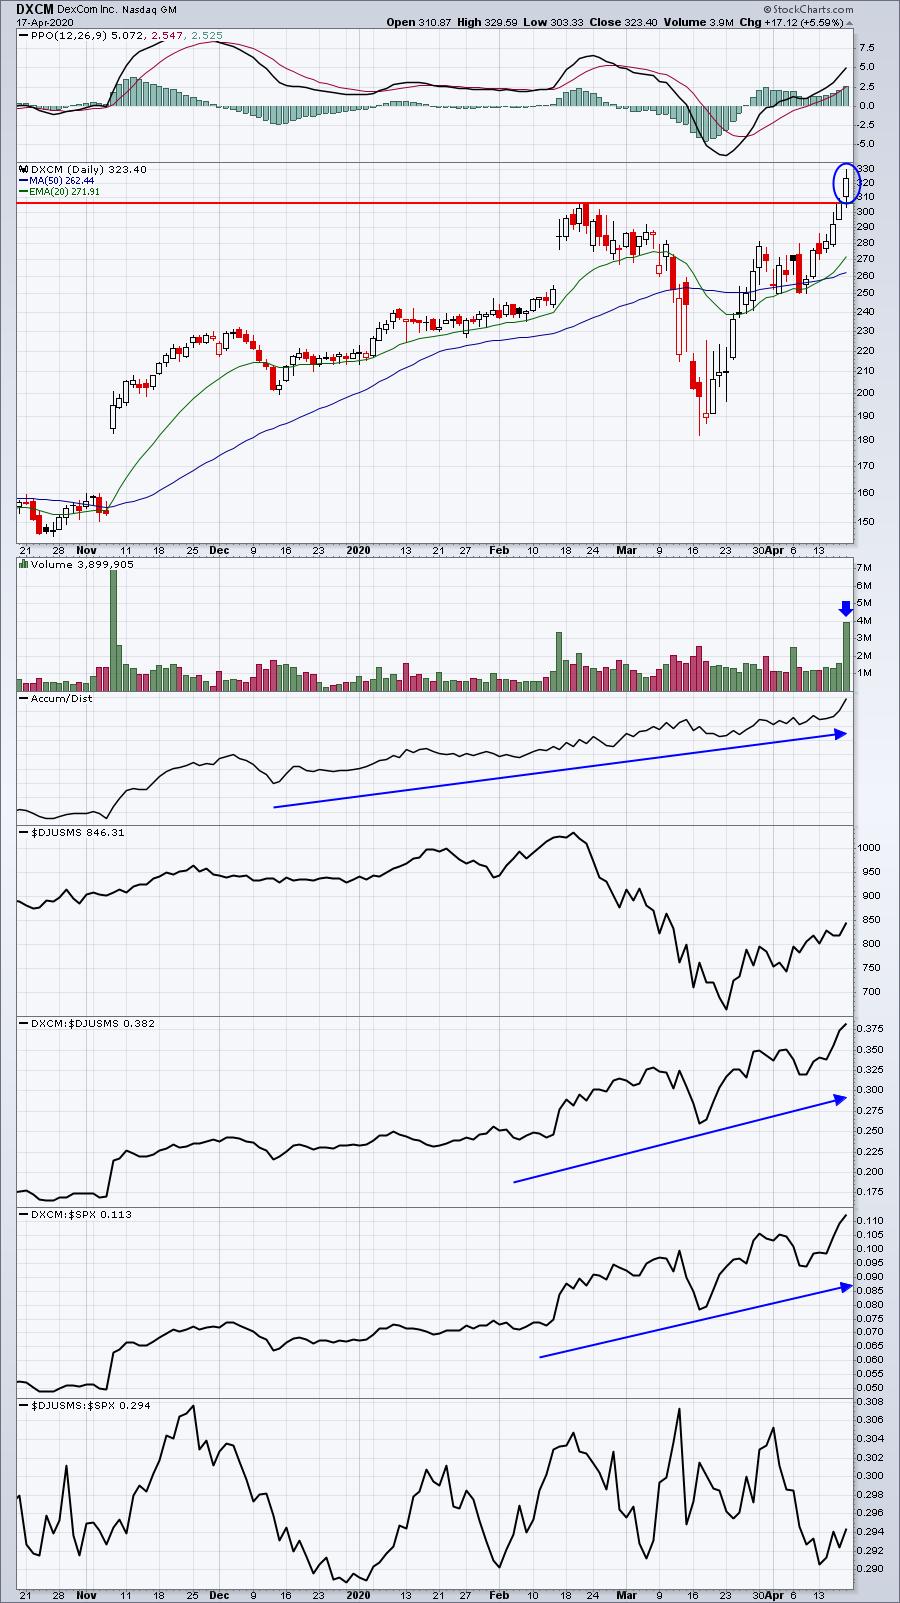
Friday's breakout to an all-time high occurred on very heavy volume. It's also worth noting that DXCM's industry group, medical supplies ($DJUSMS), has not been a very good industry group relative to the benchmark S&P 500. That's despite being part of the strongest sector in 2020 - healthcare (XLV).
Income Portfolio:
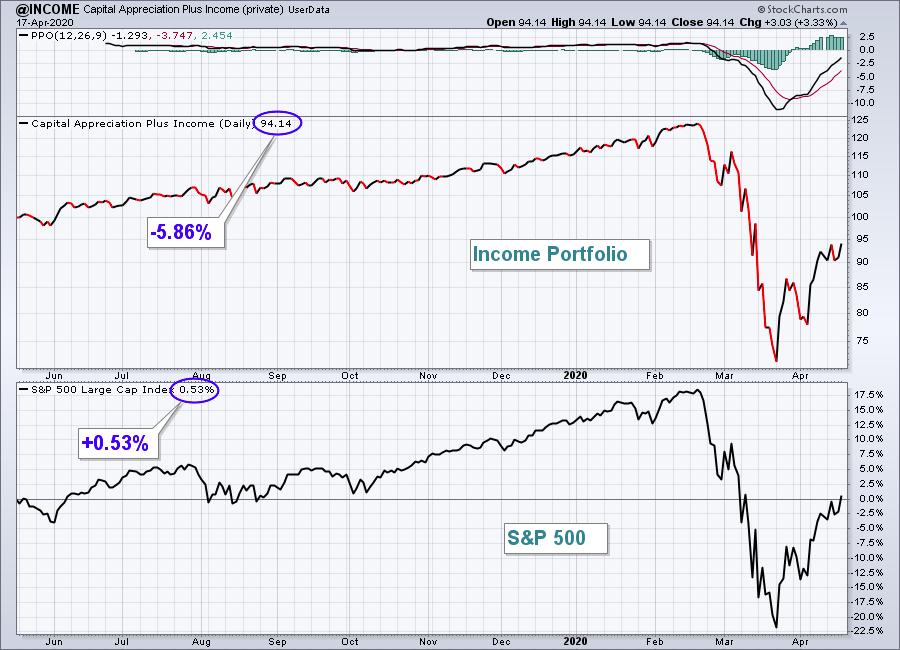
The Income portfolio gained ground last week, rising 1.95%, but that still left it short of the S&P 500's jump. Here's a look at the inception-to-date chart:
Here are how the Income portfolio component stocks performed last week:
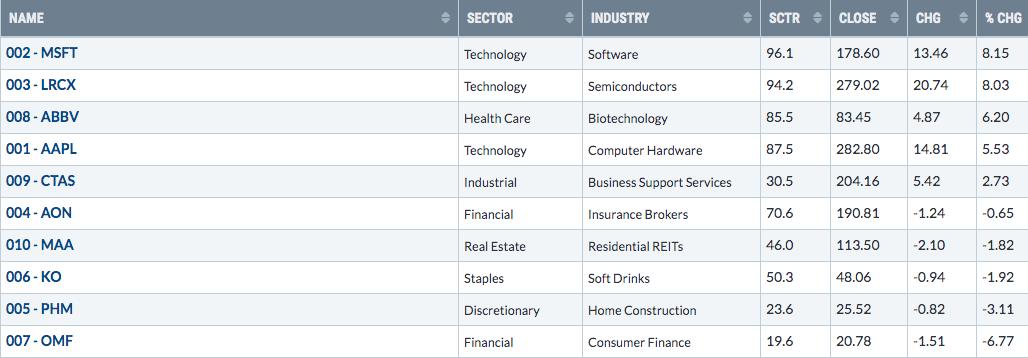
OMF has the lowest SCTR score in the Income portfolio and much of that weakness can be attributed to a very poor consumer finance group ($DJUSSF). Here's a chart of OMF, but also look at the bottom panel and check out the relative weakness in the DJUSSF:
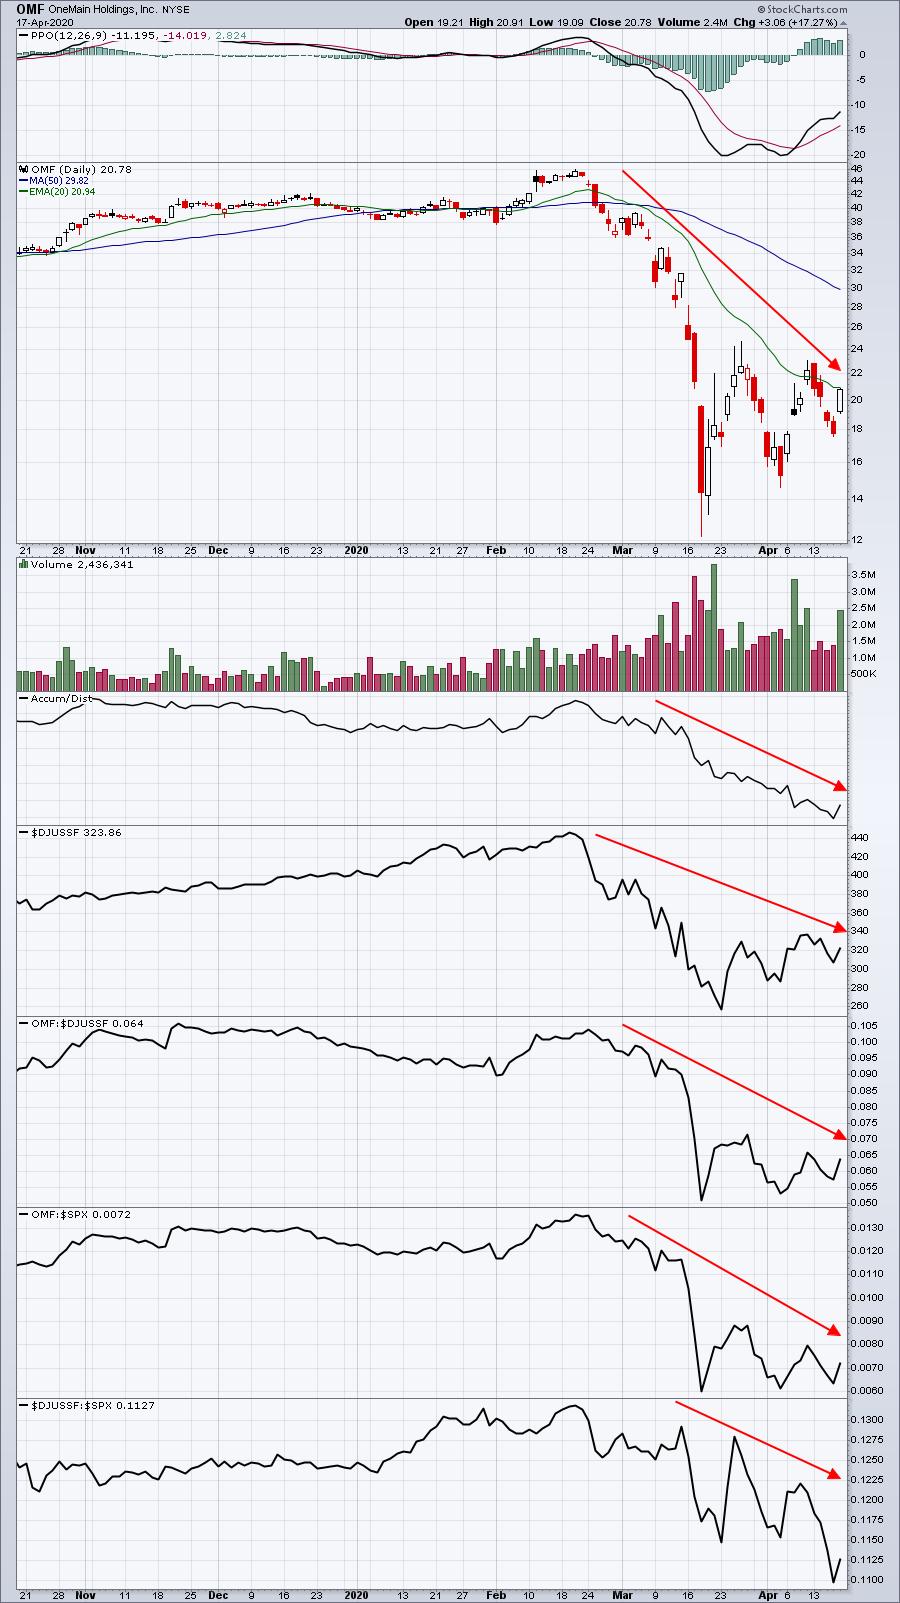
This is the kind of chart we like to try to avoid, but COVID-19 changed areas of relative strength and relative weakness. The DJUSSF has become one of the worst industry groups as a result of the pandemic.
Character Change Portfolio:
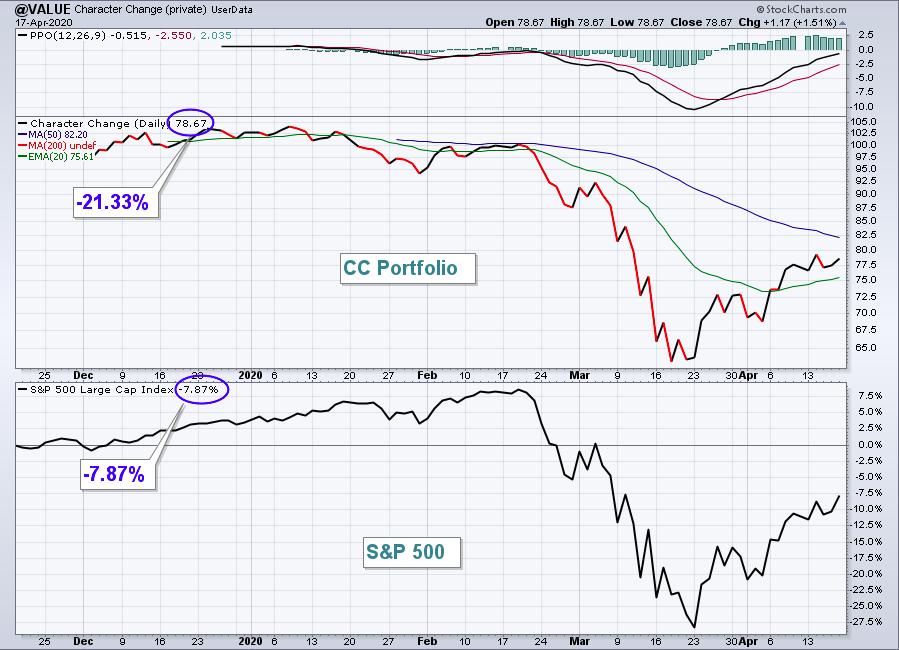
The CC portfolio rose 1.26%, but that lagged the benchmark S&P 500 once again. Here is the inception-to-date chart since November 19, 2019:
Here are how the CC portfolio component stocks performed last week:
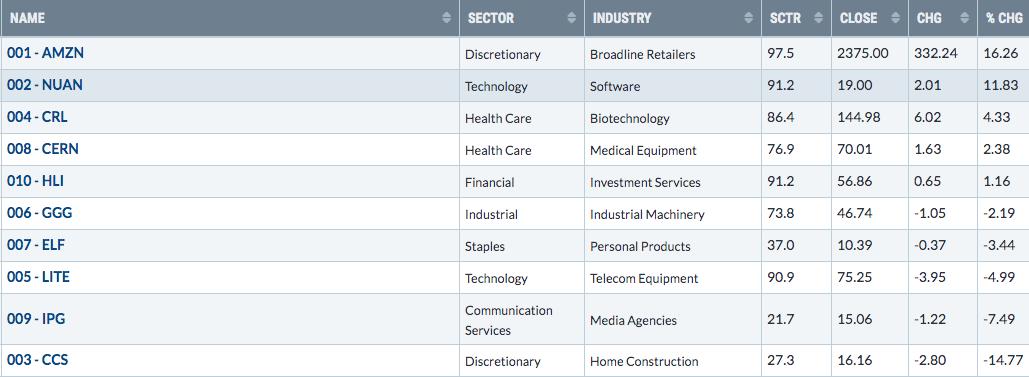
One quick glance at the above chart shows that the stocks with the lower SCTR scores and the worst relative strength continue to weigh on this portfolio. At the top, we saw great performance, but the weaklings are making it very difficult for the CC portfolio to make up ground against the S&P 500.
Here's an updated look at last week's worst performer, CCS:
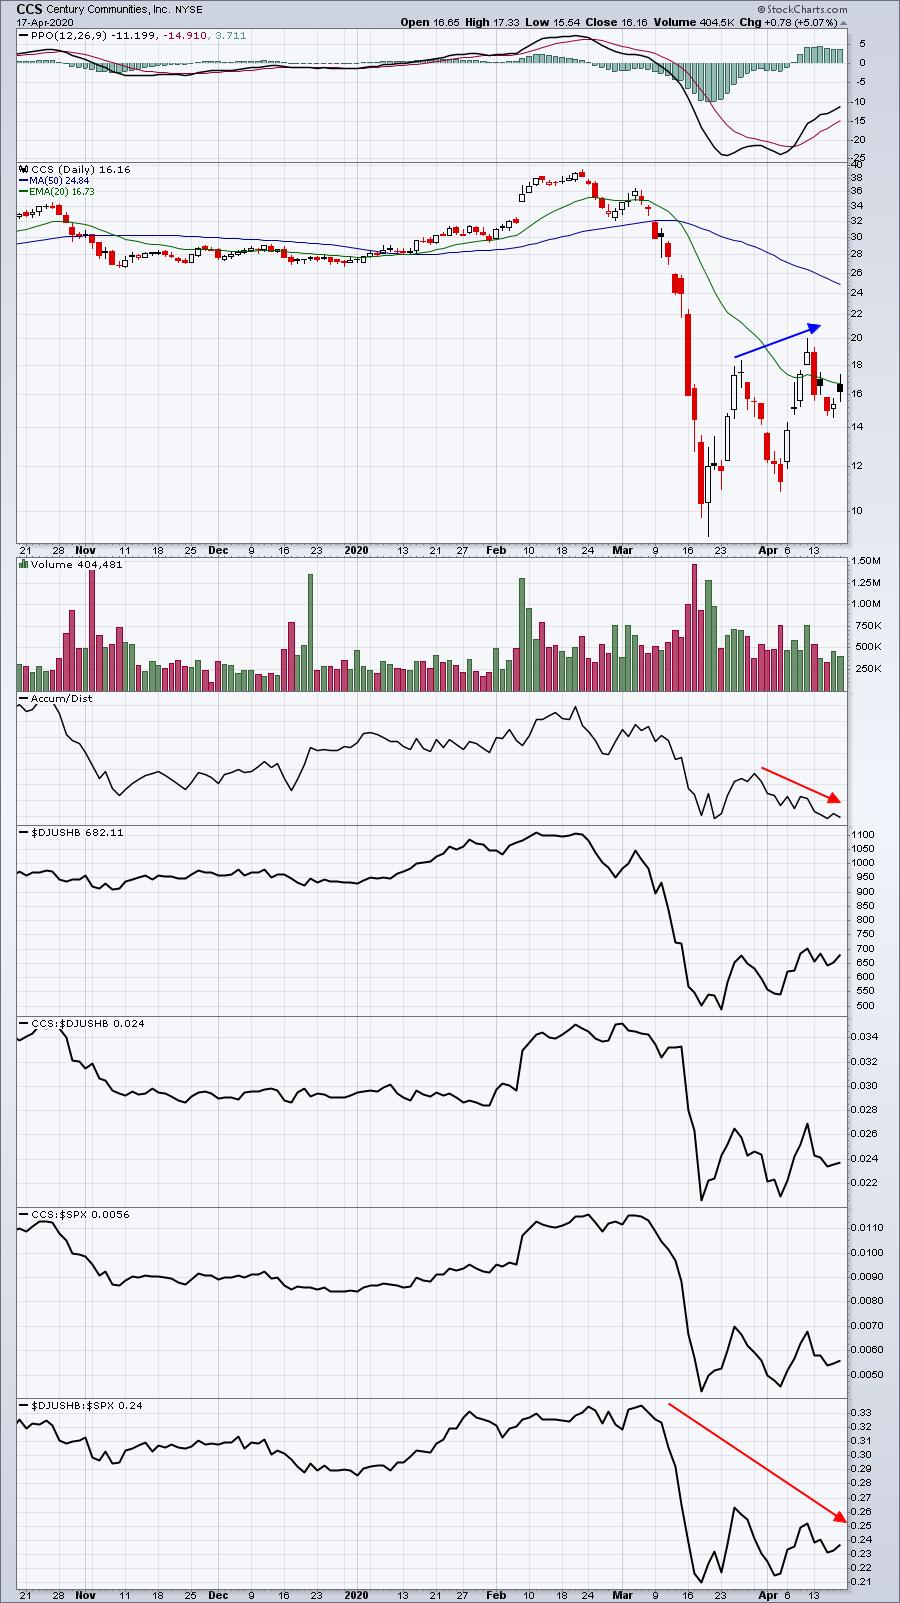
The accumulation/distribution line remains extremely weak and its peer group, home construction ($DJUSHB) continues its relative downtrend vs. the S&P 500. Unfortunately, the DJUSHB has been one of the worst industry groups during this crisis and it's being reflected in our CC portfolio via CCS.
Summary
While option expiration Friday did little to slow the progress of this rally, it's worth noting that the week after options expiration can be very dangerous for bulls as well. Since 1950, here's the annualized performance of the 19th through 25th of ALL calendar months:
19th: -33.46%
20th: -7.57%
21st: +6.07%
22nd: -13.08%
23rd: -3.08%
24th: -3.74%
25th: -6.17%
When you consider that the S&P 500 has risen, on average, 9% per year since 1950, it's very clear that the upcoming week has a historical tendency to underperform as every day from the 19th to 25th has an annualized return below that 9% level. Now that we've seen the daily PPO clear its zero line, I like to use the rising 20 day EMA as support. Here's how that looks currently:
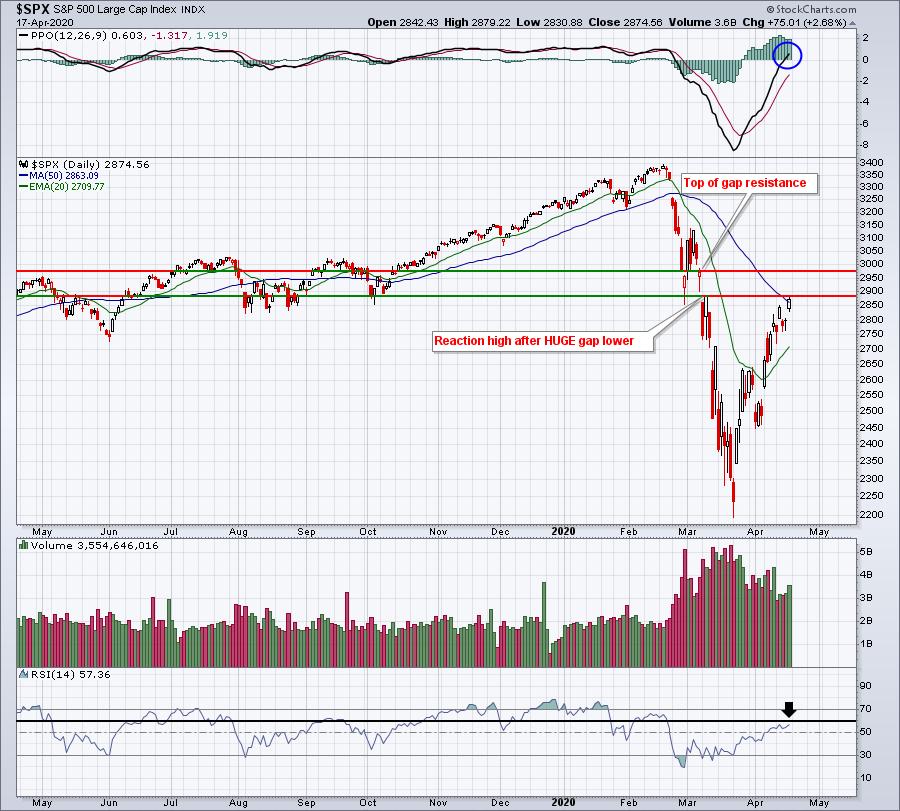
Personally, I'd feel a lot better about this rally if we had one one more selloff first that held at, or preferably above that March 23rd low. The rising 20 day EMA will provide us a key support clue whether we are likely to see another big selloff.
To keep things real, and to provide more of a bearish look at the chart above, it should be pointed out that a MAJOR gap lower and reaction price high occurred just above where the S&P 500 finished on Friday. A heavy volume reversing candle at or near these levels would clearly add more short-term bearishness to the chart. Also, RSI 50-60 tends to mark key resistance during downtrends. The daily RSI moved up to 57 on Friday's close. So those with a bearish slant can lean on these technical conditions.
Again, I remain bullish in the long-term. I recognize that it's entirely possible that another selloff lurks in the wings. But I'm a firm believer the March 23rd low was IT and that we're much more likely to see another all-time high before we see that March 23rd support lost.
Happy trading!
Tom Bowley, Chief Market Strategist
EarningsBeats.com
"Better timing. Better trades."