
EB Weekly Portfolio Report - Sunday, May 31, 2020
Upcoming Earnings Reports
According to Zacks.com, the following companies will be reporting earnings this week and each is a component of one of our portfolios:
Monday, June 1: None
Tuesday, June 2: ZM
Wednesday, June 3: None
Thursday, June 4: DOCU, WORK, CIEN
Friday, June 5: None
PLEASE NOTE: The above companies were provided after scanning the Zacks Earnings Calendar. My research is limited to what Zacks provides and I also can make a mistake from time to time, so please check for earnings dates for all companies that you own. We do hold our portfolio stocks through one earnings report, but every EarningsBeats.com member must make their own investing/trading decisions about holding stocks into earnings reports as it's the most volatile (risky) time to own a stock.
Portfolio Rules and Objectives
Here are the common traits and objectives of each portfolio, some of these were changed for our May 19th "draft" day recently (changes for the upcoming quarter are in bold italics):
- We have removed the Character Change portfolio and added a new Strong AD portfolio
- There are 10 leading stocks from up to 10 leading industries in each portfolio (at the time of selection). Generally, there will only be one stock per industry group, but there could be exceptions.
- They are held for an entire 90 day period, with no stops in place. We strive for consistency, transparency, and simplicity in our portfolios. EB.com members may hold these stocks for the entire 90 days, trade them, use stops, etc., but for purposes of our calculation, we will make no exceptions to our "buy and hold for three months" strategy.
- Every stock will generally be held through ONE earnings report
- The expectation is that relative winners will carry the portfolio to outperformance
- They will all be entered into as of close on Tuesday, May 19th; members may choose to try to time better entries, but EB.com will "purchase" as of May 19th's closing price
- Primary objective is to outperform the benchmark S&P 500
Here are several considerations for EB members:
- I would expect the Strong AD and Aggressive portfolios to be the riskiest, followed by the Model portfolio, and then the Income portfolio
- The Strong AD portfolio will be selected from a combination of rising accumulation/distribution lines and SCTRs above 80 at the time of selection. It will be our only portfolio that does NOT require a revenue and EPS beat in its most recent quarterly earnings report
- The Income portfolio stocks will all pay dividends, with the expected average dividend yield to be at least 1.5%
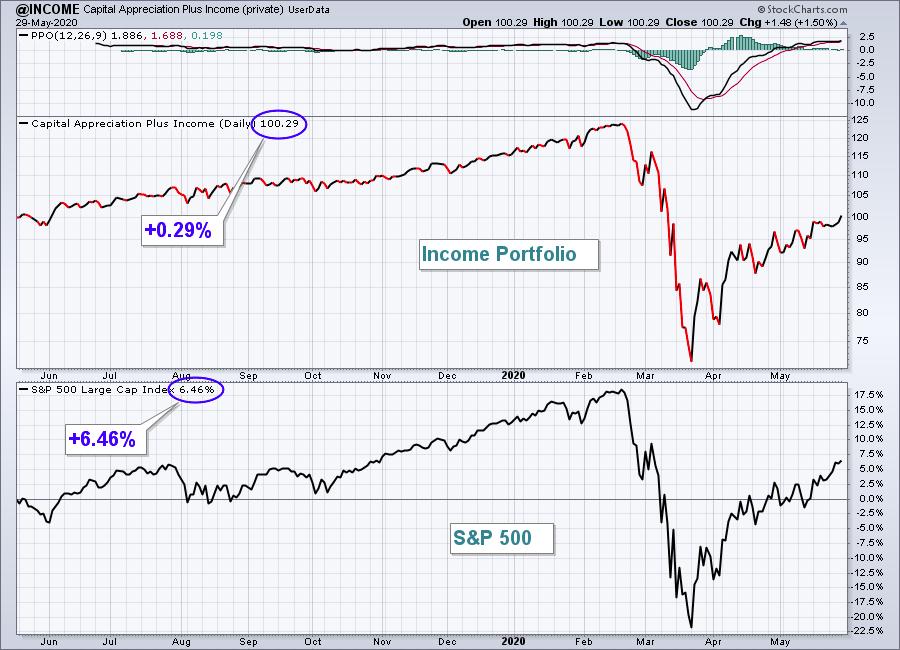
- Drawdowns (losses) should be much milder on the Income portfolio, with more volatility expected on the other three; please review inception-to-date charts below to gain an idea of the volatility associated with each
- I believe the larger drawdown on the Income portfolio last quarter was an anomaly occurring as a result of the pandemic as many defensive, higher-yielding companies uncharacteristically underperformed during a market decline.
- You should own or trade these stocks in whatever manner is most comfortable for you; while we will buy all 10 stocks in the manner identified above, feel free to trade certain stocks or wait for pullbacks if the stocks are overbought
- We have no idea what risk each member is willing or able to take. We are not registered investment advisors so be sure you understand the risk you take. Please consult your financial advisor.
- EarningsBeats.com shareholders/employees may own all or some of the portfolio stocks from time to time.
Weekly Snapshot
Here's a weekly recap:
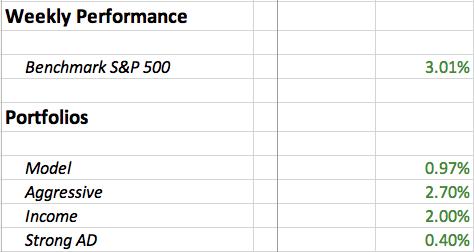
All of our portfolios came up shy of the benchmark's gain last week, but a lot of ground was made up after disastrous days on Tuesday and Wednesday to open the holiday-shortened week. Friday was a very strong recovery day for our portfolios, especially the Aggressive and Model portfolios.
Weekly Summary
Benchmark S&P 500:
The S&P 500 climbed 3.01% last week, but the week clearly favored beaten-down areas of the market, working against our relative strength strategy. The following breakdown of performance last week between our various ChartLists helps to explain the makeup of the rally:
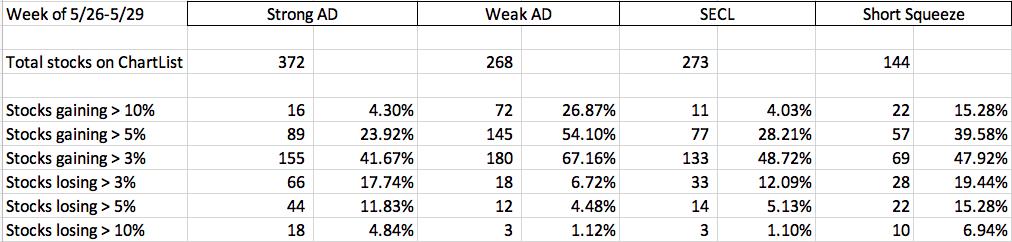
The Weak AD saw 67% of its stocks rise 3% or more, easily the best performing of our ChartLists. That's definitely a signal that last week, especially Tuesday and Wednesday, belonged to the last few month's underperformers. I don't expect it to last, but I watch the performance of these ChartLists every single day to watch for signs that the tide has turned. Thursday and Friday saw the stocks with the greatest relative strength fire back in a broad advance and enabled our portfolios to all finish in positive territory. It didn't look good on Wednesday's close, but by Friday things had completely turned around.
Model Portfolio:
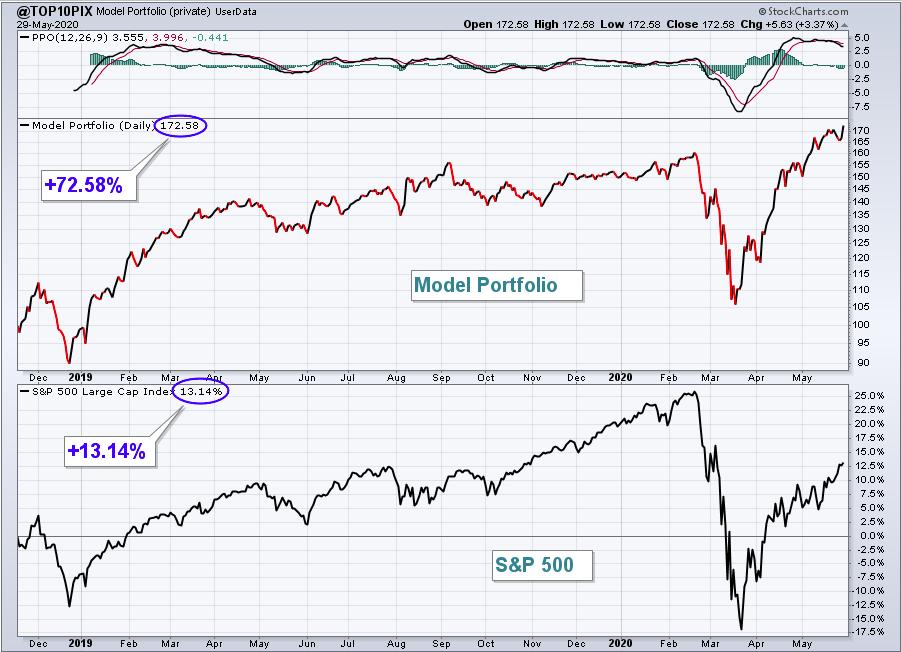
The Model portfolio trailed the S&P 500 last week, but still advanced 0.97%. Here's the updated inception-to-date chart of the portfolio:
Here are how the Model portfolio component stocks performed last week:
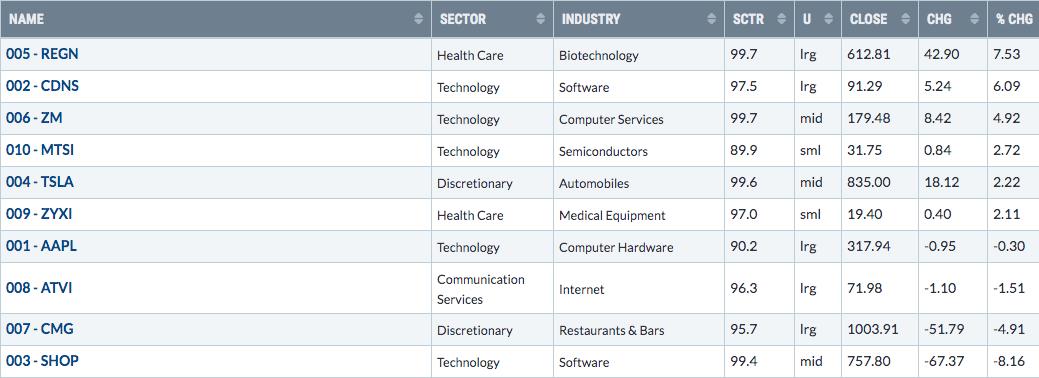
SHOP and CMG clearly held back the portfolio, but it's hard to fault either of these two stocks too much given their recent strong relative performances. Their SCTR scores are 99.4 and 95.7, respectively.
Aggressive Portfolio:
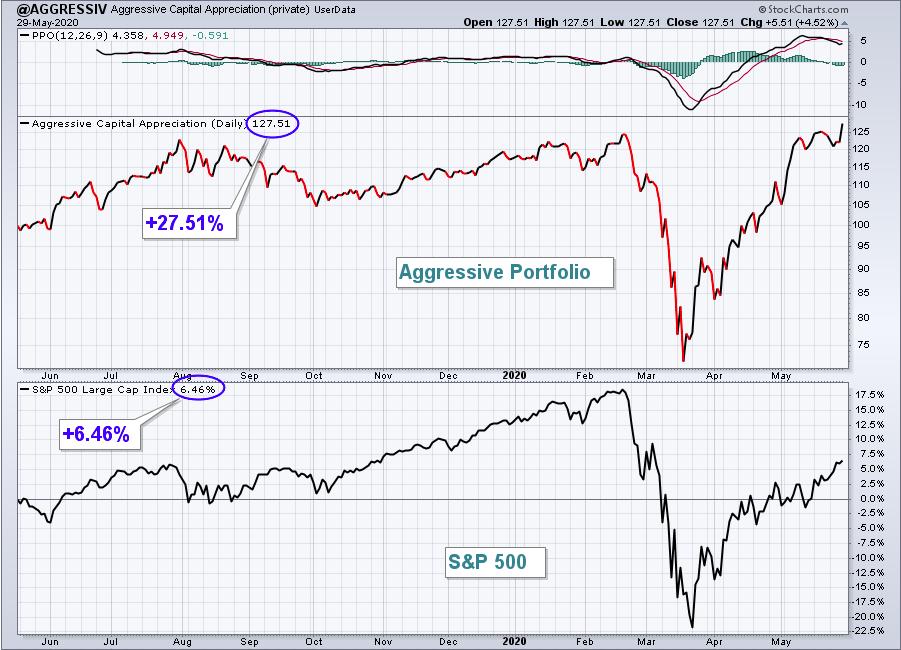
The Aggressive portfolio was very strong on Friday and ended the week with a gain of 2.70%. Here's the Aggressive portfolio chart since its inception on May 19, 2019:
Here are how the Aggressive portfolio component stocks performed last week:
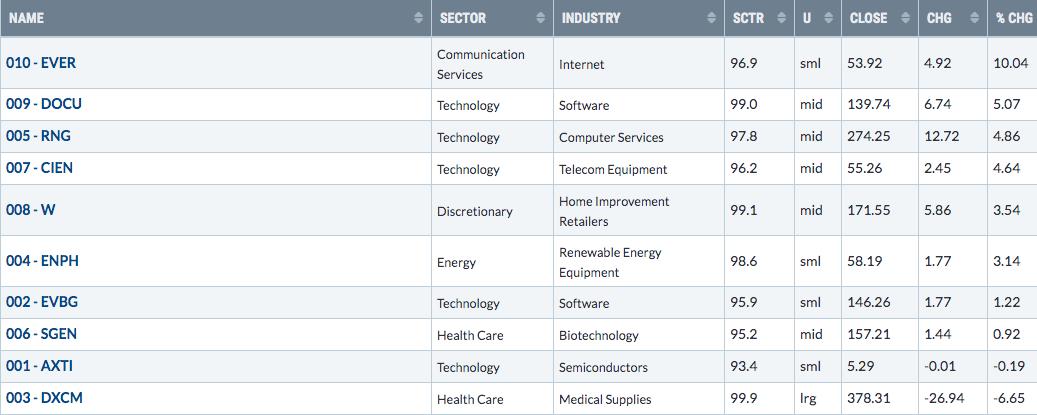
DXCM was the weak link here, but after falling back and nearly testing its 50 day SMA, it rallied strongly late Wednesday through Friday and actually was one of the S&P 500's top performers on Friday. Again, check out that SCTR score of 99.9. DXCM currently has the highest SCTR score at StockCharts.com.
Income Portfolio:
The Income portfolio rose 2.00%, but came up short of the S&P 500's one week gain. Here's a look at the inception-to-date chart:
Here are how the Income portfolio component stocks performed last week:
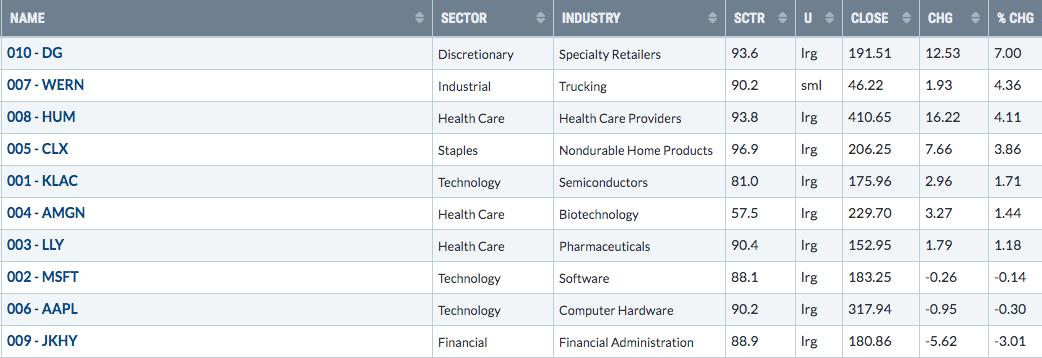
DG was the first of our portfolio stocks to report earnings and the stock performed quite well after their quarterly release, breaking out to an all-time high.
Strong AD Portfolio:
The Strong AD Portfolio barely finished in positive territory last week, climbing 0.40%.
I was having technical difficulties trying to print a chart of our latest User-Defined Index, which is how we visually display our portfolio performance. I'll try to have that rectified for next week.
Meanwhile, here are how the Strong AD portfolio component stocks performed last week:
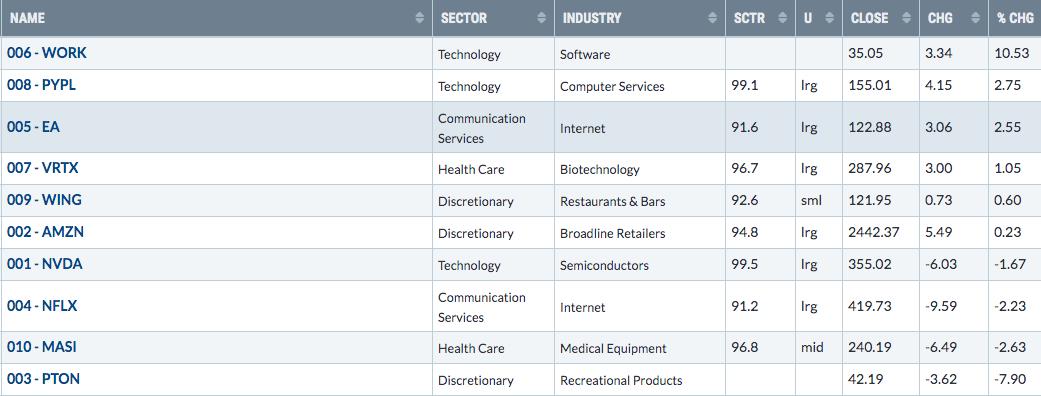
WORK rallied strongly last week as it prepares for its quarterly earnings announcement this Thursday. PTON, on the other hand, saw profit taking to test gap support and its 20 day EMA on Wednesday. It did manage to recover more than three bucks off its intraweek low, but still lost almost 8% for the week. PTON, along with weekly losses from NVDA, NFLX, and MASI made it difficult to keep pace with the S&P 500. I expect to see outperformance from these stocks in the week ahead.
Summary
Well, we trailed the benchmark S&P 500 on all of our portfolios last week, but it could have been a lot worse (and it was on Tuesday and Wednesday). Still, by week's end, both the Model and Aggressive portfolios moved further into record territory, closing at all-time highs. Given the severity of the decline in March, I honestly didn't imagine I'd be discussing all-time highs on any of our portfolios this quickly.
DOCU and CIEN will be reporting on Thursday and they represent 20% of the Aggressive Portfolio. There's no doubt the reaction to these two earnings reports will go a long way in determining how that portfolio performs this week.
Happy trading!
Tom Bowley, Chief Market Strategist
EarningsBeats.com
"Better timing. Better trades."