
EB Weekly Portfolio Report - Sunday, June 7, 2020
Upcoming Earnings Reports
According to Zacks.com, the following companies will be reporting earnings this week and each is a component of one of our portfolios:
Monday, June 8: None
Tuesday, June 9: None
Wednesday, June 10: None
Thursday, June 11: None
Friday, June 12: None
PLEASE NOTE: The above companies were provided after scanning the Zacks Earnings Calendar. My research is limited to what Zacks provides and I also can make a mistake from time to time, so please check for earnings dates for all companies that you own. We do hold our portfolio stocks through one earnings report, but every EarningsBeats.com member must make their own investing/trading decisions about holding stocks into earnings reports as it's the most volatile (risky) time to own a stock.
Portfolio Rules and Objectives
Here are the common traits and objectives of each portfolio, some of these were changed for our May 19th "draft" day recently (changes for the upcoming quarter are in bold italics):
- We have removed the Character Change portfolio and added a new Strong AD portfolio
- There are 10 leading stocks from up to 10 leading industries in each portfolio (at the time of selection). Generally, there will only be one stock per industry group, but there could be exceptions.
- They are held for an entire 90 day period, with no stops in place. We strive for consistency, transparency, and simplicity in our portfolios. EB.com members may hold these stocks for the entire 90 days, trade them, use stops, etc., but for purposes of our calculation, we will make no exceptions to our "buy and hold for three months" strategy.
- Every stock will generally be held through ONE earnings report
- The expectation is that relative winners will carry the portfolio to outperformance
- They will all be entered into as of close on Tuesday, May 19th; members may choose to try to time better entries, but EB.com will "purchase" as of May 19th's closing price
- Primary objective is to outperform the benchmark S&P 500
Here are several considerations for EB members:
- I would expect the Strong AD and Aggressive portfolios to be the riskiest, followed by the Model portfolio, and then the Income portfolio
- The Strong AD portfolio will be selected from a combination of rising accumulation/distribution lines and SCTRs above 80 at the time of selection. It will be our only portfolio that does NOT require a revenue and EPS beat in its most recent quarterly earnings report
- The Income portfolio stocks will all pay dividends, with the expected average dividend yield to be at least 1.5%
- Drawdowns (losses) should be much milder on the Income portfolio, with more volatility expected on the other three; please review inception-to-date charts below to gain an idea of the volatility associated with each
- I believe the larger drawdown on the Income portfolio last quarter was an anomaly occurring as a result of the pandemic as many defensive, higher-yielding companies uncharacteristically underperformed during a market decline.
- You should own or trade these stocks in whatever manner is most comfortable for you; while we will buy all 10 stocks in the manner identified above, feel free to trade certain stocks or wait for pullbacks if the stocks are overbought
- We have no idea what risk each member is willing or able to take. We are not registered investment advisors so be sure you understand the risk you take. Please consult your financial advisor.
- EarningsBeats.com shareholders/employees may own all or some of the portfolio stocks from time to time.
Weekly Snapshot
Here's a weekly recap:
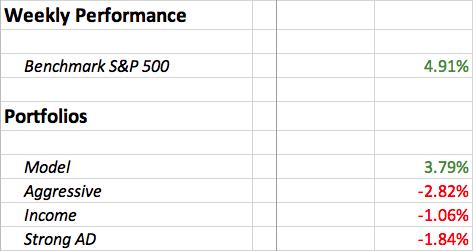
Our major indices had a solid week last week, especially the Dow Jones, which gained almost 7% in just one week. In fact, in the past 8 trading sessions, the Dow Jones has cleared 25,000, 26,000, and 27,000. Unfortunately for us, relative strength played very little role in the surge in equity prices. From the Excel table reflected below, you'll see that stocks with relative weakness (Weak AD ChartList stocks) led the charge for the second consecutive week.
Weekly Summary
Benchmark S&P 500:
The S&P 500 surged 4.91% last week, but the week clearly favored beaten-down areas of the market, working for the second straight week against our relative strength strategy. The following breakdown of performance last week between our various ChartLists helps to explain the makeup of the rally:
Our major indices had a solid week last week, although many of the high-growth NASDAQ companied failed to keep pace after several weeks of significant outperformance. Outside of the Model portfolio, our portfolios badly lagged last week. Quite honestly, we've seen this quite a bit of late. Either pandemic stocks have a bid....or they don't. There's not been a lot of in between. The disparity in performance can be illustrated by comparing the performance of our various ChartLists from last week:
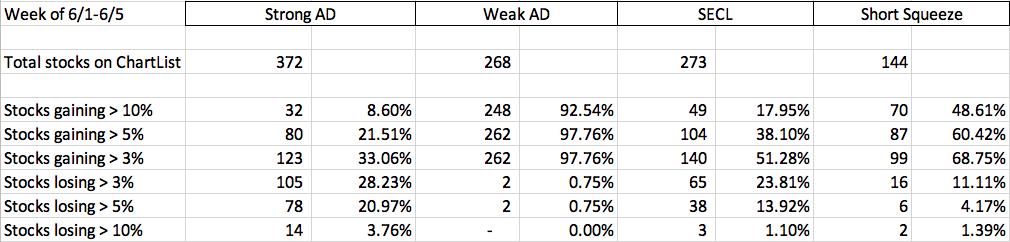
These numbers are crazy. Look at the Weak AD ChartList and the dispersion of results. 92.5% of the 268 stocks on the Weak AD ChartList gained at least 10% last week. 10% is more than double the weekly return of the S&P 500 (+4.91%). So, more than 92% of the Weak AD ChartList stocks at least doubled the S&P 500 return last week. Check out these additional weekly stats from the Weak AD ChartList:
- 88 of 268 stocks gained at least 30%
- 123 of 268 stocks gained at least 25%
- 183 of 268 stocks gained at least 20%
Our portfolios honestly had no chance of keeping up last week. The market completely turned its attention to stocks that previously were not working throughout the pandemic and discarded most of those that were.
Model Portfolio:
The Model portfolio advanced 3.79%, a superb week given the backdrop of relatively weak stocks leading the charge. Here's the updated inception-to-date chart of the portfolio:
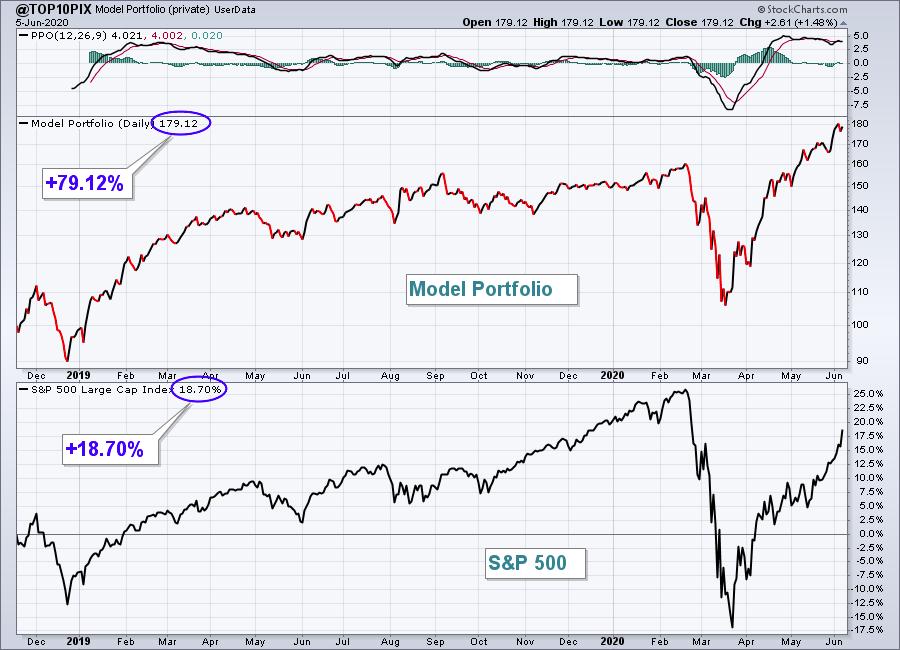
Here are how the Model portfolio component stocks performed last week:
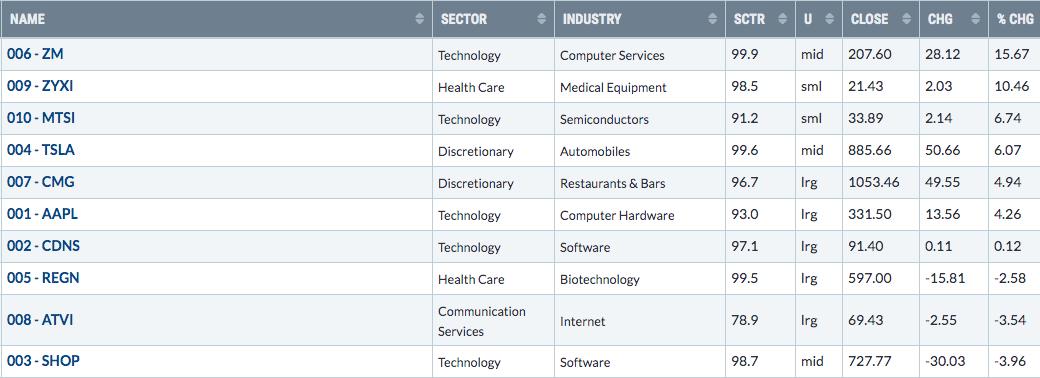
As stated earlier, the Model Portfolio held up quite well. It definitely was impacted by having two software companies as software was a significant underperforming industry group last week. Also, REGN performed poorly on a relative basis, as did the entire biotechnology group. Health care (XLV) was easily the worst performing sector for the week.
Aggressive Portfolio:
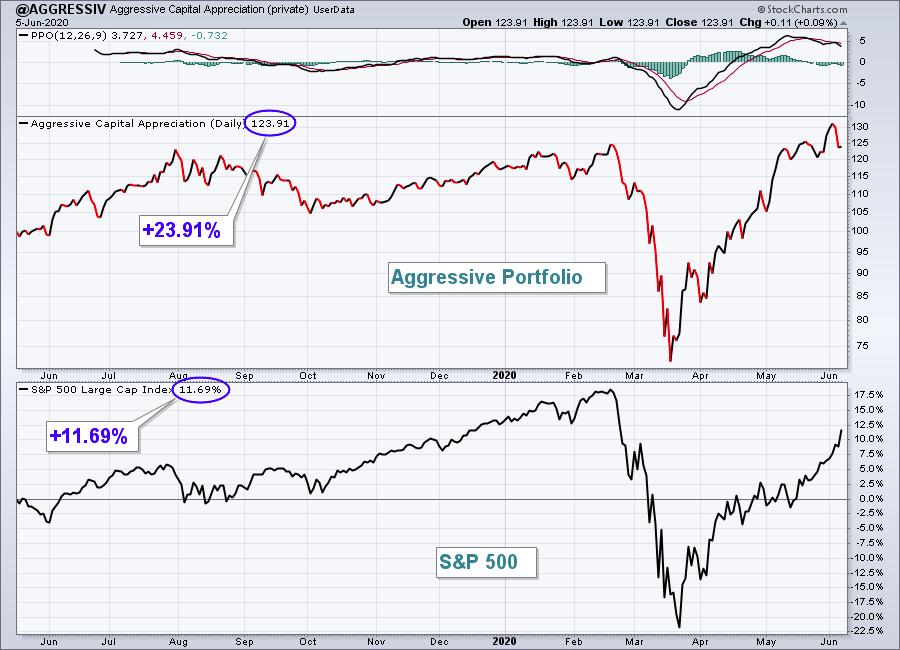
The Aggressive portfolio was fine through Tuesday, but then fell apart and ended the week with a 2.82% loss. Here's the Aggressive portfolio chart since its inception on May 19, 2019:
Here are how the Aggressive portfolio component stocks performed last week:
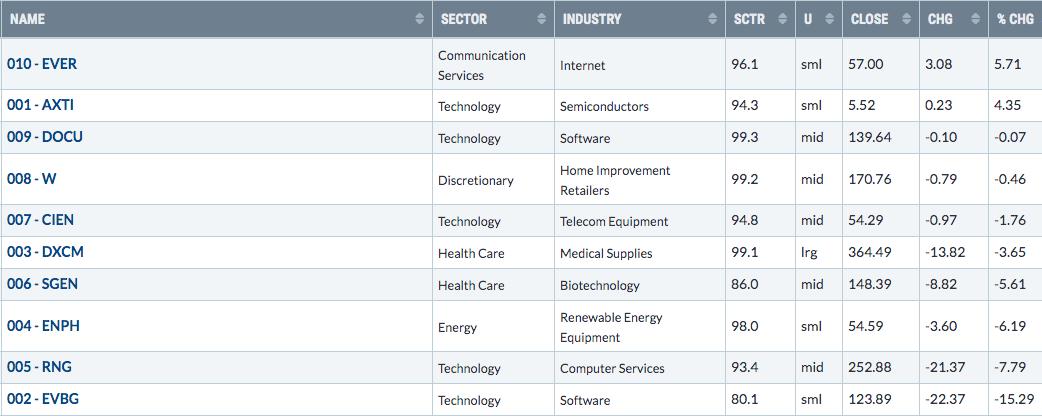
Only two Aggressive Portfolio stocks performed well last week as the entire group was hurt by two of the five technology stocks in the portfolio. EVBG was hit hard, and while it's hurting the Aggressive Portfolio currently, I actually believe it's moving close to a very strong reward to risk BUY from a trader's perspective. Here's the current chart:
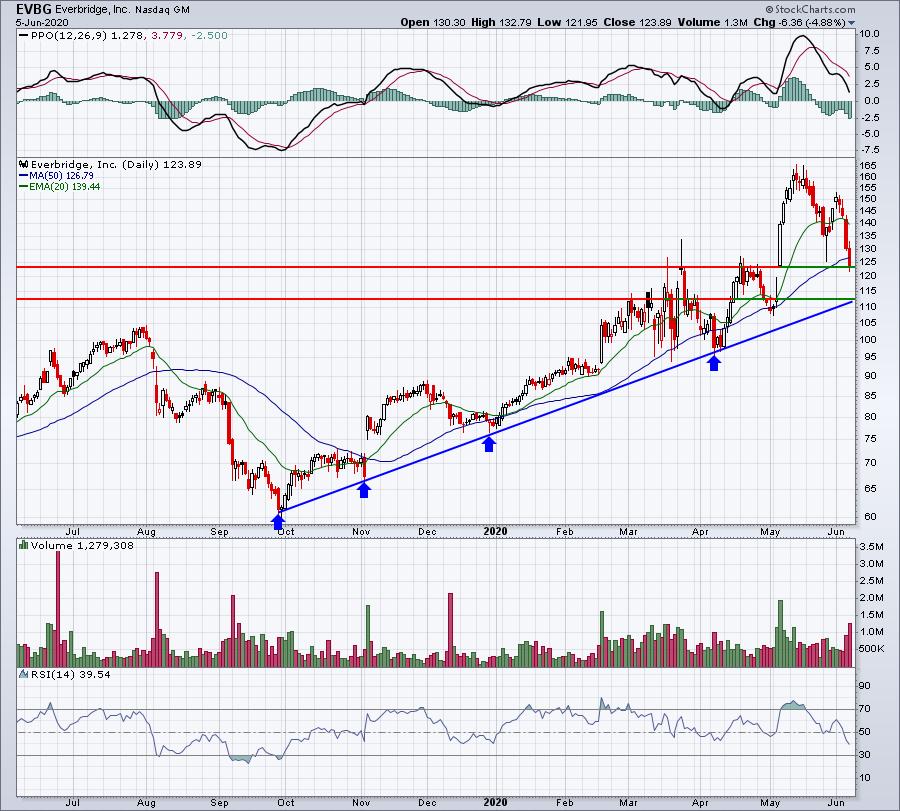
Gap support resides between 110 and 120 and trendline support intersects near that former level as well. We could see a bit more short-term weakness in EVBG, but the closer it gets to 110, the better I like it for a trade. Building a position from the current level down to 110 makes solid technical sense as well.
Income Portfolio:
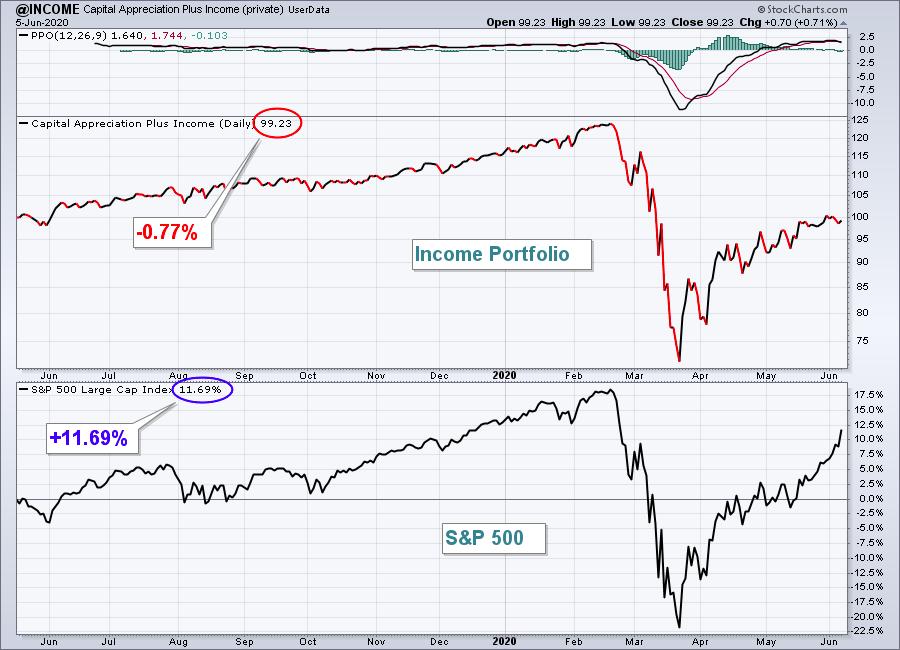
The Income portfolio fell 1.06%, falling further behind the benchmark S&P 500. Here's a look at the inception-to-date chart:
Here are how the Income portfolio component stocks performed last week:
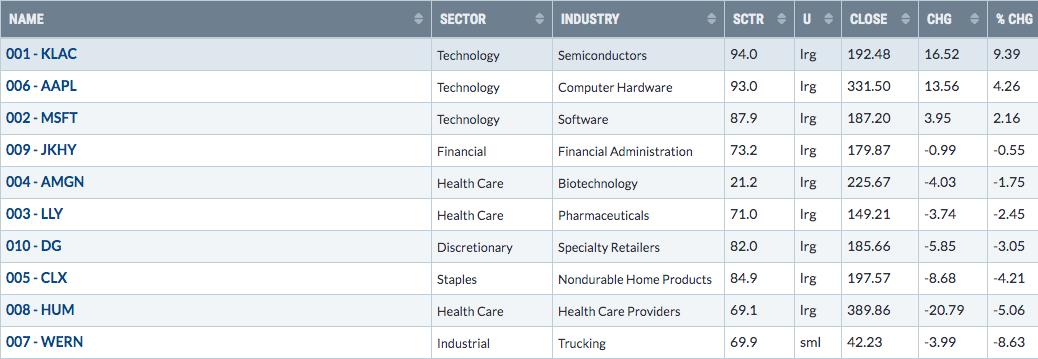
KLAC was part of a strong semiconductor group, and that helped to offset the fact that the Income Portfolio produced seven stocks that posted a loss last week.
Strong AD Portfolio:
The Strong AD Portfolio lost 1.84% last week, despite rising nearly 3% on Monday and Tuesday alone. The rotation away from relative strength took a big toll here the last few days of the week.
I was unable to get the Strong AD Portfolio chart to print again, but it's currently near the zero line. It's been flat since the May 19th announcement of portfolio stocks, trailing the S&P 500 by a wide margin. It's clearly been hurt by the IWF:IWD ratio (growth vs. value) declining nearly every day since May 19th.
Meanwhile, here are how the Strong AD portfolio component stocks performed last week:
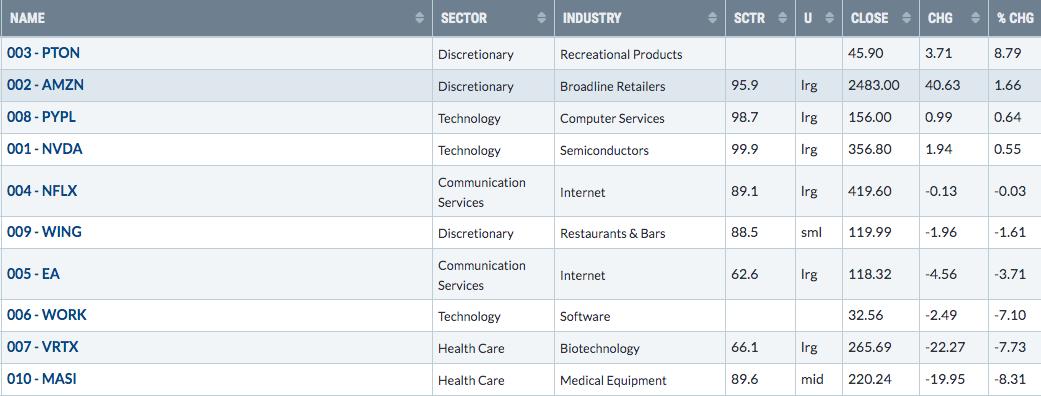
Health care and software weakness most definitely impacted this portfolio last week. The bottom three performers last week were part of those two areas of the stock market. WORK posted much better than expected quarterly revenues and EPS, but seemed to follow the "buy on rumor, sell on news" methodology.
Summary
It was a rough week for our portfolios, but I'm not discouraged in the least. First and foremost, I want to see confirmation of my secular bull market thesis. As I watched the worst of the beaten-down stocks soaring last week, it was further confirmation of exactly that - we're in a secular bull market. Airlines ($DJUSAR), which I still view as the worst industry group to own, jumped an incredible 35% just last week. It would still need to rise another 60% or so to get back to where the group was in late-February 2020. I just don't see it happening. I do still believe it'll be a long time before this area is back to anything that resembles normal. But a breakout above prior reaction price highs and massive short interest will do a lot to repair a chart quickly and that's why airlines performed so well last week. I know things improved dramatically on their charts last week, but I'd be quick to book profits there, especially if you begin to see lower daily lows print.
We select our portfolios every three months based on what we see at that time. I know the day-to-day performance of these portfolios can be trying at times, but it's the bigger picture performance that we need to remind ourselves of. The concept of continually trading 10 of the best relative performers makes good common sense to me. This strategy hasn't proven to beat the benchmark S&P 500 every quarter, but it has proven thus far that it beats it over time. A lot will likely change between now and August 19th, the date when our portfolio components will be replaced again. I'm looking forward to better portfolio performance in the weeks ahead!
Happy trading!
Tom Bowley, Chief Market Strategist
EarningsBeats.com
"Better timing. Better trades."