
EB Weekly Portfolio Report - Sunday, June 14, 2020
Upcoming Earnings Reports
According to Zacks.com, the following companies will be reporting earnings this week and each is a component of one of our portfolios:
Monday, June 15: None
Tuesday, June 16: None
Wednesday, June 17: None
Thursday, June 18: None
Friday, June 19: None
PLEASE NOTE: The above companies were provided after scanning the Zacks Earnings Calendar. My research is limited to what Zacks provides and I also can make a mistake from time to time, so please check for earnings dates for all companies that you own. We do hold our portfolio stocks through one earnings report, but every EarningsBeats.com member must make their own investing/trading decisions about holding stocks into earnings reports as it's the most volatile (risky) time to own a stock.
Portfolio Rules and Objectives
Here are the common traits and objectives of each portfolio, some of these were changed for our May 19th "draft" day recently (changes for the upcoming quarter are in bold italics):
- We have removed the Character Change portfolio and added a new Strong AD portfolio
- There are 10 leading stocks from up to 10 leading industries in each portfolio (at the time of selection). Generally, there will only be one stock per industry group, but there could be exceptions.
- They are held for an entire 90 day period, with no stops in place. We strive for consistency, transparency, and simplicity in our portfolios. EB.com members may hold these stocks for the entire 90 days, trade them, use stops, etc., but for purposes of our calculation, we will make no exceptions to our "buy and hold for three months" strategy.
- Every stock will generally be held through ONE earnings report
- The expectation is that relative winners will carry the portfolio to outperformance
- They will all be entered into as of close on Tuesday, May 19th; members may choose to try to time better entries, but EB.com will "purchase" as of May 19th's closing price
- Primary objective is to outperform the benchmark S&P 500
Here are several considerations for EB members:
- I would expect the Strong AD and Aggressive portfolios to be the riskiest, followed by the Model portfolio, and then the Income portfolio
- The Strong AD portfolio will be selected from a combination of rising accumulation/distribution lines and SCTRs above 80 at the time of selection. It will be our only portfolio that does NOT require a revenue and EPS beat in its most recent quarterly earnings report
- The Income portfolio stocks will all pay dividends, with the expected average dividend yield to be at least 1.5%
- Drawdowns (losses) should be much milder on the Income portfolio, with more volatility expected on the other three; please review inception-to-date charts below to gain an idea of the volatility associated with each
- I believe the larger drawdown on the Income portfolio last quarter was an anomaly occurring as a result of the pandemic as many defensive, higher-yielding companies uncharacteristically underperformed during a market decline.
- You should own or trade these stocks in whatever manner is most comfortable for you; while we will buy all 10 stocks in the manner identified above, feel free to trade certain stocks or wait for pullbacks if the stocks are overbought
- We have no idea what risk each member is willing or able to take. We are not registered investment advisors so be sure you understand the risk you take. Please consult your financial advisor.
- EarningsBeats.com shareholders/employees may own all or some of the portfolio stocks from time to time.
Weekly Snapshot
Here's a weekly recap:
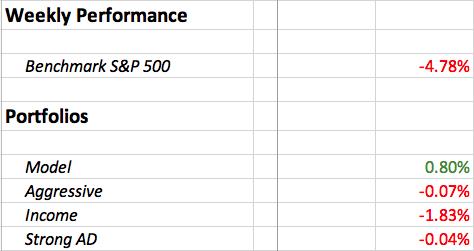
The stock market completely turned around again and favored stocks - on a relative basis - that did well during March and April. After two weeks of stellar gains, the beaten-down areas of the market fell precipitously last week. Remember how airlines ($DJUSAR) soared 35% last week? I said at the time I'd book profits, that I didn't trust that group. Well, at one point last week, the DJUSAR had fallen 20%. It did recover to finish just 8.8% lower, but it simply goes to show us how violent these swings can be.
Weekly Summary
Benchmark S&P 500:
After spiking 4.91% in the week prior, the S&P 500 dropped 4.78% last week. I am going to show you the performance of each of our ChartLists again, because it really does give us tremendous feedback as to what's taking place in the market:
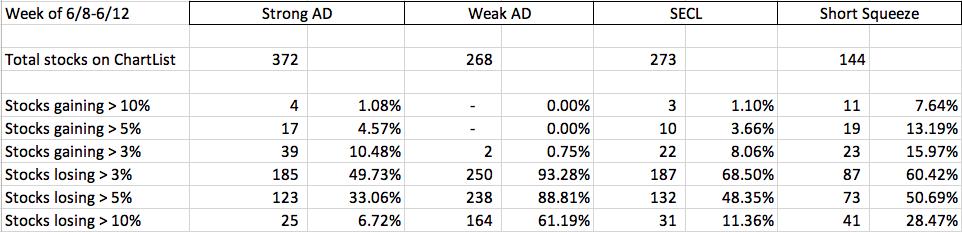
Rotation has been crazy, both into and out of our ChartLists. One week ago, our summary showed that everyone was buying every stock on our Weak AD ChartList. 70% of the Weak AD ChartList gained 20% or more one week ago. 97% of these stocks outperformed the S&P 500. Last week, it went the other way. Roughly 90% of the Weak AD ChartList stocks underperformed the S&P 500. While I wouldn't say the Strong AD ChartList was on fire, by any means, it was clear that this group was much preferred on a relative basis.
Perhaps the biggest question over the next 4-5 weeks is which group will Wall Street favor as we roll towards earnings? I believe it'll be the Strong AD ChartList stocks, but we'll be watching it develop, week in and week out.
Model Portfolio:
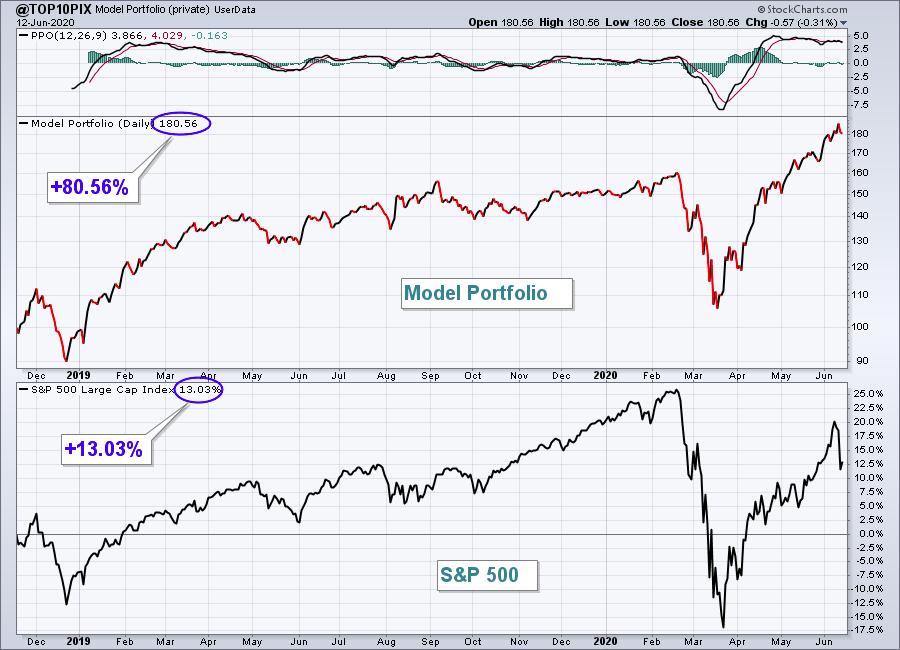
The Model portfolio advanced 0.80%, another huge gain for this portfolio vs. the S&P 500. Here's the updated inception-to-date chart of the portfolio:
Here are how the Model portfolio component stocks performed last week:
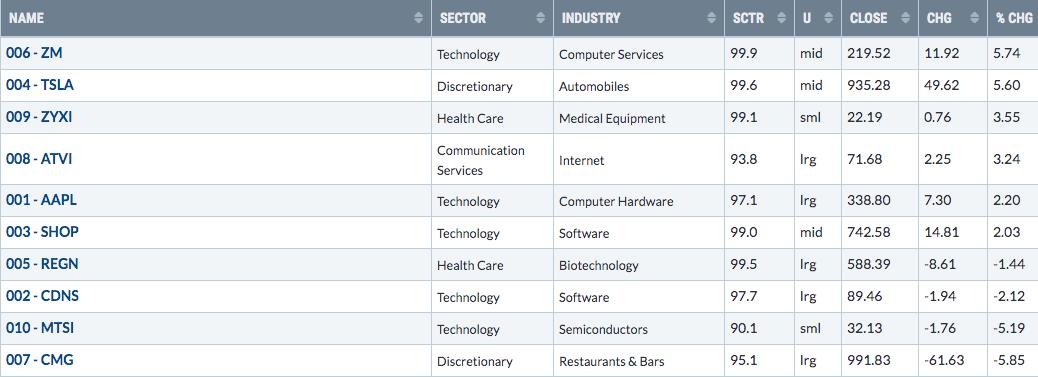
The outperformance since inception grew to 67 percentage points, which is simply outstanding. All of our Model Portfolio stocks have SCTR scores in the 90s, as they each continue to display sound relative strength. 8 of the 10 stocks outperformed the S&P 500 and 6 actually finished with gains last week.
Aggressive Portfolio:
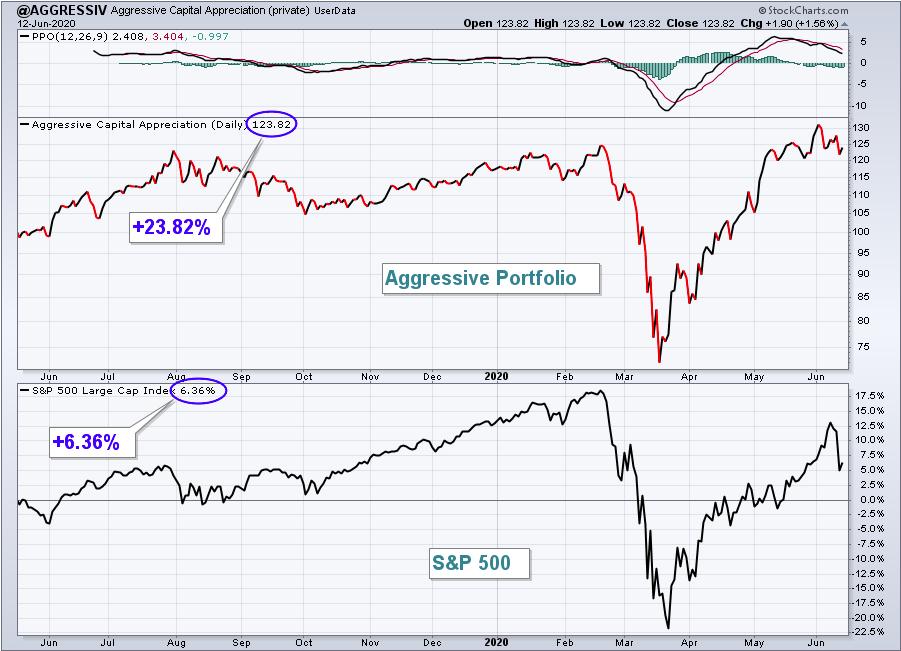
The Aggressive portfolio was flat, though it did end the week with a slight 0.07% loss. Here's the Aggressive portfolio chart since its inception on May 19, 2019:
Here are how the Aggressive portfolio component stocks performed last week:
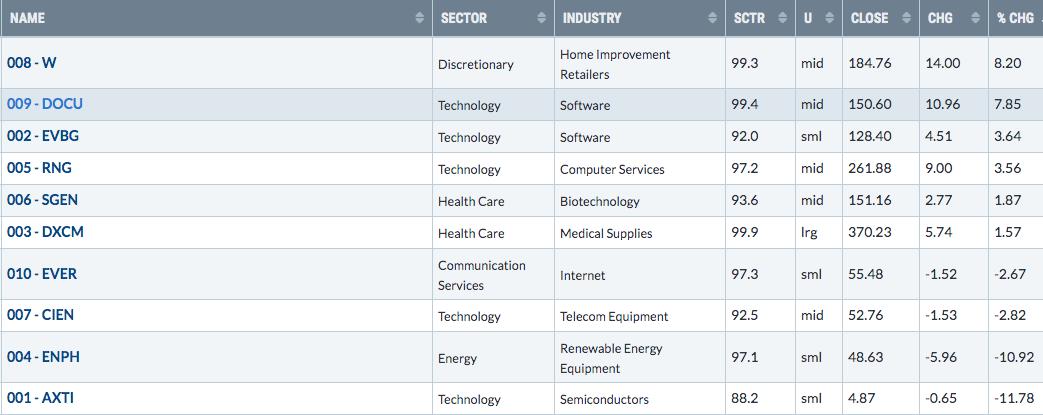
ENPH and AXTI both struggled and returned to their respective 50 day SMAs, but, like the Model Portfolio, the Aggressive Portfolio had 6 stocks that finished with gains for the week, including significant gains for both W and DOCU. Also, I had mentioned that EVBG was poised for a solid reward to risk trading entry last week. It ran up 10% by Wednesday before selling off with the overall market to close out the week.
Income Portfolio:
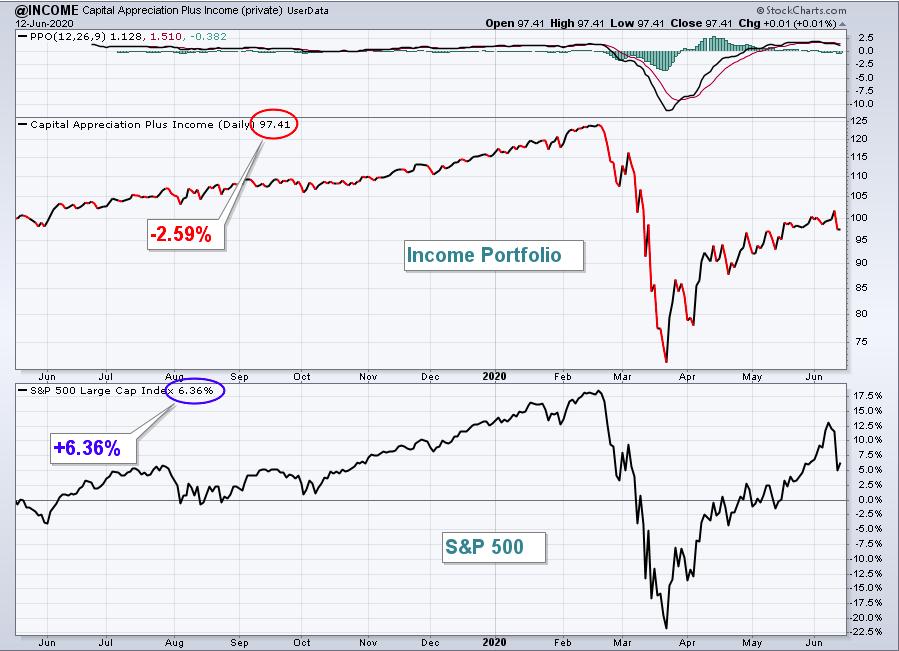
The Income portfolio dropped 1.83%, but still easily outperformed the benchmark S&P 500. Here's a look at the inception-to-date chart:
Here are how the Income portfolio component stocks performed last week:
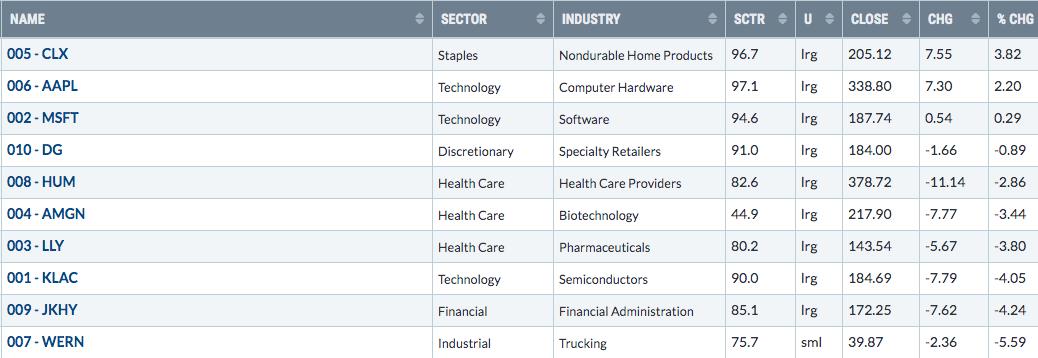
Only 3 of our Income Portfolio stocks gained ground last week, but 9 of the 10 outperformed the S&P 500. WERN was our lone underperformer.
Strong AD Portfolio:
The Strong AD Portfolio saw only a fractional loss last week, falling 0.04%. Here's a look at the inception-to-date chart:
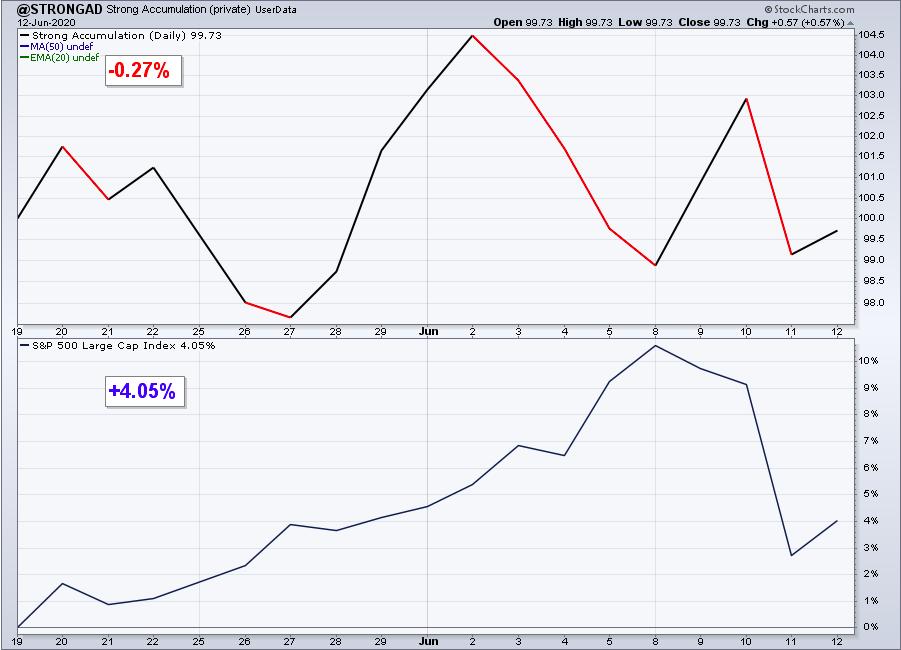
Here are how the Strong AD portfolio component stocks performed last week: :
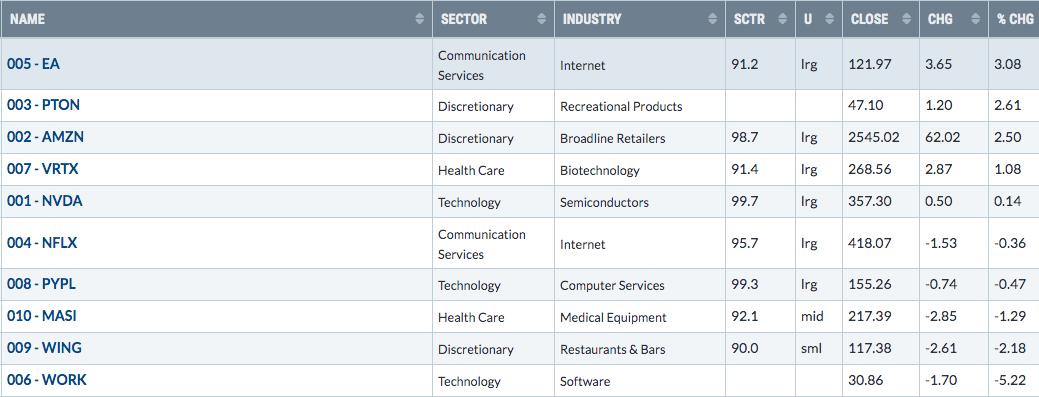
9 of 10 Strong AD Portfolio stocks beat the S&P 500. Only WORK failed to do so, but its accumulation/distribution line rose to new highs last week, despite the more than 5% drop:
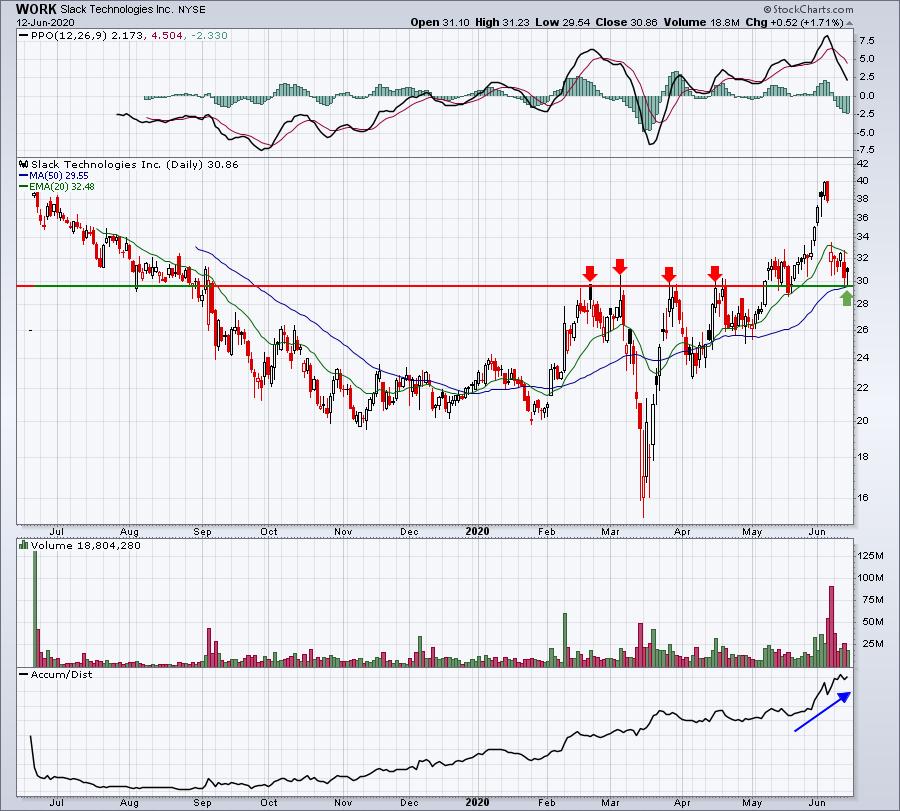
I'd expect to see WORK hold onto support just below 30.00.
Summary
If you had told me a month ago that software ($DJUSSW) and health care (XLV) would significantly underperform the S&P 500, I'd have thought our portfolios would be getting hit very hard. We definitely favor growth-oriented companies but, for the most part, the last month's rally has been more about value, or econonomically-sensitive, stocks. Look at this chart:
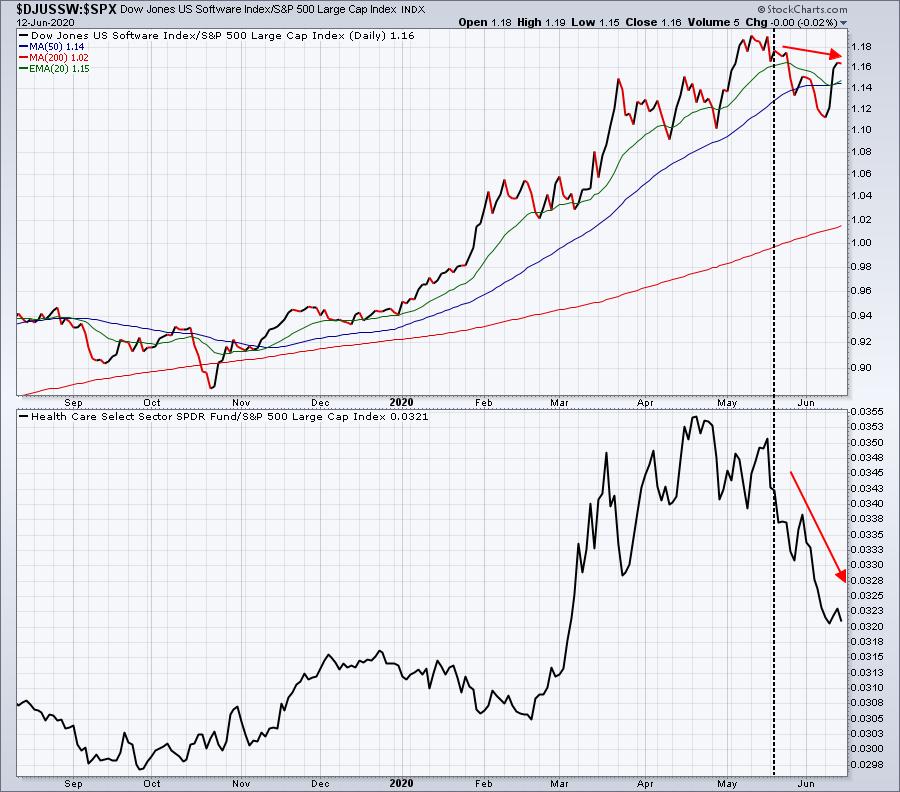
The black-dotted vertical line highlights the May 19th start date for our latest portfolios. Software, and especially health care, have been relative laggards. So it's somewhat surprising that our Model Portfolio is beating the S&P 500 this quarter given that there are 2 software stocks (SHOP, CDNS) and 2 health care stocks (ZYXI, REGN) in this portfolio. That's 40% of our portfolio stocks.
Last week's overall market selling will provide a test for the bulls. Has a major top now been established or is it just a temporary one? My bet will be on the latter, but Thursday's selling on very heavy volume cannot be completely ignored. I did like the afternoon tumble on the Volatility Index ($VIX) on Friday, but will we see follow-through to the downside on the VIX? If so, then the worst is probably behind us. If not, then expect 50 day SMA tests next.
Happy trading!
Tom Bowley, Chief Market Strategist
EarningsBeats.com
"Better timing. Better trades."