
EB Weekly Portfolio Report - Sunday, June 28, 2020
Upcoming Earnings Reports
According to Zacks.com, the following companies will be reporting earnings this week and each is a component of one of our portfolios:
Monday, June 29: None
Tuesday, June 30: None
Wednesday, July 1: None
Thursday, July 2: None
Friday, July 3: None - U.S. Stock Market Closed in observance of Independence Day
PLEASE NOTE: The above companies were provided after scanning the Zacks Earnings Calendar. My research is limited to what Zacks provides and I also can make a mistake from time to time, so please check for earnings dates for all companies that you own. We do hold our portfolio stocks through one earnings report, but every EarningsBeats.com member must make their own investing/trading decisions about holding stocks into earnings reports as it's the most volatile (risky) time to own a stock.
Portfolio Rules and Objectives
Here are the common traits and objectives of each portfolio, some of these were changed for our May 19th "draft" day recently (changes for the upcoming quarter are in bold italics):
- We have removed the Character Change portfolio and added a new Strong AD portfolio
- There are 10 leading stocks from up to 10 leading industries in each portfolio (at the time of selection). Generally, there will only be one stock per industry group, but there could be exceptions.
- They are held for an entire 90 day period, with no stops in place. We strive for consistency, transparency, and simplicity in our portfolios. EB.com members may hold these stocks for the entire 90 days, trade them, use stops, etc., but for purposes of our calculation, we will make no exceptions to our "buy and hold for three months" strategy.
- Every stock will generally be held through ONE earnings report
- The expectation is that relative winners will carry the portfolio to outperformance
- They will all be entered into as of close on Tuesday, May 19th; members may choose to try to time better entries, but EB.com will "purchase" as of May 19th's closing price
- Primary objective is to outperform the benchmark S&P 500
Here are several considerations for EB members:
- I would expect the Strong AD and Aggressive portfolios to be the riskiest, followed by the Model portfolio, and then the Income portfolio
- The Strong AD portfolio will be selected from a combination of rising accumulation/distribution lines and SCTRs above 80 at the time of selection. It will be our only portfolio that does NOT require a revenue and EPS beat in its most recent quarterly earnings report
- The Income portfolio stocks will all pay dividends, with the expected average dividend yield to be at least 1.5%
- Drawdowns (losses) should be much milder on the Income portfolio, with more volatility expected on the other three; please review inception-to-date charts below to gain an idea of the volatility associated with each
- I believe the larger drawdown on the Income portfolio last quarter was an anomaly occurring as a result of the pandemic as many defensive, higher-yielding companies uncharacteristically underperformed during a market decline.
- You should own or trade these stocks in whatever manner is most comfortable for you; while we will buy all 10 stocks in the manner identified above, feel free to trade certain stocks or wait for pullbacks if the stocks are overbought
- We have no idea what risk each member is willing or able to take. We are not registered investment advisors so be sure you understand the risk you take. Please consult your financial advisor.
- EarningsBeats.com shareholders/employees may own all or some of the portfolio stocks from time to time.
Weekly Snapshot
Here's a weekly recap:
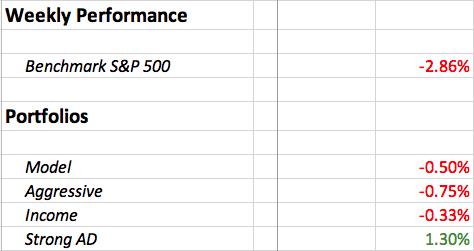
All four of our portfolios handily outperformed the benchmark S&P 500 as money rotated - as it did back in March and April - to stocks expected to perform well in a socially-distanced environment.
Weekly Summary
Benchmark S&P 500:
The S&P 500 lost 2.86% last week. If we glance at the performance last week from our various EarningsBeats.com ChartLists, however, it's apparent why our portfolios outperformed:
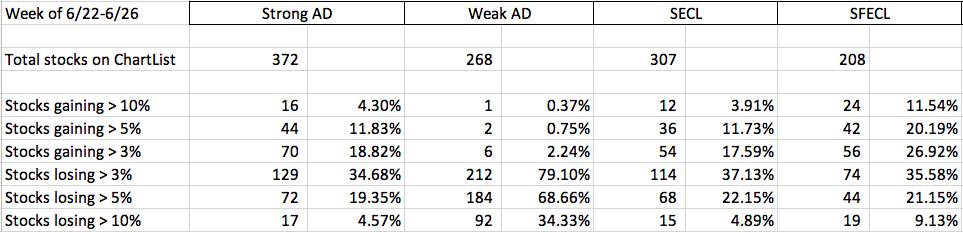
Our portfolio stocks are derived from the Strong Accumulation/Distribution Chart List (Strong AD) and our Strong Earnings ChartList (SECL). The S&P 500 lost nearly 3% last week. So just check out the line where I show "Stocks losing > 3%". The Strong AD and SECL show 34.68% and 37.13% of their stocks, respectively, underperforming the S&P 500. By using simple math, that means that 65.32% and 62.87%, respectively, outperformed. Meanwhile, check out the Weak AD ChartList and the fact that 79.10% underperformed. If you're trading the wrong group of stocks, your chances of success are not good.
Model Portfolio:
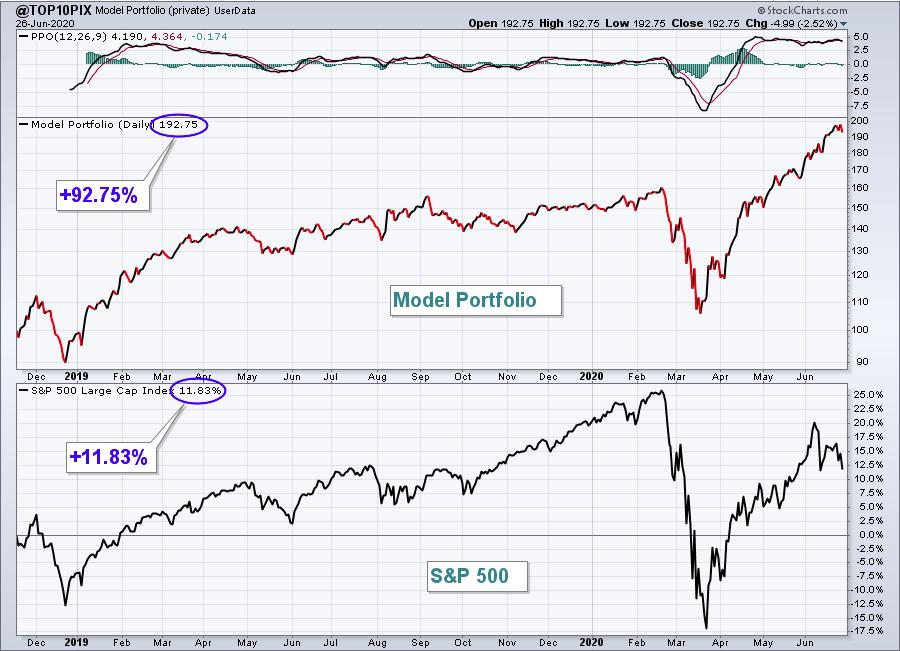
The Model portfolio fell 0.50% last week, but easily outperformed the benchmark S&P 500. Here's the updated inception-to-date chart of the portfolio:
Here are how the Model portfolio component stocks performed last week:
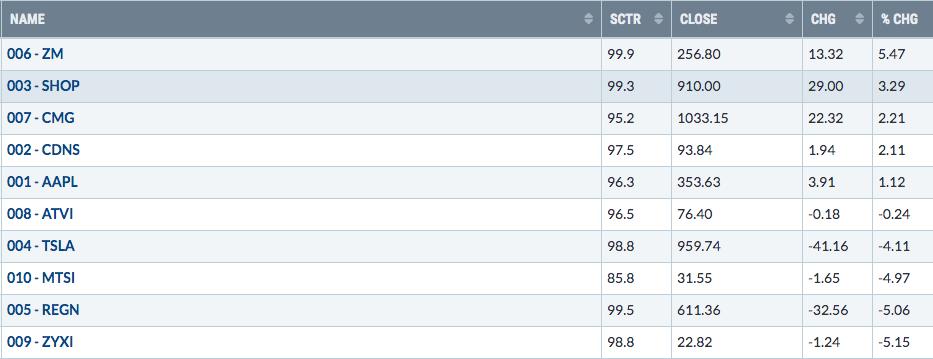
Two familiar stocks - ZM and SHOP - enabled the Model portfolio to easily beat the S&P 500 last week, despite underperformance by four component stocks, most notably REGN and ZYXI, our two health care stocks.
Aggressive Portfolio:
The Aggressive portfolio lost 0.75%, but too handily beat the benchmark. Here's the Aggressive portfolio chart since its inception on May 19, 2019:
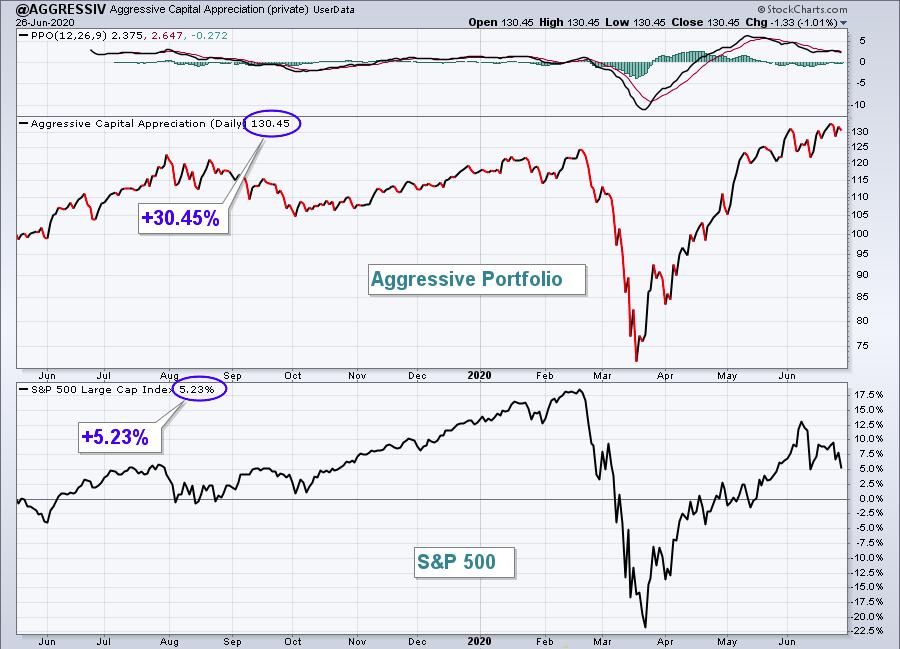
Here are how the Aggressive portfolio component stocks performed last week:
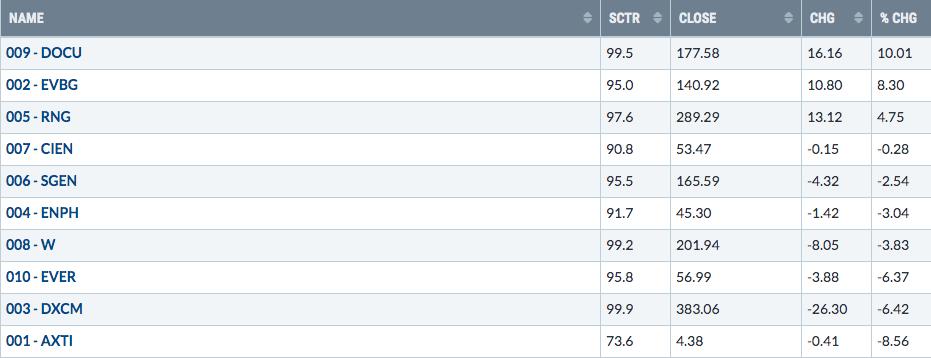
DOCU has been relentless to the upside and that strength continued last week, helping to offset weakness in a few Aggressive portfolio companies. AXTI, one of those weak performers, has not seen a close below 4.02 since reporting very strong quarterly results after the close on April 22nd. Here's a 6 month chart to show where I'd look for MAJOR support, if it gets there:
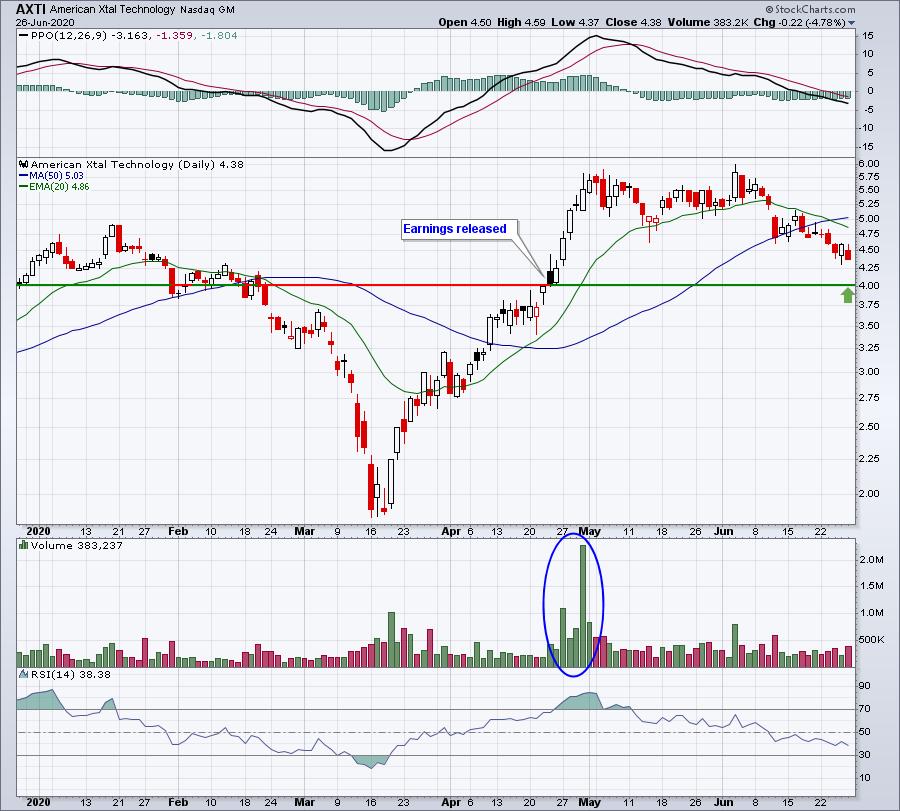
Volume exploded higher after that last earnings report and I would not be shocked at all to see AXTI make a pre-earnings run over the next few weeks. For those that might be trading these portfolio stocks, instead of buying and holding for 90 days, watch for a reversal at that 4.02 level. I'm not saying we'll get there, but if we do, a heavy volume reversal there could mark a major bottom.
Income Portfolio:
The Income portfolio showed a slight loss of 0.33% as it tries to catch the S&P 500 on a cumulative basis. Here's a look at the inception-to-date chart:
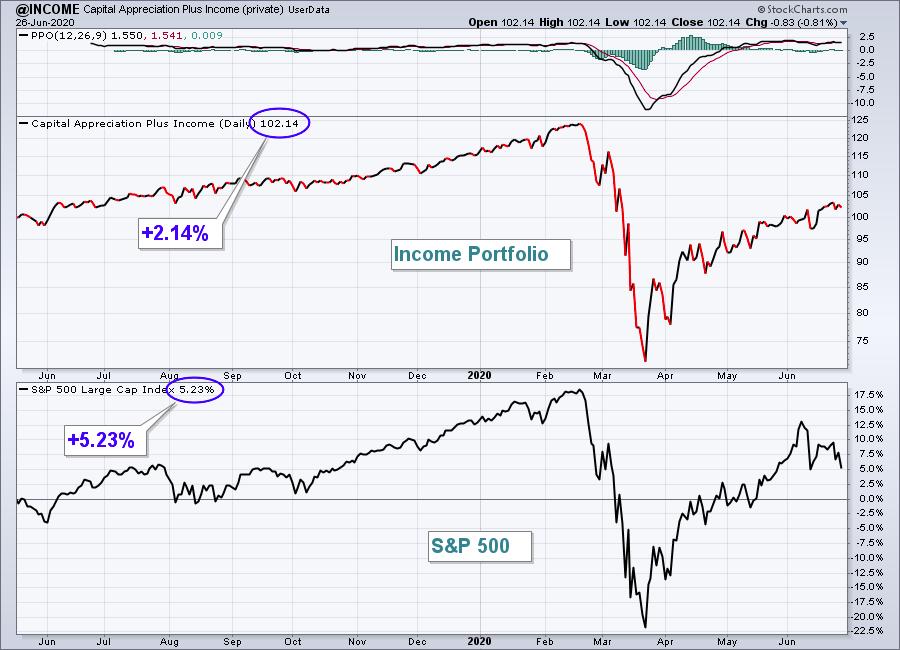
Here are how the Income portfolio component stocks performed last week:
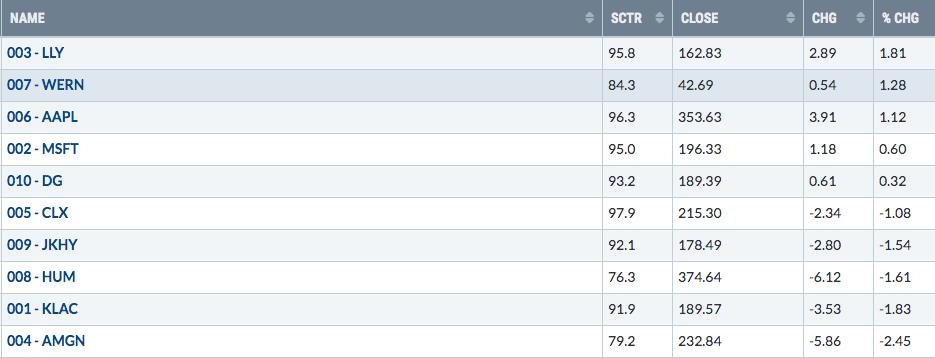
AMGN and HUM, two health care names that have seen their SCTR scores drop below 80, were among last week's losers here, but it should be noted that all 10 Income portfolio stocks beats the S&P 500's drop of 2.86% last week.
Strong AD Portfolio:
The Strong AD Portfolio actually gained ground last week, rising 1.30%, outperforming the S&P 500 by more than 4 percentage points. Here's a look at the inception-to-date chart:
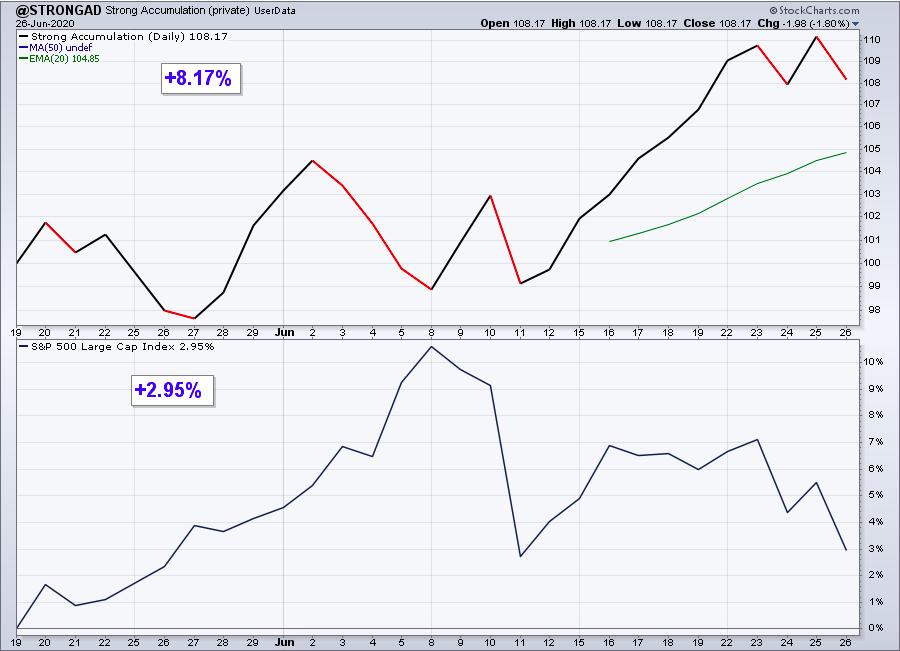
Here are how the Strong AD portfolio component stocks performed last week:
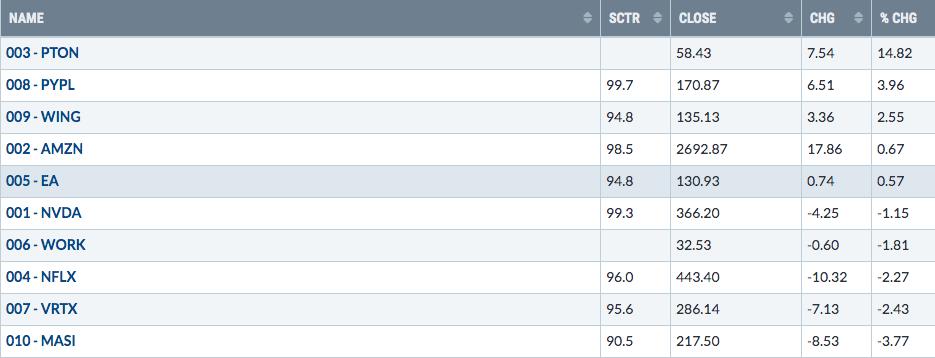
9 of the 10 component stocks beat the S&P 500 last week, which was very encouraging, but the significant outperformance occurred because PTON had a HUGE week.
Summary
Earnings are just a few short weeks away and I believe Wall Street professionals have begun rotating out of names that will likely suffer through a very rough earnings season, while accumulating companies that are much more likely to not only beat consensus estimates, but also potentially raise guidance.
Last weekend I sent out a "State of the Market" email and I indicated the industry groups that Wall Street is currently favoring. Those are the groups we should be favoring as well. I believe those groups are very well represented in our portfolios and I'm expecting further outperformance by our four portfolios in the coming weeks.
Happy trading!
Tom Bowley, Chief Market Strategist
EarningsBeats.com
"Better timing. Better trades."